| Issue |
A&A
Volume 652, August 2021
|
|
|---|---|---|
| Article Number | A98 | |
| Number of page(s) | 40 | |
| Section | Extragalactic astronomy | |
| DOI | https://doi.org/10.1051/0004-6361/202141075 | |
| Published online | 17 August 2021 | |
The Galaxy Activity, Torus, and Outflow Survey (GATOS)
I. ALMA images of dusty molecular tori in Seyfert galaxies
1
Observatorio Astronómico Nacional (OAN-IGN)-Observatorio de Madrid, Alfonso XII, 3, 28014 Madrid, Spain
e-mail: This email address is being protected from spambots. You need JavaScript enabled to view it.
2
Centro de Astrobiología (CSIC-INTA), ESAC Campus, 28692 Villanueva de la Cañada, Madrid, Spain
3
Instituto de Astrofísica de Canarias, Calle Vía Láctea, s/n, 38205 La Laguna, Tenerife, Spain
4
Departamento de Astrofísica, Universidad de La Laguna, 38205 La Laguna, Tenerife, Spain
5
Instituto de Radioastronomía y Astrofísica (IRyA-UNAM), 3-72(Xangari), 8701 Morelia, Mexico
6
LERMA, Observatoire de Paris, Collège de France, PSL University, CNRS, Sorbonne University, Paris, France
7
Department of Physics & Astronomy, University of Southampton, Hampshire S17 1BJ, Southampton, UK
8
Department of Physics & Astronomy, University of Alaska Anchorage, Anchorage, AK 99508-4664, USA
9
INAF – Osservatorio Astrofisico di Arcetri, Largo Enrico Fermi 5, 50125 Firenze, Italy
10
Centre for Extragalactic Astronomy, Department of Physics, Durham University, South Road, Durham DH1 3LE, UK
11
Max-Planck-Institut für Extraterrestrische Physik, Garching, Germany
12
Astronomical Institute, Academy of Sciences, Boĉní II 1401, 14131 Prague, Czechia
13
Department of Physics, University of Oxford, Denys Wilkinson Building, Keble Road, Oxford OX13RH, UK
14
Leiden Observatory, PO Box 9513 2300 RA Leiden, The Netherlands
15
Centro de Astrobiología (CSIC-INTA), Carretera de Ajalvir, 28850 Torrejón de Ardoz, Madrid, Spain
16
Institute of Astrophysics, Foundation for Research and Technology-Hellas, 71110 Heraklion, Greece
17
Astronomical Institute, Tohoku University 6-3 Aramaki, Aoba-ku, Sendai 980-8578, Japan
18
National Astronomical Observatory of Japan, National Institutes of Natural Sciences (NINS), 2-21-1 Osawa, Mitaka, Tokyo 181-8588, Japan
19
Department of Astronomy, School of Science, The Graduate University for Advanced Studies, SOKENDAI, Mitaka, Tokyo 181-8588, Japan
20
Space Telescope Science Institute, Baltimore, MD 21218, USA
21
Kavli Institute for Particle Astrophysics & Cosmology (KIPAC), Stanford University, Stanford, CA 94305, USA
22
SOFIA Science Center, NASA Ames Research Center, Moffett Field, CA 94035, USA
23
The University of Texas at San Antonio, One UTSA Circle, San Antonio, TX 78249, USA
24
Núcleo de Astronomía de la Facultad de Ingeniería, Universidad Diego Portales, Av. Ejército Libertador 441, Santiago, Chile
25
Kavli Institute for Astronomy and Astrophysics, Peking University, Beijing 100871, PR China
26
LESIA, Observatoire de Paris, PSL Research University, CNRS, Sorbonne Universités, UPMC Univ. Paris 06, Univ. Paris Diderot, Sorbonne Paris Cité, 5 place Jules Janssen, 92190 Meudon, France
27
Astronomical Observatory, Volgina 7, 11060 Belgrade, Serbia
28
Sterrenkundig Observatorium, Universiteit Ghent, Krijgslaan 281-S9, Ghent 9000, Belgium
29
Kagoshima University, Graduate School of Science and Engineering, Kagoshima 890-0065, Japan
30
Ehime University, Research Center for Space and Cosmic Evolution, Matsuyama 790-8577, Japan
31
Hokkaido University, Faculty of Science, Sapporo 060-0810, Japan
Received:
13
April
2021
Accepted:
22
June
2021
Abstract
We present the first results of the Galaxy Activity, Torus, and Outflow Survey (GATOS), a project aimed at understanding the properties of the dusty molecular tori and their connection to the host galaxy in nearby Seyfert galaxies. Our project expands the range of active galactic nuclei (AGN) luminosities and Eddington ratios covered by previous surveys of Seyferts conducted by the Atacama Large Millimeter Array (ALMA), allowing us to study the gas feeding and feedback cycle in a combined sample of 19 Seyferts. We used ALMA to obtain new images of the emission of molecular gas and dust using the CO(3–2) and HCO+(4–3) lines as well as their underlying continuum emission at 870 μm with high spatial resolutions (0.1″ ∼ 7 − 13 pc) in the circumnuclear disks (CND) of ten nearby (D < 28 Mpc) Seyfert galaxies selected from an ultra-hard X-ray survey. Our new ALMA observations detect 870 μm continuum and CO line emission from spatially resolved disks located around the AGN in all the sources. The bulk of the 870 μm continuum flux can be accounted for by thermal emission from dust in the majority of the targets. For most of the sources, the disks show a preponderant orientation perpendicular to the AGN wind axes, as expected for dusty molecular tori. The median diameters and molecular gas masses of the tori are ∼42 pc and ∼6 × 10⁵ M⊙, respectively. We also detected the emission of the 4–3 line of HCO+ in four GATOS targets. The order of magnitude differences found in the CO/HCO+ ratios within our combined sample point to a very different density radial stratification inside the dusty molecular tori of these Seyferts. We find a positive correlation between the line-of-sight gas column densities responsible for the absorption of X-rays and the molecular gas column densities derived from CO toward the AGN in our sources. Furthermore, the median values of both column densities are similar. This suggests that the neutral gas line-of-sight column densities of the dusty molecular tori imaged by ALMA significantly contribute to the obscuration of X-rays. The radial distributions of molecular gas in the CND of our combined sample show signs of nuclear-scale molecular gas deficits. We also detect molecular outflows in the sources that show the most extreme nuclear-scale gas deficits in our sample. These observations find for the first time supporting evidence that the imprint of AGN feedback is more extreme in higher luminosity and/or higher Eddington ratio Seyfert galaxies.
Key words: galaxies: active / galaxies: ISM / galaxies: Seyfert / galaxies: nuclei / galaxies: evolution
© ESO 2021
1. Introduction
The fueling of super-massive black holes (SMBHs), a common element of the spheroidal components of galaxies, explains the onset of nuclear activity. High-resolution observations of molecular gas in nearby active galactic nuclei (AGN) have played a key role in addressing the question of AGN fueling (e.g., see reviews by García-Burillo & Combes 2012; Storchi-Bergmann & Schnorr-Müller 2019). These observations have also revealed that gas accretion onto SMBHs and their hosts can be regulated through the launching of molecular outflows in galaxies (e.g., Fluetsch et al. 2019; Lutz et al. 2020; Veilleux et al. 2020). Molecular outflows have been mapped across a wide range of spatial scales in different galaxy populations. In the particular case of nearby AGN, these outflows have been imaged on nuclear scales in dusty molecular tori and their surroundings (approximately tens of pc), but also on the larger scales typical of circumnuclear disks (CND) (approximately hundreds of pc) (García-Burillo et al. 2014, 2019; Morganti et al. 2015; Gallimore et al. 2016; Aalto et al. 2017; Alonso-Herrero et al. 2018, 2019; Impellizzeri et al. 2019; Domínguez-Fernández et al. 2020). These different manifestations of the outflow phenomenon constitute a key ingredient to understanding the co-evolution of galaxies and SMBHs.
The simplest version of the unified model of AGN explains their observational properties as only due to different lines of sight toward the central engine. In type 2 AGN, the obscuring material blocks our view of the broad line region (BLR) and only emission from the narrow line region (NLR) is seen (e.g., Antonucci & Miller 1985; Antonucci 1993; Krolik & Begelman 1988; Urry & Padovani 1995). Type 1 AGN have an unobscured view and thus emission from both the BLR and NLR is observed. Different observational properties led to an initial description of the obscuring material as an optically and geometrically thick torus (e.g., Pier & Krolik 1992, 1993), although other geometries were also considered, including flared, tapered, and warped disks (e.g., Sanders et al. 1989; Efstathiou & Rowan-Robinson 1995). More recently, the simplest version of unifying theories has been debated due to the large observed spread in properties of the toroidal obscuration in AGN (Ramos Almeida et al. 2009a, 2011; Alonso-Herrero et al. 2011; Elitzur 2012; Mateos et al. 2016; García-Bernete et al. 2019). The application of the torus paradigm has also been questioned in the early universe, where conditions may be significantly different from those observed locally (Netzer 2015).
In the canonical scheme, the torus is expected to be located between the BLR and the NLR, and extend to parsec scales. More complex models were developed in recent decades as the community started to probe the morphology, content, and radial extent of the circumnuclear gas in active galaxies (e.g., see the reviews by Bianchi et al. 2012; Ramos Almeida & Ricci 2017). The first torus models were static and, for computational reasons, the dust was distributed homogeneously (Pier & Krolik 1992, 1993; Granato & Danese 1994; Efstathiou & Rowan-Robinson 1995). The torus size was allowed to range from compact (a few parsecs) to a few hundred parsecs, depending on the model. With the introduction of the so-called clumpy torus model (Nenkova et al. 2002, 2008a,b), obscuration depends not only on the inclination but also on the number of clouds along the line of sight, that is, on the covering factor. Clumpy torus models received observational support from the measurement of significant variations in the absorbing column density derived from X-ray observations on timescales ranging from days to years (e.g., Risaliti et al. 2002; Markowitz et al. 2014).
The detection of extended mid-infrared emission along the torus polar direction, initially in NGC 1068 and later on in other nearby AGN, prompted the inclusion of a polar component in the models (see Efstathiou et al. 1995; Gallagher et al. 2015; Hönig & Kishimoto 2017; Stalevski et al. 2017). The mid-infrared polar component has been observationally resolved on parsec scales with interferometry (Tristram et al. 2009, 2014; Hönig et al. 2012, 2013; Burtscher et al. 2013; López-Gonzaga et al. 2014, 2016) and extends out to a few hundred parsecs as revealed by ground-based imaging facilities (Radomski et al. 2003; Packham et al. 2005; Galliano et al. 2005; Roche et al. 2006; Asmus et al. 2016; García-Bernete et al. 2016; Asmus 2019). Polar dust might also provide a natural explanation to the apparent isotropy of the infrared emission observed in AGN, irrespective of obscuring column density (e.g., Gandhi et al. 2009; Levenson et al. 2009; Asmus et al. 2015; Fuller et al. 2019).
The static torus and disk-wind models are effectively the starting point for more realistic dynamical models to explain the formation, maintenance, and the eventual disappearance of the obscuring material around AGN. On small scales the height of the obscuring material is proposed to be maintained by the AGN radiation pressure (Pier & Krolik 1992), infrared radiation pressure (e.g., Krolik 2007; Williamson et al. 2019; Hönig 2019; Venanzi et al. 2020; Tazaki & Ichikawa 2020), magnetic support (Emmering et al. 1992; Elitzur & Shlosman 2006; Chan & Krolik 2017; Vollmer et al. 2018; Kudoh et al. 2020; Lopez-Rodriguez et al. 2020), and/or stellar feedback (Wada & Norman 2002). Radiation hydrodynamical simulations including some of these physical processes predict the launch of outflows. These can extend to scales of tens of parsecs mostly along the polar direction (Wada 2012, 2015; Wada et al. 2016; Chan & Krolik 2016, 2017; Williamson et al. 2020). These simulations also produce outflow components along the equatorial direction of the nuclear torus/disk. The new paradigm is now a “dynamical torus” that has the inflowing (but also outflowing, see Venanzi et al. 2020) reservoir of fueling material along the equatorial plane. The boosted acceleration due to infrared radiation pressure near the inner walls of the torus can lift up material from the equatorial plane and launch a dusty and molecular wind. Under certain conditions part of this material can rain back down onto the equatorial plane (see Wada et al. 2016) or loop back toward the inner region on ballistic orbits (see Williamson et al. 2020). In this new scenario for the torus, the equatorial and polar components both contribute to the obscuration of the central engine and the nature of the obscuring material around AGN is complex (see reviews by Ramos Almeida & Ricci 2017; Hönig 2019).
Atacama Large Millimeter Array (ALMA) observations with physical resolutions of a few parsecs to ∼10 − 20 pc are providing strong support for this scenario. The first ALMA detection of an AGN torus was for the Seyfert galaxy NGC 1068 (García-Burillo et al. 2016, 2019; Gallimore et al. 2016; Imanishi et al. 2018, 2020; Impellizzeri et al. 2019). The measured torus diameter (ranging from 7 to up to 30 pc) from a variety of molecular transitions and dust continuum emission is a factor of a few larger than found by the mid-IR observations, which are tracing warmer emission originating in a more compact region. More recently, the K-band observations done with the VLT/GRAVITY instrument have imaged the inner dust sublimation region inside the torus of NGC 1068 (Gravity Collaboration 2020). The NGC 1068 torus is not by any means unique. Relatively large (diameters of up to 20–50 pc) and massive (∼105 − 107 M⊙) tori/disks are detected in cold molecular gas in local Seyferts, low-luminosity AGN, and compact obscured nuclei (Aalto et al. 2017, 2019, 2020; Alonso-Herrero et al. 2018, 2019; Izumi et al. 2018; Salak et al. 2018; Combes et al. 2019; Audibert et al. 2019, 2020). The nuclear tori/disks detected with ALMA are not found in isolation at the centers of AGN but are well connected with molecular gas in the galaxy disk and can be decoupled both morphologically and kinematically from their host galaxies. Rather than a simple compact rotating structure, the torus also appears to be highly turbulent (García-Burillo et al. 2016) and possibly outflowing (Gallimore et al. 2016; Alonso-Herrero et al. 2018; García-Burillo et al. 2019; Impellizzeri et al. 2019; Aalto et al. 2020). Theoretical arguments and dynamical simulations suggest that these phenomena could be associated with the “outflowing torus” scenario described above.
This is the first paper in a series aimed at understanding the properties of the dusty molecular tori1 and the connection to their host galaxies in nearby Seyfert sources. This is one of the main goals of our Galaxy Activity, Torus, and Outflow Survey (GATOS). In the second paper of this series (Paper II: Alonso-Herrero et al. 2021; hereafter AH21), we will study the relation between the torus and polar dust emissions, and compare them with predictions from disk+wind models. To select our Seyfert galaxies, we used the 70 month Swift/BAT 14 − 195 keV all-sky catalog (Baumgartner et al. 2013) to draw our parent sample from. This catalog provides a sample that is unbiased of obscuration/absorption, even up to column densities of NH ≃ 1024 cm−2 as well as providing a nearly complete selection for nearby AGN at LAGN(14 − 150 keV) > 1042 erg s−1. Optical and IR AGN surveys, on the other hand, can be incomplete for nearby galaxies and biased against AGN with strong star-formation activity. We imaged with ALMA the emission of molecular gas and dust in the CND of our targets using the CO(3–2) and HCO+(4–3) lines and their underlying continuum emission, with spatial resolutions  (7–13 pc). The use of these transitions allowed us to probe simultaneously a range of physical conditions (n(H2) ≃ a few 104-a few 106 cm−3, TK ≥ 20 − 50 K) that are well suited to probing the bulk of the gas reservoirs in the typical CND environments of AGN, which are known to host predominantly dense and hot molecular gas (García-Burillo et al. 2014, 2016; Viti et al. 2014; Gallimore et al. 2016; Imanishi et al. 2018, 2020; Impellizzeri et al. 2019). As an additional advantage of the use of the 3–2 line of CO, the analysis of the CO spectral line energy distribution of the radiation-driven fountain model of the torus discussed by Wada et al. (2018) showed that the CO–to–H2 conversion factor has a comparatively weaker dependence on the intensity for mid–J CO lines. Furthermore, the obtention of 351 GHz continuum images in our targets is a prerequisite to deriving the dust content of tori by keeping low the contribution from other mechanisms alien to thermal dust emission, which can be prevalent at lower frequencies.
The paper is organized as follows. We present in Sect. 2 the GATOS sample. Section 3 describes the ALMA observations and ancillary data used in this work. Section 4 describes the decomposition of the submillimeter continuum images of our Seyfert galaxies and derives the sizes, orientations, and masses of their dusty disks. A description of the molecular gas distributions derived from the CO(3–2) line maps is included in Sect. 5. We compare the images and line ratios derived from the CO(3–2) and HCO+(4–3) lines in Sect. 6. Section 7 discusses the relation between the dusty molecular tori and X-ray emission in our Seyferts. Section 8 compares the radial distribution of molecular gas in NUGA and GATOS Seyferts, and describes a scenario accounting for the imprint of AGN feedback. The main conclusions of this work are summarized in Sect. 9.
2. The sample
We initially selected a volume-limited sample from the Swift/BAT catalog of AGN with distances of 10 − 40 Mpc in the southern hemisphere (declinations below +20°) for our ALMA observations. We set the lower distance limit in order not to include low luminosity AGN since these are targeted by other ALMA programs (see below). The upper limit to the distance allows for a reasonably sized sample of 31 local AGN and sufficient spatial resolution to isolate the dusty molecular tori with ALMA. All our targets have modeled 14–195 keV observations from which the X-ray column densities (NH) and intrinsic (absorption corrected) hard and ultra hard X-ray luminosities in the 2 − 10 keV and 14 − 150 keV bands, respectively, are derived (Ricci et al. 2017a).
We finally selected a subset of 10 targets within the GATOS sample defined above for the new ALMA Cycle 6 observations presented in this paper. This is hereafter referred to as the GATOS core sample. We limited the distances to < 28 Mpc to be able to spatially resolve tori as small as ∼10 pc with an angular resolution of  and the luminosities to LAGN(14–150 keV) ≥ 1042 ergs−1 to complement ongoing ALMA surveys of nearby Seyferts such as the Nuclei of Galaxies (NUGA) survey (Combes et al. 2019; Audibert et al. 2019). The NUGA sample includes seven nearby low-luminosity Seyfert galaxies: NGC 613, NGC 1326, NGC 1365, NGC 1433 NGC 1566, NGC 1672, and NGC 1808. With the exception of NGC 1365, which is also originally part of the GATOS sample, the sources of NUGA have significantly lower Eddington ratios (∼10−6.5–10−3.5) and AGN luminosities (LAGN(2 − 10 keV)∼1039.1 − 41.3 erg s−1) compared to the GATOS core sample (see Combes et al. 2019, and Table 1). Hereafter, when we refer to NUGA targets we leave out NGC 1365, which satisfies the selection criterion used in the definition of GATOS sources. The sample used in this paper, listed in Table 1, contains three additional GATOS targets that have already been observed by ALMA in previous cycles in band 7 with a frequency coverage, a spatial resolution, and sensitivity similar to those of the core sample, namely, NGC 1068 (García-Burillo et al. 2019), NGC 1365 (Combes et al. 2019), and NGC 3227 (Alonso-Herrero et al. 2019). As can be seen from Fig. 1, the selection of GATOS sources listed in Table 1 probes a range of ∼2 dex in AGN luminosities (LAGN(2 − 10 keV)∼1041.4 − 43.5 erg s−1) and ∼2.7 dex in Eddington ratios (∼10−3.0–10−0.3), encompassing both unabsorbed (NH < 1022 cm−2, ∼type 1) and absorbed (NH > 1022 cm−2, ∼type 2) AGN including Compton-thick objects (NH > 1024 cm−2). Furthermore, the combination of GATOS and NUGA samples, contributing 13 and 6 targets, respectively, allows us to compile a list of 19 suitable nearby AGN. Our combined sample spans a range of ∼6 dex in Eddington ratios and ∼4.5 dex in AGN luminosities. Since our combined sample covers a relatively small volume (D < 28 Mpc), it probes lower luminosities preferentially with respect to the overall Swift/BAT sample, as illustrated by the probability density functions (PDF) shown in Fig. 1. One of the benefits of the Swift/BAT selection criteria is that it allows us to recover a large fraction of the Compton-thick AGN population in the luminosity range we probe (see Fig. 3b of Ricci et al. 2015). We plan to extend our sample with ALMA to higher luminosities in a forthcoming study. The main difference between the Swift/BAT and the NUGA+GATOS samples shown in Fig. 1 can be explained by the fact that the all-sky Swift/BAT survey is flux-limited (Baumgartner et al. 2013). These differences are exacerbated when the PDF of NUGA and Swift/BAT targets are compared, as NUGA preferentially selects nearby (D < 17 Mpc; Combes et al. 2019) low-luminosity AGN.
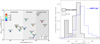 |
Fig. 1. Left panel: comparison of the distribution of intrinsic AGN luminosities measured in the 2–10 keV X-ray band (corrected for absorption) and the column densities, NH, derived from hard X-rays, as measured by Swift/BAT in the 14–150 keV band for the combined GATOS sample listed in Table 1 (star markers) (Ricci et al. 2017a). We also include the data of NGC 613 from the NUGA sample (Combes et al. 2019) (circle), which also has NGC 1365 as a target in common with GATOS. Symbols are color-coded to reflect the Eddington ratios estimated by Koss et al. (2017). Right panel: comparison of the probability density function (PDF) of AGN luminosities in the 2–10 keV band for the combined sample of GATOS and NUGA (gray-filled histogram) and the Swift/BAT sample of Ricci et al. (2017a) (blue histogram). We identify the distribution of NUGA targets by the hatched area. This figure illustrates the complementarity of NUGA and GATOS samples in covering a significant (∼4.5 dex) range of intrinsic AGN luminosities with the combined sample of 19 nearby Seyferts used in this work. |
Main properties of the sample used in this paper.
Appendix A provides a short description of some of the main properties derived from previous observations obtained at optical, near infrared, radio centimeter, and X-ray wavelengths for the galaxies of the GATOS core sample. In particular, we adopt the orientation (major axis) and extent (opening angle) of the ionized winds in the galaxies of the core sample derived from the references listed in Appendix A. Furthermore, the parameters of the ionized winds in the three additional GATOS targets listed in Table 1 are adopted from Das et al. (2006) for NGC 1068 (see also Barbosa et al. 2014; May & Steiner 2017; Mingozzi et al. 2019), Venturi et al. (2018) and Mingozzi et al. (2019) for NGC 1365, and Alonso-Herrero et al. (2019) for NGC 3227.
3. Observations
3.1. ALMA data
We observed the emission of the CO(3–2) and HCO+(4–3) lines and their underlying continuum emission in the CND of our targets with ALMA during Cycle 6 and 7 using band 7 receivers (project-IDs: #2017.1.00082.S and #2018.1.00113.S; PI: S. García-Burillo). The phase tracking centers of the galaxies were taken from the All Sky–2MASS survey (Skrutskie et al. 2006). We note however that the positions of the AGN in each galaxy have been determined in this work through a fit of the continuum emission, as detailed in Sect. 4. We used a single pointing with a field-of-view (FOV) of 17″. Observations were designed to cover the emission of molecular gas and dust inside the CND (r ≤ 600 − 1200 pc) of the ten selected Seyfert galaxies of the GATOS core sample using a common average angular resolution of ∼0.1″, which translates into a spatial scale ∼7 − 13 pc for the range of distances to our targets. We combined two sets of configurations of the ALMA array: extended (C43–6) and compact (C43–3). This mix of configurations assured that the largest angular scale recovered in our maps is about ∼4″ = 300 − 500 pc, enough to recover a sizeable fraction of the flux inside the FOV and virtually all the flux at scales that are mostly relevant to image both the dusty molecular tori and the connection to their hosts (r ∼ 200 pc). Observations typically required the execution of two tracks (one track per each configuration set) conducted between December 2017 and August 2019 and the use of ∼43 − 49 antennas of ALMA (see Table 2 for details).
Parameters of the ALMA observations.
Four spectral windows of 1.875 GHz-bandwidth were placed, two in the lower side band (LSB) and two in the upper sideband (USB). This setup allowed us to observe the CO(J = 3 − 2) line (345.796 GHz at rest) and the continuum emission (343.901–344.101 GHz at rest) in the LSB bands, as well as HCO+(J = 4 − 3) (356.734 GHz at rest) and the continuum emission (355.845–358.000 GHz at rest) in the USB bands. We calibrated the data making use of the ALMA reduction package CASA (McMullin et al. 2007)2. The calibrated uv-tables were exported to GILDAS3 to proceed with the continuum subtraction and imaging procedures as detailed below. We first subtracted the continuum from each of the spectral (u, v) data sets using the GILDAS task UV-BASELINE. We fit a baseline to the (u, v) data sets through a polynomial of degree zero masking the line emission around each transition with a range of velocity widths ∼300 − 600 km s−1 adapted for each target and subsequently obtained continuum-free spectral line images for CO(J = 3 − 2) and HCO+(J = 4 − 3). We derived images of the continuum emission by averaging in each of the two sub-bands centered around spectral lines those channels free of line emission using the GILDAS tasks UV-FILTER and UV-CONT, making use of the same velocity width masks employed by the UV-BASELINE task. The line-free continuum emission images were combined with the genuine continuum images obtained in the remaining bands to produce a noise-weighted average image of the continuum emission at an average frequency range = 350.570 − 351.133 GHz (at rest).
The flux accuracy is estimated to be about 10–15%, that is, in line with the goal of standard ALMA observations at these frequencies. We obtain for each galaxy two sets of angular resolutions by changing in the GILDAS task UV-MAP the robust parameter (b) from 1 (in the moderate spatial resolution data set, hereafter MSR) to 0.1 (in the high spatial resolution data set, hereafter HSR). The line data cubes were binned to a common frequency resolution of 11.7 MHz (equivalent to ∼10 km s−1 in band 7). The point source sensitivities in the line data cubes were derived selecting areas free from emission in all channels. We summarize in Table 2 the relevant parameters of the ALMA observations for the ten galaxies of the GATOS core sample. We also list the parameters of the ALMA observations of the three galaxies used to complete the sample used in this work (NGC 1068, NGC 3227, and NGC 1365). For these galaxies there are ALMA data published by García-Burillo et al. (2019) (NGC 1068), Alonso-Herrero et al. (2019) (NGC 3227), and Combes et al. (2019) (NGC 1365), which have spatial resolutions and sensitivity requirements comparable to those of the GATOS core sample.
3.2. Ancillary data
3.2.1. Archival HST images
We downloaded fully reduced optical images from the Hubble Legacy Archive (HLA)4 taken with the WFPC2/PC instrument on board the Hubble Space Telescope (HST) using the broad-band filter F606W, except for NGC 1068, for which we use the narrower filter F547M. For the galaxy NGC 7314 we also retrieved an image in the broad-band filter F450W. The HLA WFPC2 images are drizzled to a pixel size of 0.05″ using the MultiDrizzle software. In order to construct V − H color images of the targets, we downloaded either NICMOS or WFC3 near-infrared images in the broad-band filter F160W, except for the galaxy NGC 7314, for which no near-infrared HST images are available and the two optical filters mentioned above were used instead. Details of the optical and near-infrared observations are shown in Table B.1. The HLA NICMOS and WFC3 images are drizzled to pixel sizes of 0.05″ and 0.09″ respectively, whereas those downloaded from the Mikulski Archive for Space Telescopes (MAST) Portal5, which were processed with either the CALNIC or CALWF3 pipelines, have pixel sizes of 0.075″ and 0.128″ respectively. We corrected the astrometry of the images using the position of reference stars in the field from Gaia data release 2 (Gaia DR2; Gaia Collaboration 2018). Corrections typically ranged from  to
to  .
.
3.2.2. X-ray observations: NuSTAR
The Nuclear Spectroscopic Telescope Array (NuSTAR) is the first focusing hard X-ray telescope with high sensitivity6. This gives the advantage to observe with a single mode from 3 to 79 keV, perfectly suited to study the AGN reflection component. Therefore, we used the hard band spectrum observed with NuSTAR (Harrison et al. 2013), including both FPMA and FPMB focal plane modules. We looked for NuSTAR observations for our sample using the High Energy Astrophysics Archive Research Center (HEASARC) archive7, finding observations for 11 AGN of our sample. We chose the longest exposure if several observations were available.
NuSTAR data reduction was done using the data analysis software NuSTARDAS (v.1.4.4) distributed by HEASARC. The calibrated, cleaned, and screened event files were generated using the NUPIPELINE task. A circular region of 1 arcmin radius was taken to extract the source and background spectrum on the same detector and to compute the response files (RMF and ARF files) using the NUPRODUCTS package within NuSTARDAS. Finally, we used the GRPPHA task to group the spectra with at least 60 counts per bin. We used the NuSTAR data in the range 3–70 keV.
4. Continuum maps
4.1. Morphology of the emission
Figures 2–4 show the continuum maps derived at the (rest) frequency ∼351 GHz (870 μm) in the central Δα × Δδ = 1″ × 1″ regions of the GATOS core sample galaxies. The maps were obtained from the ALMA MSR datasets. A feature common to all the images is the presence of disk-like morphologies where we identify by eye two main components: (1) a bright unresolved point source and (2) a spatially-resolved extended component characterized by lower surface brightness emission. A visual inspection of Figs. 2–4 indicates that there is a large variance in the contributions of point sources and extended components to the total flux in the galaxies of our sample8. The extended components adopt different elongated morphologies, which appear to be oriented mostly perpendicular relative to the AGN wind axes in the majority of our sources (see discussion in Sect. 4.5).
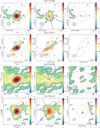 |
Fig. 2. Left panels: continuum emission at the (rest) frequency range 350.6–351.1 GHz (Icont) in the central Δα × Δδ = 1″ × 1″ regions of NGC 4388, NGC 4941, NGC 5506, and NGC 5643, obtained from the ALMA MSR datasets. The AGN positions, identified by the blue star markers, correspond to the location of the point sources determined by the two-component fit to the continuum emission described in Sect. 4. The continuum maps are shown in color scale and (black) contour levels with a logarithmic spacing from −2.5σcont(dashed blue), 2.5σcont to 90% of the peak intensity ( |


We expect that the contribution of thermal dust emission at (rest-frame) frequencies ∼351 GHz, which falls on the Rayleigh-Jeans portion of the submillimeter spectral energy distribution, dominates in normal star-forming and starburst galaxies. The submillimeter flux has been instrumental in deriving the total gas mass in different galaxy populations (e.g., Siebenmorgen & Krügel 2007; Draine et al. 2007; Galametz et al. 2011; Scoville et al. 2014, 2016). Continuum emission in this frequency range can be due the presence of dusty compact disks (‘tori’) located around the central engines. This emission has been seen to extend over scales of tens of parsecs in AGN (Combes et al. 2019; García-Burillo et al. 2019; Alonso-Herrero et al. 2019). Alternatively, dust emission may also arise from components oriented in the polar direction. Polar dust emission can extend over scales of tens or hundreds of parsecs.
ALMA high-resolution images of the submillimeter continuum in the circumnuclear disks of Seyfert galaxies, similar to the GATOS sample galaxies shown in Figs. 2–4, have nevertheless shown that this emission can also arise from various physical mechanisms not necessarily related to dust. A significant fraction of the submillimeter continuum can also be attributed to nonthermal synchrotron emission or to thermal free-free emission of the ionized plasma. The former originates either from small radio-jets or from compact subparsec-scale AGN cores. While these components are generally detected at cm wavelengths in radio-quiet AGN (Nagar et al. 1999; Mundell et al. 2000; Ulvestad & Ho 2001; Orienti & Prieto 2010), they can also contribute to the submillimeter flux at scales that would be unresolved by ALMA (García-Burillo et al. 2014, 2019; Alonso-Herrero et al. 2019; Combes et al. 2019; Pasetto et al. 2019; Rosario et al. 2019).
NGC 1068 is a well-studied case that illustrates the need for high-resolution observations to disentangle this complexity. García-Burillo et al. (2019) used the information available from cm and mm-wavelengths (e.g., Hönig et al. 2008; Krips et al. 2011, and references therein) and estimated that the fraction of the 870 μm-emission that can be attributed to dust at the location of the AGN source of NGC 1068 is ≤10% (knot S1, according to the nomenclature used by Gallimore et al. 1996). Most of the submillimeter flux in the S1 knot arises from free-free emission of the ionized plasma at scales ≤1 pc. However, after excluding the circumnuclear disk regions close to the radio-jet trail and the S1 knot (imaged by Gallimore et al. 1996, 2004), García-Burillo et al. (2019) concluded that the bulk of the submillimeter continuum can be attributed to dust emission.
4.2. Decomposition of continuum emission: point sources and extended components
In this section we make a morphology-wise decomposition of the submillimeter (870 μm) continuum images of the GATOS sample galaxies, as a first step to gauge the geometry (extent, orientation) and mass content of dusty disks (‘tori’) and their connections. This type of decomposition, made possible thanks to the high spatial resolution and high-sensitivity capabilities of ALMA, is instrumental in minimizing the contribution of sources unrelated to dust emission (see also discussion in Pasetto et al. 2019). With this aim, we fit the continuum images of the MSR and HSR datasets using a combination of point-like and 2D elliptical Gaussian sources in order to quantify the contribution of each family of components. The precise knowledge of the ALMA beams allows for an accurate estimate of the contribution of the unresolved components. In particular, the uncertainties on the sizes and orientations of the ALMA beams, which are derived from Gaussian fits to the main lobes are typically  and ≃1° −3°, respectively. The fit is performed in the plane of the sky to take advantage of the high-fidelity of the images obtained by ALMA. We also applied the same procedure to determine new fits to the data of NGC 1365 (Combes et al. 2019) and NGC 3227 (Alonso-Herrero et al. 2019). In the case of NGC 1068 we used the torus parameters derived by García-Burillo et al. (2016) from the ALMA continuum images at 440 μm. We added these three sources to the GATOS core sample for the ensuing analysis.
We determined the best-fit solution for each galaxy using a three-step scheme designed, first, to minimize any potential contribution of synchrotron or free-free emission to the flux of the extended component while at the same time avoiding an unphysical over-subtraction of the unresolved component. In a first step (step-1) we estimated the intensity of the unresolved component (Ipoint) using a pair of 1D-Gaussians accounting for the fluxes of the unresolved and the extended components across two orthogonal strips chosen to intersect the emission peak along PA = 0° and 90°. We fixed the sizes of the point sources for each target by projecting the ALMA beams along the corresponding strips. In a second step (step-2) we freely fit both the position and the intensity of the point source in 2D space using the average obtained for Ipoint along both strips in step-1 as the initial value. In a third step we freely fit a 2D elliptical Gaussian (of intensity IGauss) to the residual obtained after subtraction of the point source estimated in step-2. We evaluated the goodness of the final fits by an inspection of the residuals, shown in Figs. 2–4. The two-component model is a good representation of the emission in all the galaxies except in NGC 7213, where the residuals are seen to be exceedingly large (≥10σ). This scheme is similar to the Point Spread Function (PSF) scaling technique used to separate the unresolved and extended emissions in ground-based mid-IR images of Seyfert galaxies, also adopted in the analysis of AH21.
Table 3 lists the main parameters obtained in the fitting procedure described above. The coordinates derived from the MSR and HSR datasets for the point sources agree within  . We hereafter assume that these positions likely correspond to the AGN loci in our targets. Furthermore, the centroids derived for the extended components also coincide within
  with the assumed AGN coordinates. This coincidence suggests that the extended components have a strong physical link to the central engines. The equivalent full-sizes of the extended components, defined as the sizes of the disks measured at a ∼3σ intensity level of the Gaussians used in the fits, range from ∼25 pc to ∼130 pc with a median value of ∼42 pc (or an equivalent radius of ∼21 pc). The latter is within the range of sizes estimated for the dusty molecular tori that have been imaged by ALMA in other Seyfert galaxies (García-Burillo et al. 2016, 2019; Gallimore et al. 2016; Imanishi et al. 2018, 2020; Alonso-Herrero et al. 2018, 2019; Combes et al. 2019; Impellizzeri et al. 2019; Audibert et al. 2019). Furthermore, these sizes are also similar to those derived for the compact gas disks imaged in the 1–0 S(1) line of H2 in a sample of nearby Seyferts (D ∼ 60 pc; Hicks et al. 2009).
Parameters of the point and extended sources fitted to the continuum emission of the MSR and HSR datasets.
Figure 5 compares the distribution of deconvolved sizes (diameters) for the dusty molecular tori (or polar components) derived from the combined sample of NUGA and GATOS. Although the GATOS sources seem to populate the tail showing the largest sizes, both samples are characterized by an identical median value of ∼42 pc.
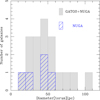 |
Fig. 5. Histograms showing the distribution of the deconvolved diameters of the dusty molecular tori (or polar components) derived from the combined sample of NUGA and GATOS (gray-filled histograms). We adopt for GATOS the average sizes estimated from the MSR and HSR datasets. The blue-filled histogram identifies the distribution of sizes of the tori derived for NUGA galaxies (Combes et al. 2019). |
4.3. Spectral index maps
We describe in this section the use of spectral index maps to characterize the nature of submillimeter continuum emission in our Seyfert galaxies. Following a methodology similar to the one applied by García-Burillo et al. (2019) in their analysis of the continuum emission of NGC 1068, we used the 230 GHz-continuum images of NGC 7582, NGC 5643, and NGC 3227, published by Alonso-Herrero et al. (2018, 2019, 2020) in combination with our 351 GHz continuum images, to derive the maps of the spectral index α (where α is defined such as Sν ∝ να). For these sources we have comparable high-resolution ALMA images at both frequencies. We convolved all the images employed in this analysis to obtain a common range of spatial resolutions  –
– (11–18 pc). The result is shown in Fig. 6.
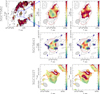 |
Fig. 6. Top row: overlay of the ALMA 351 GHz continuum map of the central Δα × Δδ = 4″ × 4″ region of NGC 7582 (contours) on the spectral index map of the galaxy (α, with Sν ∝ να; in color) obtained from the images taken at ν = 230 GHz (Alonso-Herrero et al. 2020) and 351 GHz (this work) (left panel). We zoom in on the central Δα × Δδ = 1″ × 1″ region of NGC 7582 in middle panel and display the overlay after subtraction of the point-source in right panel. Middle row: same as top row but zooming in on the central Δα × Δδ = 1″ × 1″ region of NGC 5643; spectral index map obtained from the images taken at ν = 230 GHz (Alonso-Herrero et al. 2018) and 351 GHz (this work). Bottom row: same as middle row but for NGC 3227; spectral index map obtained from the images taken at ν = 230 GHz (Alonso-Herrero et al. 2019) and 351 GHz (this work). The common apertures (gray ellipses) adopted to derive the spectral index maps are: |


NGC 7582 is the only target of the GATOS core sample where we detected strong continuum emission from a  (170 pc)–starburst ring located well outside the central r ∼ 50 pc of the galaxy. The value derived for α throughout the starburst ring, ≥2 − 3, can be accounted for by dust thermal emission. A zoom onto the inner
  (55 pc) of the galaxy shows that continuum emission detected in the compact disk feature exhibits significantly lower α values at the AGN locus: ∼0 − 1. However, we detect a gradient showing higher values of α (∼1.5–3) at larger radii, which suggests that dust emission starts to dominate the submillimeter flux budget farther out in the extended component. We identify a similar trend in NGC 5643 and NGC 3227: low values of the spectral index at the AGN position, α ∼ 0–1, in contrast to significantly higher values of α (∼1.5–3) farther out over a sizeable fraction of the extended component. Alonso-Herrero et al. (2019) used a slightly lower resolution version of the 230 GHz-continuum maps of NGC 3227 and found an equivalent trend for the spectral index of the submillimeter continuum emission.
The trends identified in the spectral index maps of Fig. 6 confirm that in AGN that are not radio-silent, such as the GATOS sample galaxies, other mechanisms different from thermal dust emission can contribute to a large extent to the ∼850 − 870 μm continuum flux. In particular, this contribution can be significant mostly close to the central engine on spatial scales (∼1 pc) that remain unresolved by ALMA. Apart from NGC 1068 and the three galaxies of Fig. 6, 230 GHz continuum images with a spatial resolution  comparable to that of our 351 GHz maps are not available for any of the remaining sources in our sample. Therefore, meaningful spectral index maps cannot be obtained for the rest of the GATOS galaxies.
Figure 6 shows also a new version of the spectral index maps of the submillimeter continuum emission in NGC 7582, NGC 5643, and NGC 3227 obtained after subtraction of the point sources found in the fitting scheme described in Sect. 4.2 and applied to the 351 GHz and 230 GHz continuum images. High values of the spectral index ∼1.5 − 3 are now found more systematically throughout the extended components in our sources, an indication that the continuum emission comes primarily from dust in these regions. In particular, the distribution of α values in the ‘corrected’ maps does not show any marked depression close to the AGN. On the other hand, the spectral indices derived from the subtracted point sources are either flat (∼0.1 [NGC 7582]; ∼0.3 [NGC 5643]) or steep (∼ − 1.4 [NGC 3227]), a result that seems to confirm that the unresolved components are likely associated with free-free or a combination of dust and synchrotron emission.
4.4. Masses of the extended components
Continuum emission in the extended components is associated with CO(3–2) emission in the majority of our sources, and in some galaxies with dense molecular gas traced by HCO+(4–3) emission, as shall be discussed in detail in Sects. 5.2 and 6. In this section we further test our hypothesis that the bulk of the continuum emission of the extended components can be attributed to dust by comparing the H2 mass derived from the 351 GHz continuum and the CO(3–2) line emission, as described below.
We assumed a dust temperature Tdust ∼ Tgas = 100 K and a dust emissivity κ351 GHz = 0.0865 m2 kg−1 (Klaas et al. 2001) to derive dust masses using the values of IGauss listed in Table 3 and a modified black-body function. In the absence of estimates for each galaxy, we were constrained to adopt a common Tdust for all sources similar to the one used by García-Burillo et al. (2014) and Viti et al. (2014) to fit the CO line excitation and the continuum SED of the dusty molecular torus of NGC 1068. Furthermore, we assumed a canonical (neutral) gas–to–dust ratio ∼100, which is typical of the solar metallicity environment of the central regions of spiral galaxies (e.g., De Vis et al. 2019). The molecular gas mass derived for the extended components are listed as  in Table 4.
Sizes, masses, and orientations of the extended components of continuum emission.
Moreover, we obtained an independent estimate of the molecular gas mass associated with the extended components by integrating the CO(3–2) line emission inside the areas defined by the full-sizes of the best-fit Gaussian disks derived in Sect. 4.2. In our estimate we adopted a 3–2/1–0 brightness temperature ratio ∼2.9, which is similar to the overall ratio measured by García-Burillo et al. (2014) and Viti et al. (2014) in the NGC 1068 torus. We purposely used NGC 1068 as template for the sake of consistency with the assumptions made in the dust-based estimate of Mgas. Second, we assumed a galactic CO–to–H2 conversion factor (XCO = 2 × 10²⁰ mol cm−2 (K km s−1)−1). The CO-based molecular gas masses derived from Eq. (3) of Bolatto et al. (2013), after including the mass of Helium, are listed as  in Table 4. The molecular gas masses derived for the extended components in GATOS sources encompass a wide range ≃5 × 10⁴ − 1 × 10⁷ M⊙, with a median value of ∼6 × 10⁵ M⊙.
Figure 7 (upper panel) shows also the gas masses of the molecular tori in NUGA sources, derived using the same conversion factors. The masses of NUGA tori are among the highest in the combined sample: ≃2 × 10⁶ − 1 × 10⁷ M⊙. Based on the similar median values of the molecular tori size distributions of NUGA and GATOS sources derived in Sect. 4.2, the comparatively higher gas masses of NUGA tori point to correspondingly higher gas surface densities (see discussion in Sect. 8.2).
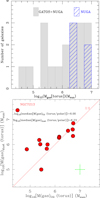 |
Fig. 7. Upper panel: histograms showing the distribution of the masses of the dusty molecular tori (or polar components) derived from the combined sample of NUGA and GATOS (gray-filled histograms). We adopt for GATOS the average masses estimated from the MSR and HSR datasets. The blue-filled histogram identifies the distribution of masses of the tori derived for NUGA galaxies (Combes et al. 2019). Lower panel: comparison of the molecular gas mass derived from the CO(3–2) integrated emission and from the dust emission inside the torus (or polar) features detected by ALMA in the galaxies listed in Table 3; for this comparison the HSR dataset is used. The torus (or polar) regions are identified by the elliptical Gaussians fit to the extended components of the continuum emission shown in Figs. 2–4, as described in Sect. 4.2. The median values of the distributions exclude NGC 7213, highlighted as an outlier. A comparison with the MSR dataset yields virtually identical results. Errorbars at the lower right corner account for an uncertainty of ±0.2 dex due to the assumed conversion factors. |
Figure 7 (lower panel) compares the values obtained for  and
and  in our sample derived from the HSR dataset. Leaving aside NGC 7213 the two distributions are in reasonable agreement: their median values differ only by ∼0.23 dex (∼0.16 dex if the MSR dataset is used instead), an indication that the bulk of the continuum emission of the extended components stems from dust. In particular, after excluding NGC 7213,
  and
and  show Pearson correlation parameters ∼ + 0.74 and two-sided p values ∼6 × 10⁻³ for both datasets. This result is to some extent expected since the extended components contain most of the continuum emission in eight of the twelve sample galaxies. Although the flux ratios between the extended components and the point sources show a wide range in our sample (IGauss/Ipoint ∼ 0.5 − 55), their median value, ∼6, is high. The point source contribution is relevant only in NGC 4388, NGC 5506, NGC 6814, and NGC 7213, where IGauss/Ipoint ratios ≤1. For these sources the underlying assumptions behind the subtraction scheme described in Sect. 4.2 may compromise the H2 mass estimates for the extended components on several counts. NGC 7213 actually appears as an extreme outlier in Fig. 7 (lower panel). In NGC 7213,
  . A less dramatic mismatch is found in NGC 6814 where
  . The extended component seems to include a significant contribution of either free-free or synchrotron emission of ionized gas in NGC 7213, and possibly also in NGC 6814. Alternatively, the assumption of a 3–2/1–0 ratio similar to that of NGC 1068 may underestimate the H2 mass derived from CO(3–2) if diffuse molecular gas makes a significant contribution in sources like NGC 7213 and NGC 6814.
In summary, we can conclude that the continuum emission of the extended components can be attributed in all likelihood to dust in all our sources with the exception of NGC 7213, and, to a lesser extent, NGC 6814, which represent more doubtful cases.
4.5. Orientation of the extended components: equatorial (torus-like) or polar
The elevation angle of an outflow from the torus midplane (θ) is a key geometrical parameter in the characterization of launching mechanisms. Its closest observational analog is the relative angle between the torus major axis and the outflow axis measured on the sky plane (Δ). However, there is no one-to-one relation between these angles. Projection effects imply that besides θ, Δ also depends on two additional parameters: the inclination of the torus (itorus) and the azimuth of the outflow measured in the torus midplane (Φ). Although we lack sufficient constraints on the three-dimensional geometry of our targets, the distributions of measured Δ values still encode some important information on the alignment between AGN tori and outflows detected either in ionized or molecular gas.
We analyzed the orientations of the extended components projected on the plane of the sky, defined by PAGauss, relative to those of the ionized outflows, defined by PAout. Figure 8 shows the distribution of Δ values, defined as Δ≡ min[|PAGauss − PAout|, 180° −|PAGauss − PAout|], derived from the MSR and HSR datasets (listed in Table 4). Within the limits imposed by the sparse statistics, we see that Δ values do not appear to be uniformly distributed within the range 0° −90°, especially when the HSR datasets are considered.
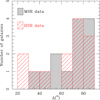 |
Fig. 8. Histograms showing the distribution of the projected relative orientation angles between the extended components of continuum emission and the ionized outflow axes, defined as Δ≡ min[|PAGauss − PAout|, 180° −|PAGauss − PAout|] derived from the MSR and HSR ALMA datasets of GATOS. |
A group of 9 galaxies show values of Δ ∼ 60 − 90°, suggestive of an orientation perpendicular to the outflow axes for the extended component, as expected for a torus geometry for the dust. In contrast, a smaller subset of 4 galaxies display lower values of Δ ∼ 20 − 60°; these lower values would be indicative of polar-like (Δ ≤ 30°) or mixed geometry (30° < Δ < 60°) for the dust in these sources. In particular, in galaxies like NGC 3227 we cannot exclude the existence of cases with mixed geometry where dust emission is detected in the torus and in the polar components.
It can be shown that, if outflows were randomly oriented in space with respect to tori, the probability distribution of Δ would be uniform from 0° to 90°. This holds true even for arbitrary values of itorus, and so it is robust against potential selection biases in the orientation of putative tori relative to the line of sight. Using standard statistical tools, like Kolmogorov-Smirnov (KS) and Anderson-Darling (AD) tests, we quantify below the likeliness that the Δ values measured for the extended components are drawn from a uniform distribution. We can therefore assess the null hypothesis of random three-dimensional alignment between outflows and the extended components.
In Fig. 9 we compare the uniform cumulative distribution function (CDF) of Δ values in the 0°–90° range with those of our MSR and HSR datasets. A visual inspection suggests that the measured values are relatively skewed toward the upper end. In particular, there is a clear dearth of measurements below ∼25°. Table 5 summarizes the results of KS and AD tests applied to the MSR and HSR samples. The low p values of the two two-sided tests, in particular those for the MSR sample, imply that the agreement with a uniform distribution from 0° to 90° can be rejected at a very high significance. The one-side KS tests allow us to identify the sign of this disagreement. For the “less” KS tests, p values are only ∼0.1 − 1%, thus rejecting their null hypothesis at a higher significance than before. The implication is that the sample CDFs very likely lie below that of the uniform distribution. In this regard, the tests just substantiate the behavior apparent in Fig. 9. As expected, for the “greater” KS tests, however, p values are close to unity, so the plausibility of their null hypothesis remains undecided.
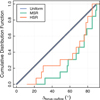 |
Fig. 9. Comparison of the uniform cumulative distribution function (CDF) of Δ values in the 0°–90° range (blue) with those derived from our MSR (green) and HSR (reddish) datasets. |
In short, we can draw two main conclusions from our statistical tests. In the first place, our data support the idea that the extended components detected in dust continuum emission in our sources have a preferential orientation relative to the AGN outflows. In the second place, the sense of this preference is that outflows and extended components are more likely to appear (close to) perpendicular than parallel on the plane of the sky relative to the AGN outflows, as expected for a torus-like equatorial geometry. Hereafter we therefore use the term “dusty molecular tori” to refer to the compact disks detected in dust continuum and molecular line emission around the central engines in our targets. For the reasons mentioned above, this does not necessarily imply that tori and outflows are strictly perpendicular in the three-dimensional space.
5. Molecular line emission
5.1. The ∼kiloparsec scale region
Figure 10 shows the velocity-integrated intensity maps of the 3–2 line of CO (ICO) obtained in the GATOS core sample galaxies. The maps were derived using a 3σ clipping on the emission extracted from the MSR dataset and corrected for primary beam attenuation. The ALMA FOV images the inner regions of the galaxy disks up to r≤0.6–1.2 kpc for the range of distances to our sources (the median value of the sample is ∼0.9 kpc).
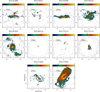 |
Fig. 10. Primary-beam corrected velocity-integrated intensity maps of the 3–2 line of CO (ICO) inside the 17″ ALMA field-of-view (FOV; represented by the gray circle) for the galaxies of the core sample of GATOS. Maps were derived using a 3σ clipping. Intensities are expressed in Jy km s−1-units using a logarithmic (color) scale. (Δα, Δδ)-offsets are relative to the phase tracking centers used during the observations, listed in Table 1. Filled-ellipses at the bottom left corners identify the sizes of the ALMA beams. |
We integrated ICO inside the region covered by the ALMA FOV to derive the corresponding H2 masses for the galaxies shown in Fig. 10. To this end we assumed a 3–2/1–0 brightness temperature ratio ∼0.7. This value lies in the range of the mean ratios measured in the central kpc-region of NGC 1068 and in other nearby normal and starburst galaxies on comparable spatial scales: ∼0.6–1.0 (Devereux et al. 1994; Mauersberger et al. 1999; Mao et al. 2010; García-Burillo et al. 2014; Viti et al. 2014). As in Sect. 4.2 we also adopted a Milky-Way CO–to–H2 conversion factor (XCO = 2 × 10²⁰mol cm−2 (K km s−1)−1). The derived molecular gas masses, after including the mass of Helium span nearly three orders of magnitude, from 6.2 × 10⁶ M⊙ to 2.9 × 10⁹ M⊙.
Figure 10 shows a wide range of morphologies in the distribution of molecular gas in the central r ≤ 0.6–1.2 kpc-regions of the core sample of GATOS. On the global ∼kiloparsec scales displayed in Fig. 10 we identify two-arm spiral structures connected to rings or compact disks. These morphologies can be explained in the framework of the expected gas response to the stellar bar potentials, which are present in some galaxies as described in Appendix A (NGC 5643, NGC 6300, NGC 7314, NGC 7465, and NGC 7582). In other sources molecular gas displays a twin peak morphology at the center, which is connected to a weak two-arm spiral pattern in NGC 6814 or to a filamentary multiple-arm structure in NGC 4941. Molecular gas in NGC 7213 shows an asymmetric two-arm spiral feature with a conspicuous hole at the center. Although the in-plane distribution of molecular gas in NGC 4388 and NGC 5506 is more difficult to discern due to their high inclinations, we nevertheless identify in NGC 4388 a ring-like morphology in molecular gas. Moreover, the vertical distribution of molecular gas shows a network of gas filaments coming out of the plane in NGC 4388. In particular, there is a conspicuous 3″ (270 pc)-long gas lane located northwest above the galaxy plane. The radial distribution of molecular gas in NGC 5506 also shows hints of a ring-like morphology and evidence of an asymmetric warped extension of molecular gas at the eastern edge of the disk at r > 5″ (800 pc). We refer to Sect. 5.2 for a detailed description of the distribution of molecular gas and its relation to continuum emission on two spatial scales: r ≤ 200 pc and r ≤ 50 pc, hereafter identified as the CND and the torus regions, respectively.
Figure 11 explores the dependence of Mgas[FOV] measured in the GATOS and NUGA sample galaxies on their intrinsic AGN luminosities, measured in the 2–10 keV band (LAGN(2–10 keV)) or on the Eddington ratios. We derived the molecular gas masses corresponding to the central r ≤ 0.4–0.8 kpc regions of the NUGA galaxies published by Combes et al. (2019) using the conversion factors applied to the GATOS Seyferts, described in Sect. 5.1. As shown by Fig. 11 there is no significant correlation between Mgas[FOV] and LAGN(2–10 keV) or with the Eddington ratios. This result seems to contradict the predictions of the theoretical models and numerical simulations of Kawakatu et al. (2005), who anticipated that X-ray and CO luminosities should be correlated in the central kpc-scale regions of active galaxies.
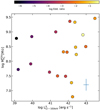 |
Fig. 11. Molecular gas mass detected inside the 17″-FOV of the ALMA CO(3–2) images of the GATOS and NUGA galaxies as a function of the intrinsic AGN luminosities measured in the 2–10 keV band for the galaxies of our combined sample. The regions mapped by ALMA span the central r ≤ 0.4 − 1.2 kpc. Symbols are color-coded as a function of the Eddington ratio of the sample galaxies. Errorbars account for the range of uncertainties on the molecular gas mass estimates, due to the assumed CO-to-H2 and 3–2/1–0 conversion factors (∼±0.2 dex), and on the AGN luminosities (∼±0.15 dex). |
The lack of correlation illustrated by Fig. 11 can be explained taking into account the very different spatial scales and timescales involved in the last steps of the AGN fueling process on the one hand (∼1–to–a few 10 pc), and in the build-up of kpc-scale reservoirs of molecular gas on the other hand. AGN variability, which reflects the episodic and chaotic nature of the BH feeding process, would naturally tend to wash out any correlation between the kpc-scale molecular gas content and LAGN for small galaxy samples like ours. A similar argument can be used to anticipate the lack of correlation of Mgas[FOV] with the Eddington ratio. In agreement with our findings, Rosario et al. (2018) found no correlation between the kpc-scale molecular gas content and the power of the AGN measured by X-ray luminosities using a sample of 26 nearby AGN. Similarly, Izumi et al. (2016a) found a weak correlation between the dense molecular gas content probed by the HCN(1–0) luminosities measured on ≥ kpc scales and the black hole accretion rates in a sample of 32 AGN.
After the pioneering work of Yamada (1994), the use of larger samples have nevertheless led other groups to find evidence of different degrees of correlation between the (soft and hard) X-ray and the total CO luminosities (Monje et al. 2011; Koss et al. 2021). Of particular note, the spatial scales probed in these surveys, ∼5–25 kpc, are significantly larger than the 1 kpc-scale regions probed in our sample. Moreover, while distances span a factor of 2 in the sample used in our work, they span a factor 5–30 in the surveys of Monje et al. (2011) and Koss et al. (2021). Therefore, we cannot exclude that the correlation found by Monje et al. (2011) and Koss et al. (2021) is partly driven by a luminosity distance bias (×D2), which affects the two axes of their explored parameter space.
5.2. The circumnuclear disk (CND) and tori scales: r ≤ 200 pc and r ≤ 50 pc
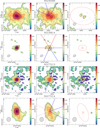
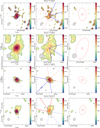
In this section we compare the CO(3–2) and continuum emissions obtained by ALMA in the ten galaxies of the GATOS core sample with the morphology of the HST V − H images on two spatial scales, which are characteristic of the CND (r ≤ 200 pc) and the dusty molecular tori (r ≤ 50 pc) regions in our sources.
Figure 12 compares the ICO emission derived by ALMA in the central Δx × Δy = 400 pc × 400 pc regions of the GATOS core sample galaxies with their HST V − H color images. V and H band images were obtained with the F606W (V) and F160W (H) filters of HST9. ALMA images were derived from the MSR datasets. We also include the CO and V − H images of NGC 1068 (García-Burillo et al. 2019) and NGC 3227 (Alonso-Herrero et al. 2019). Figure 13 zooms in on the inner Δx × Δy = 100 pc × 100 pc regions of the core sample of GATOS galaxies to show the overlay of the 351 GHz continuum emission on the ICO maps. We also include the images of NGC 1365 (Combes et al. 2019) and NGC 3227 (Alonso-Herrero et al. 2019). In both figures we used as reference the AGN positions determined from the fit to the continuum point sources derived in Sect. 4.2. We make below a detailed case-by-case description of this comparison.
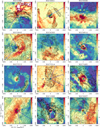 |
Fig. 12. Velocity-integrated CO(3–2) emission images (ICO; contours), obtained from the ALMA MSR datasets, are overlaid on the V − H color maps (shown in color scale), derived from the images obtained by HST with the F606W (V) and F160W (H) filters, in the central Δx × Δy = 400 pc × 400 pc regions of the galaxies of the core sample of GATOS. For NGC 7314 we used data of the F450W filter to replace the unavailable F160W. We also include the CO and V − H images of NGC 1068 (García-Burillo et al. 2019) and NGC 3227 (Alonso-Herrero et al. 2019). Contour levels have a logarithmic spacing from 3σco to 90% of the peak CO intensity inside the displayed field-of-view ( |

5.2.1. NGC 4388
Despite its high inclination (i = 79°, as determined in Appendix D), an elongated ringed disk of ∼100 pc deprojected radius can be discerned in the inner distribution of molecular gas traced by CO(3–2) in this Seyfert 1.9, as can be better visualized in the zoomed view of Fig. 13. The ring is centered around the AGN continuum source and it is likely associated with the gas response at the Inner Lindblad Resonance (ILR) of the stellar bar identified by Veilleux et al. (1999a). The ring shows a clumpy morphology, with conspicuous minima located northeast and southwest of the AGN along PA ∼ 15 − 20°, that is, close to the projected orientation of the ionized wind and radio jet (Falcke et al. 1998; Schmitt et al. 2003). Although a distinct torus feature cannot be identified, the region inside the CO ring is nevertheless not entirely emptied of molecular gas: yet at lower level, CO emission is detected both at and around the AGN up to r ∼ 100 pc. The CO flux measured at the AGN position translates into a molecular gas mass Mgas[r ≤ 5 − 6 pc] ∼(5.0 − 6.8)×104 M⊙ and a corresponding column density10N(H2)∼(2.1 − 2.3)×1022 cm−2.
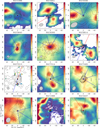 |
Fig. 13. Overlay of the continuum emission, at the (rest) frequency range 350.6–351.1 GHz (Icont; contours), on the velocity-integrated CO(3–2) maps (ICO; color scale) in the central Δx × Δy = 100 pc × 100 pc regions of the core sample of GATOS galaxies. We also include the CO and continuum images of NGC 1068 (García-Burillo et al. 2019) and NGC 3227 (Alonso-Herrero et al. 2019). In NGC 1068 we use the 694 GHz continuum map of García-Burillo et al. (2016) to better identify the dusty torus. The continuum maps are shown using (black) contour levels with a logarithmic spacing from 3σcont to 90% of the peak intensity in steps of ∼0.16 dex on average. The CO(3–2) maps are displayed in (linear) color scale spanning the range [3σCO, |

The extended component of the 351 GHz continuum shows a mixed geometry (i.e., intermediate between equatorial and polar) with an undefined angle (PAGauss = [ − 7° , − 43°]; Table 4) relative to the orientation of the outflow (PAout ∼ 10° −20°). As mentioned in Sect. 5.1, the vertical distribution of molecular gas shows a network of lanes and filaments detected above and below the plane of the galaxy. In particular, emission from the inner section of a 3″ (270 pc)-long gas lane located northwest is detected ≥150 pc above the galaxy midplane. The V − H map shows red (blue) colors on the northern (southern) side of the galaxy, which indicates that the northern (southern) side corresponds to the near (far) side. This also explains why the northeast side of the ionization cone detected in the optical is mostly obscured by the host galaxy (Schmitt et al. 2003). The V − H map shows red colors at the AGN position, in agreement with the Seyfert 1.9 classification of the galaxy. Subarcsecond resolution millimeter NOEMA observations of the CO(2–1) transition were recently presented by Domínguez-Fernández et al. (2020). Although at a lower resolution than the ALMA data in this work, the CO(2–1) integrated emission also shows a marked ring-like morphology.
5.2.2. NGC 4941
Molecular gas in this Seyfert 2 shows a twin-peak morphology inside r < 50 pc, with a deficit of molecular gas at the AGN. CO(3–2) emission is nevertheless detected at the AGN, which implies a molecular gas mass Mgas[r ≤ 5 − 7 pc] ∼(1.9 − 3.3)×104 M⊙ and a corresponding column density N(H2)∼(7.8 − 8.1)×1021 cm−2. The two CO peaks show a conspicuous butterfly shape and appear located symmetrically around the AGN along PA ∼ 40°. Despite its Seyfert 2 classification, the CO peaks surround a region characterized by blue V − H colors. This region extends ±30 pc on both sides of the AGN in a direction roughly perpendicular to the CO peaks: PA ∼ −60°. The orientation of this blue color feature lies in the range of values derived for the ionized outflow (PAout ∼ −40° to −60°; Barbosa et al. 2009) and the radio jet (PA ∼ −25°; Thean et al. 2000; Schmitt et al. 2001). Moreover, the orientation of the radio jet is similar to the orientation of the extended component of the 351 GHz continuum emission detected by ALMA (PAGauss ∼ −28°; Table 4). This is a borderline case between a mixed and a polar geometry, an indication that synchrotron emission could be contributing to the 351 GHz continuum. Furthermore, the CO peaks are connected at larger radii to an asymmetric two-arm molecular spiral structure detected in the V − H color map.
5.2.3. NGC 5506
The distribution of molecular gas in this highly-inclined Seyfert 1.9 galaxy (i = 80°; Appendix D) shows a ring-like morphology with CO(3–2) maxima located at a radial distance r ∼ 50 pc. Like in other GATOS sources, CO does not peak at the AGN source, which is nevertheless characterized by spatially-resolved 351 GHz continuum emission with an equatorial (torus-like) geometry. There is however CO emission detected at the AGN, which implies a molecular gas mass Mgas[r ≤ 9 − 11 pc] ∼ (3.2 − 3.7)×105 M⊙ and a column density N(H2)∼(4.0 − 4.6)×1022 cm−2. Furthermore, it is one of three GATOS sources where we detected significant HCO+(4–3) emission stemming from very dense molecular gas in the torus (see Sect. 6). The V − H map shows red (blue) colors on the southern (northern) side of the galaxy, which allows us to identify the northern (southern) side as the far (near) side. This also accounts for the obscuration of the southern counterpart of the ionization cone detected in the optical northeast along PAout ∼ 15 − 20° (Fischer et al. 2013). The V − H map shows reddish colors at the AGN position, in agreement with the Seyfert 2 classification of the galaxy. The extended component of the ALMA 351 GHz continuum shows an equatorial geometry, that is, the dusty disk is oriented at a large angle relative to the outflow axis (PAGauss ∼ 87 − 88°; Table 4).
5.2.4. NGC 5643
At CND scales (r∼50–200 pc), molecular gas traced by CO(3–2) in this Seyfert 2 nucleus is concentrated in a two-arm nuclear spiral structure. This morphology reflects the gas response to the 5.6 kpc-size stellar bar detected in the near-IR along PA ∼ 85° (Mulchaey et al. 1997). Closer to the nucleus, the nuclear spiral is connected to a distinct bright CO disk at r ≤ 20 pc oriented along PA ∼ 4 − 5°, which is likely responsible for the red V − H color toward the nucleus. The compact CO disk shows an excellent correspondence in size and orientation with the dusty torus detected by ALMA at 351 GHz (PAGauss ∼ 4 − 5°; Table 4). Moreover, there is a counterpart of the molecular torus detected in very dense gas as probed by the HCO+(4–3) line (see Sect. 6). The CO emission flux measured at the AGN translates into a molecular gas mass Mgas[r ≤ 4 − 5 pc] ∼ (5.5 − 8.7)×105 M⊙ and a column density N(H2)∼(4.0 − 4.4)×1023 cm−2. A comparison with the close to east-west orientation of the ionized outflow (PAout ∼ 80° −85°) and the radio jet (Morris et al. 1985; Simpson et al. 1997; Leipski et al. 2006; Cresci et al. 2015; Mingozzi et al. 2019; García-Bernete et al. 2021) indicates that the dusty molecular torus geometry is roughly equatorial. Although the outflow is nearly edge-on, the V − H color map indicates that the western redshifted lobe is obscured by the galaxy disk. The ALMA subarcsecond CO(2–1) observations presented by Alonso-Herrero et al. (2018) showed a similar morphology to that seen in the CO(3–2) transition, on both the nuclear and circumnuclear scales.
5.2.5. NGC 6300
Molecular gas in this Seyfert 2 at moderate inclination (i = 57°; Appendix D) shows a structured r ≤ 150 pc inner CO(3–2) disk. This disk seems morphologically detached from a discontinuous two-arm spiral structure that can be identified in the map of Fig. 10 at larger radii (r ≥ 300 pc). On these larger scales the CO distribution can be explained in the framework of the expected response of the gas inside the corotation of the ∼4kpc-size stellar bar detected by Gaspar et al. (2019) along PA ∼ 46°. The morphology of the inner region shows a compact bright r ≤ 30 pc CO disk, which is responsible for the obscuration of the Seyfert 2 nucleus. The disk is embedded in a smoother gas distribution out to r ≤ 150 pc. Like in NGC 5643, this compact CO disk shows an excellent correspondence in size and orientation with the 351 GHz continuum disk imaged by ALMA. Furthermore, together with NGC 5506 and NGC 5643, it is one of three GATOS sources where a similar HCO+(4–3) torus is detected (see Sect. 6). The strong CO emission detected at the AGN implies a molecular gas mass Mgas[r ≤ 3 − 4 pc] ∼ (2.5 − 3.6)×105 M⊙ and a column density N(H2)∼(2.3)×1023 cm−2. The orientation of the dusty molecular torus (PAGauss ∼ 85°; Table 4) is mostly equatorial relative to the ionized outflow axis: Scharwächter et al. (2016) observed a biconical outflow extending out to ∼1.6 kpc from the AGN along PAout ∼ 15° −20°. Although the outflow is mostly edge-on, the V − H color map shows that the southern redshifted lobe is obscured by the ISM of the host.
5.2.6. NGC 6814
Molecular gas in this Seyfert 1.5 galaxy shows weak and clumpy CO(3–2) emission in the radial range 200 pc > r > 70 pc, i.e, well inside the 2.8 kpc-size NIR stellar bar located along PA = 21 − 25° (Mulchaey et al. 1997; Márquez et al. 1999). The CO clumps tend to concentrate along the two-arm spiral structure identified in the V − H map, where it stands out by its redder colors. At smaller radii, r < 70 pc, the spiral is connected to the northeast to an asymmetric molecular bar-like structure, which is oriented along PA ∼ 45°. The bar-like structure shows a CO deficiency toward the AGN. Emission of CO is barely detected at the AGN locus at a 3σ level implying upper limits on the molecular gas mass and the H2 column densities of Mgas[r ≤ 5 − 6 pc] ≤ (1.9 − 2.3)×104 M⊙ and N(H2)≤(0.6 − 1.2)×1022 cm−2, respectively. The region of the CO bar-like structure is characterized by its overall redder V − H colors, as similarly reported by Márquez et al. (2003). In particular, a conspicuous dusty ring of ∼20 pc-radius located around the AGN can be identified in the HST image. The eastern hemisphere of the dusty ring has a weak yet significant CO counterpart. The orientation of the ionized outflow in this source is controversial: values of PAout go from ∼30° −35° (Müller-Sánchez et al. 2011) to 150° (Schmitt & Kinney 1996). As in NGC 4388, the extended component of the 351 GHz continuum shows a mixed geometry if we assume PAout ∼ 33° but with a mostly undefined relative angle (Δ = [57°, 28°]; Table 4). Of particular note, the orientation of the CO bar-like structure is within the range of values derived for the extended component of the 351 GHz continuum.
5.2.7. NGC 7213
This nearly face-on (i = 35°; Appendix D) Seyfert 1.5 galaxy shows the weakest CO(3–2) emission among the GATOS sample. On the CND scales displayed in Fig. 12, the bulk of molecular gas is concentrated in a one-arm spiral structure that unfolds in the plane of the galaxy from (PA, r) ∼ (145°, 200 pc) to ∼(270°, 140 pc). The CO spiral shows an excellent correspondence with the dusty arm detected in the V − H color image of the galaxy. Leaving aside a number of isolated clumps located north of the AGN, there is a dearth of molecular gas probed by the 3–2 line of CO at r < 100 pc. In particular, the CO line is undetected at the position of the AGN. This nondetection implies 3σ upper limits on the molecular gas mass and the H2 column densities of Mgas[r ≤ 4 pc] ≤ (1.8 − 2.2)×104 M⊙ and N(H2)≤(1.1 − 1.8)×1022 cm−2, respectively. Farther out (r > 200 pc) the spiral structure traced by CO becomes filamentary and multi-arm (Fig. 10). The recent lower resolution (∼0.6″) ALMA CO(2–1) maps of the galaxy published by Ramakrishnan et al. (2019) (see also Alonso-Herrero et al. 2020; Salvestrini et al. 2020) showed a similar morphology to that seen in the CO(3–2) line, in particular regarding the deficit of molecular gas at r < 100 pc. This is in stark contrast with the picture drawn from the V − H map, which nevertheless shows significant dust extinction in the nuclear region.
Previous lower resolution images of the galaxy showed an unresolved centimeter and millimeter radio continuum source at the AGN interpreted as either synchrotron or free-free emission (Bransford et al. 1998; Thean et al. 2000; Blank et al. 2005; Murphy et al. 2010; Salvestrini et al. 2020). However, the improved resolution of the 351 GHz continuum image shows spatially-resolved emission at nuclear scales stemming from a ∼30 pc-size disk oriented along PAGauss ∼ 44° −71° (Table 4) and a network of filaments. The overall spectral index derived from the 230 GHz and 351 GHz fluxes measured at a common aperture of ∼0.6″ is ∼1.5, which suggests that the contribution of dust emission is significant. Although the [OIII] emission of the galaxy imaged by HST is described as mostly compact and halo-like by Schmitt et al. (2003), there is tantalizing evidence of an extension of the [OIII] emission around PAout = −15° to −30°. If this component is taken as evidence of an ionized outflow, the orientation of the 351 GHz extended component is close to equatorial.
5.2.8. NGC 7314
This intermediate barred galaxy is classified as a Sy 1.9 nucleus. Although NED gives a high inclination for the galaxy (i = 70°; based on photometry) we attribute to i a somewhat lower value based on the kinematics of the CO(3–2) line (i = 55°, Appendix D). The bulk of the CO emission detected inside the ALMA FOV resides in an elongated 300 pc-size source oriented along PA ∼ 20°. In particular, the distribution of CO around the AGN shows a twin-peak morphology with two CO peaks located symmetrically around the AGN at a radial distance r ∼ 20 pc along PA ∼ 20°. Like in NGC 4941, the two CO peaks show a conspicuous butterfly shape. Although the CO emission does not peak at the very center the line is nevertheless detected at the AGN, implying values for the molecular gas mass and H2 column densities of Mgas[r ≤ 5 − 7 pc] ∼(4.3 − 6.5)×104 M⊙ and N(H2)∼1.4 × 1022 cm−2, respectively. At larger radii (200 pc > r > 20 pc), molecular gas shows hints of a nuclear spiral-like structure.
Da Silva et al. (in prep.) detected a wide opening angle (∼90° −100°) fan-shape [OIII] structure that extends mostly west of the nucleus and interpreted this as the signature of an ionized outflow with a mean axis PAout ∼ 100° −120°. The eastern lobe of the outflow seems to lie below the galaxy plane and therefore suffers the extinction of the galaxy ISM, as expected if the eastern side of the disk is the near side. The southern (unresolved) component of the double radio source detected by Thean et al. (2000) at 8.4 GHz coincides with the AGN locus defined by the position of the ALMA 351 GHz continuum point source. The extended component of the 351 GHz continuum extends for 50–60 pc along PAGauss ∼ 20° −30°, that is, in agreement with the overall orientation of the CO elongated source. Therefore the dusty molecular disk structure has an equatorial (torus-like) geometry, based on their projected orientation perpendicular to the outflow axis.
5.2.9. NGC 7465
Molecular gas in this relatively inclined (i = 55°; Appendix D) Seyfert 2 galaxy is oriented along PA ∼ 30° at r < 200 pc. In particular, the distribution of molecular gas shows a pair of spiral-like gas lanes connected closer to the center to an elongated disk of ∼70 pc-radius. The CO spiral becomes filamentary and multi-arm at larger radii (Fig. 10). The overall distribution of molecular gas at CND scales shows a good correspondence with the network of dust lanes identified in the V − H color image of the galaxy, which are oriented perpendicular to the photometric major axis of the system (PA = 120°). As in NGC 6814, the V − H image shows a dusty ring of ∼40 pc-radius located around the AGN. Furthermore, the orientation of the elongated CO disk is roughly perpendicular to the [OIII] bi-cone structure identified by Ferruit et al. (2000) (PAout ∼ 100° −115°). The latter can be interpreted as the signature of an ionized outflow stemming from the Seyfert 2 nucleus of the galaxy. Although the CO emission does not peak at the AGN, the detection of the line at the nucleus implies values for the molecular gas mass and H2 column densities of Mgas[r ≤ 5 − 7 pc] ∼ (1.4 − 1.9)×105 M⊙ and N(H2)∼(4.5 − 5.4)×1022 cm−2, respectively. The weak extended component of the 351 GHz continuum shows hints of equatorial (torus-like) geometry with an angle (PAGauss ∼ 4°; Table 4) close to that of the CO disk at small radii (PA ∼ 20°). NOEMA CO(2–1) observations of the nuclear regions show the presence of two emitting clumps separated by ∼1″ on both sides of the AGN oriented at approximately 30° (Domínguez-Fernández et al. 2020). These molecular clumps appear further resolved in the ALMA CO(3–2) observations.
5.2.10. NGC 7582
On the CND scales displayed in Fig. 12, the CO(3–2) emission in this highly inclined (i = 59°; Appendix D) barred Seyfert 2 galaxy is detected at every single position inside r < 200 pc. However, a sizeable fraction of the molecular gas appears concentrated in a nuclear ring of ∼200 pc (deprojected) radius. Molecular gas in this nuclear ring is feeding an active star formation episode detected at optical as well as near and mid IR wavelengths. The molecular gas ring is the likely signature of the gas response to the ∼140″ (16 kpc) long stellar bar at its ILR region. The bar, detected in the NIR by Quillen et al. (1997) and Buta et al. (2009), shows a prominent boxy-shape morphology. At the larger radii imaged inside the ALMA FOV (Fig. 10), molecular gas shows a two-arm spiral structure that is connected to the nuclear ring. Closer to the Seyfert 2 nucleus (r < 50 pc), molecular gas probed by CO is concentrated in an asymmetric ringed disk of ∼30 − 40 pc radius located around the AGN and oriented along ∼160°. The molecular disk shows a similar orientation to the extended component of the 351 GHz continuum emission detected by ALMA (PAGauss ∼ 160° −162°; Table 4). The CO disk appears to be partly incomplete: its southwest hemisphere is on average a factor of 3 weaker than its northeast counterpart. The V − H map shows a dusty ring feature in excellent correspondence with the morphology of the CO ringed disk. There is nevertheless significant molecular gas inside the ring: CO emission is detected toward the position of the AGN defined by the position of the ALMA 351 GHz continuum point source. This implies values for the molecular gas mass and H2 column densities of Mgas[r ≤ 7 − 9 pc] ∼ (1.5 − 2.9)×105 M⊙ and N(H2)∼(3.5 − 3.6)×1022 cm−2, respectively. The galaxy shows a bright ionization cone southwest of the nucleus oriented along PAout ∼ 235° −245° and characterized by blueshifted velocities, which betray an outflow (Morris et al. 1985; Storchi-Bergmann & Bonatto 1991; Davies et al. 2016; Ricci et al. 2018a). The northeast ionization cone appears to be obscured by the host galaxy. The orientation of the 70 − 90 pc-size disk detected by ALMA in continuum and CO is therefore equatorial (torus-like).
6. The many faces of dusty molecular tori: dust, CO, and HCO+ emission
We have shown in Sect. 5.2 that the CO images obtained by ALMA reveal the presence of significant amounts of molecular gas on nuclear scales in all the galaxies of our sample excluding NGC 7213. In particular, molecular gas emission in eight sources is associated with the detection of continuum emission from conspicuous dusty disks. These disks are characterized by an equatorial projected geometry (Δ ≥ 60°). In addition, there are four sources where significant CO emission is associated with a continuum disk that shows either a polar (Δ ≤ 30°) or a mixed projected geometry (30° < Δ < 60°). While the CO emission does not generally peak at the AGN, the 3–2 line is detected close to the central engines (at radii r ≤ 3 − 10 pc) in all the galaxies, with the exception of NGC 6814 and NGC 7213. However, the 3–2 line of CO, sensitive to moderately dense molecular gas (∼a few 104 cm−3) is not optimized to isolate a morphologically distinct molecular torus feature, in particular in those sources where molecular tori are seen to be connected to the gas reservoir of the CND, which can also be a bright CO emitter. As shown in Sect. 4, the identification of dusty tori probed by their submillimeter continuum emission is comparatively easier, since dust emission is proportional to the dust column density and to the expected high dust temperatures of AGN environments. Alternatively, the use of molecular line tracers that are more specific to the high densities and temperatures, which are likely prevalent in the torus, can facilitate this identification.
The emission of HCO+(4–3) was observed simultaneously with the CO(3–2) line during our observations. The critical densities for the HCO+(4–3) line, ncrit ∼ 2 − 4 × 106 cm−3 for Tk ∼ 10–100 K (Shirley 2015), are about two orders of magnitude higher than the corresponding values for CO(3–2) within the same range of temperatures. Although the excitation of HCO+ lines can be significant at effective densities well below the critical densities of the transitions due to the effects of radiative trapping at high opacities, compared to the 3–2 line of CO, the 4–3 line of HCO+ traces denser molecular gas in AGN (n(H2)≥105 − 106 cm−3; Imanishi & Nakanishi 2013, 2014; Iono et al. 2013; García-Burillo et al. 2014, 2019; Viti et al. 2014; Izumi et al. 2015, 2016b; Martín et al. 2016). We obtained clear detections of the HCO+ line in four of our sources.
Figure 14 compares the CO(3–2), HCO+(4–3), and dust continuum emission from the dusty molecular tori of NGC 5506, NGC 5643, and NGC 6300. In these galaxies HCO+(4–3) emission is detected at nuclear scales at high significance (≃15σ − 35σ in velocity-integrated intensities). The emission of HCO+ is weaker yet statistically significant in NGC 7465 (≥5σ). Furthermore, the emission of HCO+ is spatially resolved in NGC 5643 and NGC 6300. In NGC 5506, the HCO+ AGN disk is connected to more extended emission stemming from the disk of the host. Figure 14 shows that the HCO+ tori show an excellent correspondence in their position, size, and orientation with the CO and dusty disks identified in these sources.
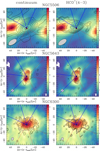 |
Fig. 14. Left panels: overlay of the continuum emission (Icont; contours) on the velocity-integrated CO(3–2) maps (ICO; linear color scale) of the central Δx × Δy = 100 pc × 100 pc regions of NGC 5506, NGC 5643, and NGC 6300, derived from their ALMA HSR datasets. Color scale spans the range [3σCO, |


Figure 15 compares the HCO+(4–3) and CO(3–2) spectra and the CO/HCO+ intensity ratios derived at the AGN positions in six galaxies of the GATOS core sample. The upper panels illustrate this comparison for the three galaxies showing the brightest HCO+ emission in their tori, shown in Fig. 14. We also show the CO and HCO+ spectra stacked for these sources, obtained after subtraction of the vsys values derived in Appendix D. The fairly low CO/HCO+ velocity-integrated intensity ratios measured toward the AGN in these sources, ∼2.8 − 5.7 (∼4.9 from the stacked spectra), suggest the presence of high-density molecular gas at small radii ≤3 − 10 pc from the central engines. These ratios are comparable to the value measured by García-Burillo et al. (2019) toward the central offset of the NGC 1068 torus, CO/HCO+ ∼2.0, where Viti et al. (2014) estimated that the average molecular gas density is n(H2) ≃ a few 106 cm−3. The lower panels of Fig. 15 compare the AGN spectra obtained in three GATOS sources characterized by significantly weaker HCO+ emission and correspondingly higher CO/HCO+ intensity ratios ≥7.5 − 16 (∼11.2 from the stacked spectra): NGC 7314, NGC 7465, and NGC 758211.
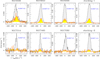 |
Fig. 15. Comparison of the molecular gas emission toward the AGN probed by the HCO+(4–3) (yellow-filled histograms) and CO(3–2) (gray-filled histograms) lines in two subsets of GATOS galaxies. Upper panels: comparison for the galaxies shown in Fig. 14 where strong (> 15σ) and/or spatially resolved emission is detected in HCO+(4–3): NGC 5506, NGC 5643, and NGC 6300. The spectra stacked for these sources is shown under the label stacking-I. Lower panels: compare the AGN spectra obtained in NGC 7314, NGC 7465, and NGC 7582. For these galaxies, either the detection of HCO+ or the lower limit on the CO/HCO+ ratio are statistically significant. The spectra stacked for these sources is shown under the label stacking-II. |
Figure 16 shows the CO(3–2)/HCO+(4–3) ratios measured toward the AGN of the GATOS and NUGA galaxies as a function of the Eddington ratio of the sources. Compared to the GATOS Seyferts, the CO/HCO+ ratios measured in five of the lower luminosity and the lower Eddington ratio sources of NUGA show a larger span of values: ∼8.5 − 38. In particular, NGC 1808 and NGC 1326 show very high CO/HCO+ ratios (≥34 − 38), an indication that the average gas densities of their molecular tori are the lowest among our sample. Conversely, the high molecular gas densities hinted at by the low CO/HCO+ ratios measured in GATOS Seyferts, might indicate that diffuse molecular gas has been preferentially driven out by outflows, while higher density clumps have remained in the molecular tori of these sources. Overall, the order of magnitude differences in the CO/HCO+ ratios measured within our sample are indicative of a very different density radial stratification inside the molecular tori of these Seyferts.
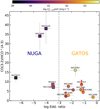 |
Fig. 16. Comparison of the CO(3–2)/HCO+(4–3) ratios measured at the AGN locus in the galaxies of the NUGA (square markers) and GATOS (circle markers) samples as a function of the Eddington ratio. Symbols are color-coded as a function of the AGN luminosities measured in the 2–10 keV band for the sample galaxies. Lower limits on the ratios are identified by the (red) arrows. Uncertainties on the ratios (∼21%) are driven by the absolute flux calibration errors on the lines (∼15%). Eddington ratios have a ∼±0.4 dex uncertainty. |
7. Dusty molecular tori and the processing of X-rays
7.1. Dusty molecular tori and X-ray absorption
Many previous studies tried to find a connection between the line-of-sight gas column densities responsible for the absorption of X-rays (NH(Xabs)) and those derived from the obscuration measurements obtained at other wavelengths (NH) in different populations of AGN. The early work of Maiolino et al. (2001) failed to find a connection using the gas-to-dust ratio (AV/NH), where the dust reddening was estimated using optical and infrared lines. Maiolino et al. (2001) attributed their results to the different properties exhibited by dust in the circumnuclear regions of AGN. This kind of analysis has been recently revisited by Ogawa et al. (2021), who explain the results of Maiolino et al. (2001) and their own measurements with an updated unified picture of AGN structure that comprises a dusty torus, a dusty polar component, and a dust-free gaseous disk component. Other works have also used the optical extinction from spectral fitting of the dust continuum at mid-infrared wavelengths (Esparza-Arredondo et al. 2019, 2021). In this section we explore for the first time the connection between the molecular gas column densities derived from CO (NH(CO)) and NH(Xabs) using our sample of AGN.
Figure 17 (left panel) illustrates the comparison between NH(CO), in units of H atoms per cm2, and NH(Xabs), taken from Table 5 of Ricci et al. (2017a) in the 13 galaxies of Table 3 and the NUGA source NGC 613. Ricci et al. (2017a) used different models to fit the broadband X-ray spectra for these sources, accounting for the complexity and nature of each particular object. As for the reflection component, in the four AGN included in this analysis that lie in the Compton-thick regime, namely NGC 1068, NGC 4941, NGC 5643, and NGC 7582, Ricci et al. (2017a) used a physically motivated torus model (BNtorus; Brightman & Nandra 2011), different from the screen geometry used by the same authors in the less obscured objects (pexrav; Magdziarz & Zdziarski 1995)12.
 |
Fig. 17. Left panel: comparison of the column densities of neutral gas measured from CO toward the AGN (NH(CO); in units of H atoms per cm2) with the column densities derived by modeling the absorption of X-rays (NH(Xabs); Ricci et al. 2017a) in the galaxies listed in Table 3 and in NGC 613. In this comparison we use the HSR datasets of ALMA for the core sample of GATOS. The blue color is used to draw the 1:1 line, while the red color identifies the linear bisector fit to te data. Right panel: comparison of the average surface density of molecular gas measured for the molecular tori of the galaxies listed in Table 3 ( |

The scatter plot of Fig. 17 (left panel) shows an admittedly large dispersion of values around the 1:1 line. However, the median values of the distributions of log(NH(CO)) and log(NH(Xabs)) differ only by ≃0.15 dex. Furthermore, there is a statistically significant correlation between the two variables as confirmed by the estimated Pearson’s correlation coefficient, r = +0.57, and its associated one-sided p value ∼0.02, derived from the physically-motivated alternative hypothesis that log(NH(CO)) and log(NH(Xabs)) show a positive correlation coefficient. Similarly, the Spearman and Kendall tests show that both column densities have positive rank parameters, ρSp = +0.46 and ρKe = +0.35, respectively, with one-sided p values ∼0.05.
While the estimates of NH(CO) are uncertain to the extent that they depend on the assumed CO–to–H2 and 3–2/1–0 conversion factors (see Sect. 8.1 for a detailed discussion), the existence of a positive correlation between NH(CO) and NH(Xabs) and the similar median values of their distributions suggest that the neutral gas line-of-sight column densities sampled by ALMA at scales ≃7 − 10 pc (the spatial resolution of our observations) make an important contribution to the obscuration of X-rays in the galaxies of Fig. 17.
A closer look at Fig. 17 reveals that less absorbed galaxies (NH(Xabs) < 1022 cm−2) tend to lie systematically above the 1:1 line. In contrast, galaxies with high X-ray obscuration (NH(Xabs) > 1022 cm−2) are closer to or lie below the 1:1 line. This result is expected if the X-ray absorption in type 1 objects is dominated by a ≤pc-scale dust-free gas disk component, while NH(CO) traces the comparatively higher molecular gas column density of the torus probed by ALMA on scales ≃7 − 10 pc (the spatial resolution of our observations). Conversely, in type 2 objects, the agreement between NH(CO) and NH(Xabs) is expected to be better, in agreement with the scenario discussed by Ogawa et al. (2021). We can foresee that higher spatial resolution ALMA observations would find an even better correlation for type 2 AGN.
7.2. Dusty molecular tori and X-ray reflection
In this section we adopt a torus model different from the one used by Ricci et al. (2017a) to fit single epoch NuSTAR X-ray observations obtained in a subset of galaxies of our sample with the aim of obtaining an independent and self-consistent estimate of the X-ray reflected component in 11 galaxies of our sample.
To accomplish this, we fit all the spectra obtained in the galaxies listed in Table C.1 to a combination of an intrinsic continuum (modeled with a cutoff power-law model, cutoffpl in XSPEC), a distant and neutral reflection component, and two emission lines (fitted with Gaussians, zgaussi, i = 1,2 in XSPEC) centered at the 6.7 and 6.97 keV Fe emission lines, for which we assumed a 0.1 keV width, smaller than the spectral resolution of NuSTAR. The intrinsic continuum is absorbed by a partial covering screen along the line of sight (zpcfabs in XSPEC). For the reflection component we used the smooth model borus02 provided by Baloković et al. (2018). This can be written in XSPEC format as:
 (1)
(1)
where the free parameters are the line-of-sight column density associated with the partial covering ( ), the line-of-sight covering factor of the source (fcov), the torus column density associated with the borus02 component (NH(Xref)), and the photon index of the cutoff power-law component (Γ). We note that we also let vary the viewing angle toward the observer and the half opening angle of the torus for the reflection component. However, these two values are fully unconstrained for most of the sources analyzed. While this model does not consider line-of-sight Compton scattering, which can be important to properly reproduce the X-ray continuum in heavily obscured sources, it is included for the reflection component within the borus02 model. We also stress that, at least in some cases (e.g., NGC 6814), the addition of neutral partial covering could lead to values of the line-of-sight column density rather different from those reported in the literature. We therefore preferred to use the line-of-sight column densities obtained by Ricci et al. (2017a). Furthermore, some objects are known to require the inclusion of two reflection components to fit their spectra (such as in NGC 1068; Bauer et al. 2015). The column density of the reflector component derived here for NGC 1068 nevertheless matches that accounting for most of the FeKα line in Bauer et al. (2015). Finally, some type 1 AGN might require a disk reflection component.
Table C.1 lists the best-fit χ2 statistics together with the resulting parameters. We also explored if the line-of-sight obscuration could be the same as the reflecting material. For that purpose we linked together these two values ( ) when fitting and performed an f-test to see in which cases the linked scenario was enough to reproduce the data. In 7 out of the 11 objects the absorptions must be unlinked. The exceptions are NGC 4388, NGC 4941, NGC 5643, and NGC 7213. Table C.1 also lists the resulting column densities when the linking of both absorptions was preferred as solution.
Figure 17 (right panel) compares the average gas surface density of the dusty molecular tori of the galaxies listed in Table C.1 ( (CO), in units of H atoms per cm2) with the column density responsible for the reflection of hard X-rays derived above (NH(Xref)). Within the limits of our small sample statistics, we see a positive correlation between the two column densities, similar to the one shown by log(NH(CO)) and log(NH(Xabs)) in Sect. 7.1 (Pearson’s correlation coefficient r = +0.64 and associated two-sided and one-sided p values ∼0.03 and ∼0.02, respectively). However, in stark contrast with the comparison of column densities discussed in Sect. 7.1, the median values of the distributions of log(
 (CO)) and log(NH(Xref)) differ now by ≃1.54 dex. This flagrant discrepancy can be explained if the bulk of the neutral gas producing the reflection of X-rays is preferentially located at the inner walls of the tori, therefore at very small radii < 1 pc, as argued by Liu & Li (2015). Resolved studies of the characteristic Fe K X-ray fluorescence line in nearby AGN (e.g., Gandhi et al. 2015; Minezaki & Matsushita 2015) suggest that the bulk of the X-ray reflection arises at or within the infrared dust sublimation radii on subparsec scales (see, however, Bauer et al. 2015; Marinucci et al. 2017; Fabbiano et al. 2017, 2018; Yi et al. 2021). These regions would typically have the highest gas densities, as suggested by the density radial stratification revealed by the 2–3 pc spatial resolution ALMA images of the torus of NGC 1068 (e.g., García-Burillo et al. 2019).
Despite the discrepancy in their mean values, the linear correlation between log( (CO)) and log(NH(Xref)) reported above suggests that both quantities are linked to the same region. Whether this scenario applies for dusty molecular tori in general remains to be proved by new ALMA and NuSTAR observations using larger samples of nearby AGN.
8. The radial distribution of molecular gas: the imprint of feedback
8.1. Circumnuclear versus nuclear scales
In Sect. 5.1 we concluded that the molecular gas content measured on ∼ kpc scales shows no dependence on the AGN luminosity or the Eddington ratio of the galaxies of our sample. The absence of a clear trend can be explained by the very different spatial scales and timescales relevant to the feeding and feedback cycle of Seyfert galaxies on the one hand and to the assembly of the kpc-scale gas reservoirs on the other.
On smaller scales AGN winds and jets have nevertheless been seen to leave an imprint on the radial distribution of molecular gas in a number of Seyfert galaxies. High-resolution ALMA images obtained in three galaxies of our sample show that AGN winds and jets can push outward significant amounts of ISM material inside the disk and create deficits of molecular gas at scales r ≤ 30 − 100 pc in NGC 1068 (García-Burillo et al. 2014, 2019) and NGC 3227 (Alonso-Herrero et al. 2019), and even on larger scales in NGC 5643 (Alonso-Herrero et al. 2018; García-Bernete et al. 2021). Similar “holes” in CO emission identified in the circumnuclear disk of the Seyfert 2 galaxy NGC 5728 were attributed to molecular gas removal by the AGN wind (Shimizu et al. 2019).
We explore below if a simple parameterization of the radial distribution of molecular gas in the galaxies of our combined sample is able to capture the effects of AGN feedback. Based on the results obtained in NGC 1068, NGC 3227, and NGC 5643, we purposely focus on the central r ≤ 200 pc regions where molecular gas reservoirs are expected to build up and potentially reflect the effects of AGN-driven outflows. In particular we investigate if the concentration of molecular gas inside typical ‘circumnuclear’ disk scales shows any dependence on LAGN and/or on the Eddington ratio in our sample galaxies. To accomplish this, we first derived the average H2 surface densities measured using two alternative definitions of the ‘nuclear’ spatial scales:
-
A region common for all galaxies defined by r ≤ 50 pc:
 . Figure 5 shows that the typical sizes of dusty molecular tori in our sample galaxies are a factor of ∼2 smaller. This scale therefore probes the region occupied by the tori and their immediate surroundings13.
 -
A region defined on a case-by-case basis by the extended emission components identified at 870 μm (Sect. 4.2) for the GATOS sources:
 . For sources of the NUGA sample we adopted the torus sizes published by Combes et al. (2019). According to Fig. 5, this definition of the nuclear scales typically encompasses regions r ≤ 20 − 30 pc for most of our sources.
We normalized the nuclear surface densities  and
and  to the H2 surface densities measured on ‘circumnuclear’ scales (r ≤ 200 pc), hereafter referred to as
  . The adopted normalization is intended to neutralize any potential bias that may result from the different overall molecular gas content of the galaxies of our sample and it therefore serves as a measurement of the gas concentration. Furthermore, as our gas concentration index is derived from surface densities averaged inside the regions defined above we minimize the variance that could be introduced by the analysis of individual radial profiles. To derive the mass estimates on circumnuclear and nuclear scales we assumed slightly different 3–2/1–0 brightness temperature ratios of ∼2.0 and ∼2.9, respectively, based on the values measured on similar spatial scales in NGC 1068 (García-Burillo et al. 2014). The H2 surface densities derived at these different spatial scales for the galaxies of our combined sample are listed in Table 6.
Figure 18 represents the molecular gas concentration indices, estimated by  (hereafter, index-I) and
  (hereafter, index-II), as a function of the intrinsic (absorption-corrected) AGN luminosities measured in the 2–10 keV band (
 ). Symbols are color-coded to explore in parallel any potential dependence of the molecular gas concentration indices on the Eddington ratio. A visual inspection of Fig. 18 shows that there is a significant trend pointing to lower molecular gas concentration indices in the higher luminosity and the higher Eddington ratio sources of our sample. The trend is statistically significant for both indices as confirmed by the estimated Spearman’s and Kendall’s rank coefficients (ρSp and ρKe), as well as by the Pearson’s correlation coefficient (r), and their associated two-sided p values, listed in Table 7. In particular, the gas concentration measured by index-I changes by ∼1 dex across the sample. The corresponding decrease is of ∼2 dex for index-II.
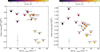 |
Fig. 18. Left panel: estimate of the concentration of molecular gas in the central regions of the galaxies of GATOS and NUGA samples derived from the ratio of the average H2 surface densities measured at two spatial scales: r ≤ 50 pc ( |


Statistical estimates of rank correlations.
The GATOS sources with the highest AGN luminosities (NGC 1068, NGC 3227, NGC 4388, NGC 5506, and NGC 7582) show a flat distribution of surface densities, characterized by an index-I ≃–0.2 to +0.2. This is in stark contrast with the more centrally peaked distributions shown by the lower AGN luminosity sources among the GATOS sample and NUGA sources, which show a common range for index-I ≃+0.5 to +0.8. Furthermore, while both indices show a similar spread of values for GATOS sources, index-II is comparatively boosted for NUGA sources (index-II ≃+1.0 to +2.0).
The estimates of the molecular gas masses derived from the 3–2 line of CO on nuclear scales are subject to uncertainties related, first, to the assumed 3–2/1–0 ratio, which is here taken from the value measured in the molecular torus of the GATOS source NGC 1068 (García-Burillo et al. 2014, 2019; Viti et al. 2014), and second, to the adopted CO–to–H2 conversion factor, which we assumed to be the canonical value of the Milky Way. We can give a conservative estimate of the overall uncertainties accounting for the systematic errors associated with the two conversion factors mentioned above. We estimate that the latter may contribute up to ∼0.12–0.13 dex each if we allow them to explore the full range of values seen in the observations of different populations of galaxies (on all ranges of spatial scales) and, also, if we assume the unlikely worst case scenario where these uncertainties are fully uncorrelated. Under these extreme hypotheses the total uncertainty amounts to ±0.20 dex14. While we do not have quantitative estimates for these conversion factors for the galaxies of our combined sample, we nevertheless expect that, compared to GATOS sources, molecular gas will be less excited on nuclear scales for NUGA sources, which are characterized by lower AGN luminosities, and therefore lower X-ray and UV irradiation of molecular gas. The trend shown by the CO(3–2)/HCO+(4–3) ratio in Fig. 16 seems to independently corroborate this picture. Adopting a lower 3–2/1–0 ratio would therefore increase the nuclear-scale mass estimates for NUGA Seyferts. In addition, if at all, the CO–to–H2 conversion factor would have to be lowered relative to the assumed Milky Way value for the nuclear scales of GATOS Seyferts, where molecular gas is expected to live in a more heavily irradiated and dynamically perturbed environment. This habitat is more akin to the disturbed medium of ULIRGs and nuclear starbursts where this factor is assumed to be 1/4 of the Milky Way value. In summary, any foreseeable change of these conversion factors in our sample galaxies would rather combine to further reinforce the trends shown in Fig. 18 well beyond the uncertainties estimated above.
8.2. The dusty molecular tori scales
We have shown in Sect. 8.1 that NUGA galaxies show a notably higher degree of concentration of their molecular gas on circumnuclear scales compared to that of GATOS sources. These differences are amplified most singularly if we estimate the gas concentration by the  ratio, namely when nuclear scales are set by the tori. In this section we study the variance in a set of physical properties of the dusty molecular tori between GATOS and NUGA sources. Figure 19 compares the average gas surface densities of the tori,
  , and the H2 column densities measured from the velocity-integrated CO intensities toward the AGN,
  (listed in Table 4)15, in our sample galaxies.
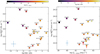 |
Fig. 19. Comparison of physical properties of the molecular tori in GATOS (circle markers) and NUGA (square markers). Average molecular gas surface densities ( |


The distribution of  for GATOS sources shows a large scatter within an overall wide range of values ≃5.0 × 101–4.0 × 10³ M⊙ pc−2, which show no trend with the Eddington ratio within the range covered by this sample. Molecular tori in NUGA sources nevertheless show comparatively higher
  values ≃1.3 × 10³–2.0 × 10⁴ M⊙ pc−2. Within the limits imposed by the limited number of very low Eddington ratio sources, the combined NUGA and GATOS samples do suggest a tantalizing monotonic decrease of
  with the Eddington ratio or the AGN luminosity.
The trend is on the borderline of statistical significance as estimated by the Pearson’s correlation coefficient (r ∼ −0.4) and its associated two-sided p values = 0.05–0.08, listed in Table 7. The significance of this anticorrelation increases under the physically-motivated alternative hypothesis that log( ) and log(LAGN) have a negative Pearson’s correlation coefficient, in which case the associated one-sided test p value decreases to ∼0.03. The one-sided test using the Eddington ratio as a substitute for the AGN luminosity gives a p value∼0.04. This trend could explain the different behavior of the gas concentration indices discussed in Sect. 8.1.
Furthermore, the deconvolved diameters of tori (Dtorus) show no significant trend with the AGN luminosity or the Eddington ratio. In particular, GATOS and NUGA sources show a common median value for Dtorus ∼ 42 pc. The value estimated for Dtorus in NGC 5506, which stands out as an outlier in the distribution, is likely overestimated due to the contribution of dust emission stemming from the highly inclined disk of the host (see AH21).
As expected, the variance in  values between GATOS and NUGA sources is similar to that shown by
  and so are their associated rank and correlation parameters listed in Table 7. Molecular tori in NUGA sources tend to show higher gas column densities compared to GATOS. The existence of a monotonic decrease of
  with the AGN luminosity or the Eddington ratio for the combined sample is nevertheless on the border of statistical significance. In particular, the physically-motivated alternative hypothesis that log(
 ) and log(
 ) have a negative Pearson’s correlation coefficient has a one-sided p value ∼0.04. The same test using the Eddington ratio as a substitute for the AGN luminosity gives a p value∼0.07.
8.3. A scenario describing the imprint of AGN feedback in Seyfert galaxies
Figures 12 and 13 visualize the existence of a depression in the radial distribution of molecular gas, and in some extreme cases (e.g., NGC 1068) of a distinct “hole” at nuclear scales for a significant fraction of GATOS sources. As expected, galaxies like NGC 1068 and NGC 3227, where the presence of AGN-driven molecular outflows was established (García-Burillo et al. 2019; Alonso-Herrero et al. 2019), are among the galaxies showing the highest gas deficiencies on nuclear scales according to Fig. 18.
NGC 1068 is the most extreme case exemplifying the effect of AGN feedback on the radial redistribution of molecular gas in the disk. The CND of NGC 1068 shows a highly-contrasted ring structure with a steep radial profile on its inner edge. This morphology reflects the accumulation of molecular gas at the working surface of the AGN wind and jet, which is currently situated at radii ∼50 − 80 pc. This distinct signature is found in all the high-resolution images of the CND obtained in a large variety of molecular gas tracers that probe several orders of magnitude in volume densities and kinetic temperatures (Müller Sánchez et al. 2009; Storchi-Bergmann et al. 2012; García-Burillo et al. 2014, 2019; Imanishi et al. 2018). The molecular torus of NGC 1068 is connected to the r ∼ 200 pc CND ring through a network of gas streamers, which are detected at r ≤ 50 pc, that is, inside the distinct cavity excavated by the AGN wind and the radio jet (García-Burillo et al. 2019). The kinematics of molecular gas show unambiguous signs of outflowing motions in the torus itself, but also, in the gas streamers and the CND ring. Most of the mass, momentum and energy of the molecular outflow is contained by the CND, where the AGN wind and the radio jet are currently sweeping the gas of the disk at a high rate (Ṁ ≃ 60 M⊙ yr−1; García-Burillo et al. 2019).
The molecular outflow of NGC 3227 studied by Alonso-Herrero et al. (2019) has also left an imprint on the distribution of molecular gas on nuclear scales. The NGC 3227 outflow nevertheless appears as less extreme or less evolved compared to that of NGC 1068: it extends up to a factor of 10 smaller radial distances (∼30 pc) when compared to NGC 1068 and is pushing the ISM in the disk of the galaxy with moderate outflow rates that are an order of magnitude lower (Ṁ ≃ 5 M⊙ yr−1).
As in NGC 1068 and NGC 3227, ALMA detected the presence of molecular outflowing components at different spatial scales in NGC 5643 (Alonso-Herrero et al. 2018; García-Bernete et al. 2021). The CO(2–1) profiles comprise several velocity components that result from the interaction of the AGN outflow with molecular gas in the disk ∼500 pc from the AGN. This interaction created a large-scale molecular outflow with a high mass outflow rate (Ṁ ≃ 51 M⊙ yr−1; García-Bernete et al. 2021). On nuclear scales, Alonso-Herrero et al. (2018) detected noncircular motions in the ∼30 − 40 pc-diameter molecular torus that could be explained as radial outflows, as similarly found in the outflowing NGC 1068 torus (Gallimore et al. 2016; García-Burillo et al. 2016, 2019; Impellizzeri et al. 2019; Imanishi et al. 2020).
As discussed in Appendix A and Sect. 5.2, AGN winds are present in the majority of the GATOS sources. Although in a smaller number of objects, the existence of radio jets has also been reported. AGN winds and radio jets could therefore launch and promote molecular outflows in other GATOS sources similar to those of NGC 1068, NGC 3227, and NGC 5643.
In order to search for signatures of molecular outflows in other sources, we used the software package kinemetry, developed by Krajnović et al. (2006), to fit the velocity fields derived from the CO(3–2) data of the GATOS core sample. The outcome of this analysis, presented in Appendix D, shows evidence of molecular outflows in the CND of three sources: NGC 4388, NGC 5506, and NGC 5643. In particular, the bulk of the noncircular motions identified can be interpreted as due to the presence of coplanar molecular outflow components. For NGC 4388 and NGC 5643 these results confirm the findings of Domínguez-Fernández et al. (2020), Alonso-Herrero et al. (2018), and García-Bernete et al. (2021), who found evidence of molecular outflows in these sources based on a study of the gas kinematics derived from lower resolution CO(2–1) images obtained with NOEMA and ALMA. The newly detected outflows in NGC 4388 and NGC 5506 are seen to extend out to deprojected radii ∼100 − 200 pc from the AGN and have moderate radial velocities ∼50 − 100 km s−1. Furthermore, we find only tentative evidence of moderate ∼50 − 100 km s−1 molecular outflows in NGC 4941 and NGC 7465. The location of NGC 5643, NGC 4941, and NGC 7465 in Fig. 18 is intermediate between the two extremes represented by NGC 1068 and the NUGA sources.
In NGC 7582, the other galaxy showing a gas deficit on nuclear scales illustrated by Fig. 18, we only find marginal evidence of moderate outflow motions (< 50 km s−1) up to 100 pc from the AGN. We nevertheless find evidence of inflows triggered by the stellar bar down to the deprojected radii of the likely location of the ILR region of the bar (r ∼ 250 − 300 pc). Molecular gas is distributed in a two-arm nuclear spiral that ends up in a ring. This morphology can be interpreted as the gas response to the 16 kpc-long bar near its ILR region. The nuclear-scale gas deficit detected in NGC 7582 may have been caused by a previous episodic molecular outflow event or, alternatively, by the gravity torques exerted by the stellar bar over longer time scales on the gas. Inside the ILR ring torques are expected to be positive and be able to drive gas outward. Both AGN feedback and bar-driven secular evolution can combine their efforts to quench AGN fueling at nuclear scales.
To summarize, we find clear evidence of molecular outflows in four of the five GATOS Seyferts showing the most extreme nuclear-scale gas deficits in our sample, namely NGC 1068, NGC 3227, NGC 4388, and NGC 5506. We nevertheless find marginal evidence of outflow in NGC 7582.
The existence of a molecular outflow is not always accompanied by a conspicuous nuclear-scale molecular gas deficit. The case of the NUGA galaxy NGC 613 is a good illustration of this paradox. Audibert et al. (2019) detected a high-speed (vout ∼ 300 km s−1) compact molecular outflow in the central r < 20 − 25 pc region around the Seyfert nucleus of the galaxy. In the absence of a powerful AGN wind in this source, Audibert et al. (2019) concluded that the outflow is likely triggered by the highly-collimated 200 pc-size radio jet imaged by the VLA. The low Eddington ratio of NGC 613 and the high value of  place the galaxy in a region of the parameter space that is not conducive to launch dusty outflows from the central engine, according to the predictions of Venanzi et al. (2020) (see discussion in AH21). This would suggest that the jet is the only agent able to launch a molecular outflow in this source. The picture drawn from the ALMA image of NGC 613 indicates that although the radio jet has triggered a small molecular outflow at its very base, it has left virtually intact the distribution of molecular gas outside r ∼ 20 − 25 pc: NGC 613 shows high values of the molecular gas concentration indices (see Fig. 18). The 3D geometry of the molecular outflow and the jet remain unconstrained. However, the low coupling efficiency of the jet with the ISM can be explained in a scenario where the jet lies at a large angle relative to the disk of NGC 613. Alternatively, given the very short timescales associated with the outflow and the radio jet (∼104 yr; Audibert et al. 2019), we can speculate that the nascent jet will be able to inflate a cocoon of hot gas and eventually leave a more distinct imprint on the gas distribution in the future.
Furthermore, the trends discussed in Sect. 8.2 suggest the existence of a tentative decline of the tori-related parameters,  and
and  , with the increasing Eddington ratio and/or the AGN luminosity in the galaxies of our combined sample (Fig. 19). It is tempting to consider
  or
or  as proxies for the dust covering fraction (CF) of the torus, defined as the fraction of the sky that is blocked by dust, as seen from the central engine. Ricci et al. (2017b) recently found that the X-ray CF declines with the Eddington ratio based on a survey of 731 AGN in the local Universe (see also Ezhikode et al. 2017; Zhuang et al. 2018; Toba et al. 2019, 2021). In particular, Ricci et al. (2017b) found evidence of higher CF (∼85%) at Eddington ratios < 10−1.5 compared to those measured at Eddington ratios > 10−1.5 (∼40%). Although other works that use different proxies for the CF found no correlation with the Eddington ratio (e.g., Cao 2005; García-Bernete et al. 2019), the results of Ricci et al. (2017b) indicate that radiative feedback on dusty gas is a key mechanism able to regulate the internal distribution of material inside the torus and its surroundings. While the link between
  or
or  and CF is admittedly indirect, the tentative trends of Fig. 19 add supporting evidence to this scenario.
Overall, the trends discussed in Sect. 8.1 suggest that AGN feedback has significantly modified the radial distribution of the circumnuclear molecular gas preferentially in those sources characterized by having higher luminosities and higher Eddington ratios within our combined sample of NUGA and GATOS galaxies. This is reflected in the ∼1 dex monotonic decrease of index-I, sensitive to the scales of the tori and their immediate surroundings out to r ∼ 50 pc, but more clearly in the ∼2 dex decrease of index-II, tailored to capture the normalized concentration of molecular gas on torus scales. The differences between the nuclear and circumnuclear environments of NUGA and GATOS sources are illustrated by the cartoon shown in Fig. 20. The different degrees of nuclear-scale gas deficits illustrated by Fig. 18 allow us to distinguish the typical CND environment of sources like NGC 1068 from that observed in sources like NGC 5643, a representative case intermediate between the low luminosity NUGA and the highest luminosity GATOS targets. In agreement with the picture drawn from Fig. 20, González-Martín et al. (2019) found that the percentage of good fits to the infrared SED of active galaxies increases significantly for higher luminosity AGN when the two-component models of Hönig & Kishimoto (2017), which include both a clumpy disk and a polar clumpy wind, are confronted with observations. In contrast, one-component torus models, such as those of Nenkova et al. (2008a,b), provide better fits to the SED of lower luminosity AGN.
 |
Fig. 20. Cartoon illustrating the different nuclear and circumnuclear environments of the NUGA and GATOS sources analyzed in this paper. The figure is a (not to scale) simplified sketch of the CND around the SMBH of a Seyfert galaxy representative of the NUGA (left panel) and GATOS samples (middle and right panels). These samples are characterized by different Eddington ratios and AGN luminosities (NUGA: Eddington ratios∼10−6.5–10−3.5 and LAGN(2–10 keV) ∼ 1039.1 − 41.3 erg s−1; GATOS: Eddington ratios∼10−3.0–10−0.3 and LAGN(2–10 keV) ∼ 1041.4 − 43.5 erg s−1). Based on the monotonic trends of Fig. 18, we distinguish between the typical environment of the highest luminosity and highest Eddington ratio GATOS Seyferts (right panel, well represented by sources like NGC 1068, and an intermediate case between NUGA and the most extreme GATOS Seyferts (middle panel), well represented by sources like NGC 5643. The imprint left by AGN winds on the distribution of molecular gas in the torus and its surroundings through the launching of dusty winds, and by the impact of AGN winds on the ISM at larger radii (ISM in the figure), is seen to be more extreme in the higher luminosity and higher Eddington ratio sources. |
The search for molecular outflow signatures in our Seyfert galaxies was aimed at identifying unambiguous ‘smoking-gun’ evidence of AGN feedback. The properties of the sources where we have identified the existence of molecular outflows suggest that AGN feedback can be ‘caught in the act’ more frequently among the higher luminosity and /or higher Eddington ratio sources of the GATOS sample. AH21 show evidence of extended mid-IR polar emission likely associated with AGN-driven dusty outflows in some of the GATOS sources where we also find evidence of molecular outflows on larger scales. Modelers usually account for the mid-IR polar emission detected in Seyfert galaxies as due to a clumpy dusty wind launched ‘locally’ by radiation pressure from the inner region of the tori (Hönig & Kishimoto 2017). These dusty winds, which adopt a hollow cone geometry, can exist for a certain range of gas column densities and Eddington ratios (e.g., Venanzi et al. 2020, see also AH21). The efficiency of AGN feedback is maximized if the AGN wind and/or the radio jet is strongly coupled with the ISM of the host disk on large spatial scales, that is, only if the angular momentum of the accretion disk and the torus are decoupled from that of the disk. In this scenario AGN winds and/or jets can eventually intersect a large fraction of the disk. This favorable configuration can explain the launching of mostly coplanar massive molecular outflows across the wide range of spatial scales identified in the disks of NGC 1068, NGC 5643 or NGC 3227. Furthermore, this result is in agreement with the findings of Davies et al. (2014), who reported the detection of molecular outflows using the 1–0 S(1) H2 line in five nearby AGN; similarly, these outflows lie in a geometry configuration close to coplanar with the host galaxy disk.
9. Summary and outlook
We used ALMA to image the emission of molecular gas and dust using the CO(3–2) and HCO+(4–3) lines as well as their underlying continuum emission at 870 μm with a set of spatial resolutions (0.1″ ≃ 7 − 13 pc) in the circumnuclear disks of 10 nearby (D < 28 Mpc) Seyfert galaxies. The selected targets are part of the GATOS core sample, which was drawn from an ultra-hard X-ray survey. This is the first paper in a series aimed at understanding the properties of the dusty molecular tori and their connection to the host galaxy in nearby Seyferts. In Paper II of this series AH21 study the relation between the torus and polar dust emissions and compare them with predictions from radiative transfer disk+wind models. Our project expands the range of AGN luminosities and Eddington ratios covered by other ALMA surveys of Seyferts such as NUGA and allows us to study the gas feeding and feedback cycle in a combined sample of 19 Seyferts. The main results of this paper are summarized as follows:
-
ALMA detected 870 μm continuum emission stemming from spatially-resolved disks located around the AGN in all the galaxies of the GATOS core sample. We performed a morphology-wise decomposition to fit the continuum images with a set of point sources and extended components to minimize the contamination from free-free and synchrotron emission, which can contribute to the 870 μm emission on spatial scales unresolved by ALMA. After correction, the bulk of the continuum flux of the extended components can be accounted for by thermal emission from dust in all of our sources with the exception of NGC 7213. This result is confirmed by the spectral index maps of the submillimeter continuum emission obtained after correction in a subset of our targets.
-
Our data support that the orientation of the dusty disks relative to the AGN winds, which are present in the majority of our sources, shows a statistically significant preference. In particular, out of the 13 galaxies analyzed in our combined sample, a group of 9 galaxies tend to show an equatorial orientation of their extended components, that is, close to perpendicular relative to the AGN wind axes, as expected for a torus geometry for the dusty disks. A smaller subset of four galaxies display a mixed geometry intermediate between polar and equatorial.
-
Significant amounts of molecular gas are associated with the dusty disks, as confirmed by the detection of bright CO emission in all of our sources, with the exception of NGC 7213. In particular, while CO emission does not generally peak at the nuclei, the 3–2 line is detected coincident with the AGN in all the galaxies with the exception of NGC 6814 and NGC 7213. The range of CO fluxes measured in front of the AGN in our sources corresponds to a range of molecular gas column densities N(H2)∼8 × 10²¹ − 4 × 1023 cm−2.
-
The dusty molecular tori imaged by ALMA in the GATOS Seyferts have fullsizes (diameters) ranging from ∼25 pc to ∼130 pc, with a median value of ∼42 pc and molecular gas masses ranging from ≃5 × 10⁴ to 1 × 10⁷ M⊙, with a median value of ∼6 × 10⁵ M⊙. While the median value of the molecular tori in NUGA sources is virtually identical to that measured in GATOS, the distribution of masses of NUGA tori, from ≃2 × 10⁶ to 1 × 10⁷ M⊙, is skewed toward the highest values within our combined sample.
-
We detected the emission of the 4–3 line of HCO+, a tracer of dense molecular gas (n(H2) ≥ 105 − 106 cm−3) in four GATOS Seyferts. The HCO+ emission arises from spatially-resolved disks that show an excellent correspondence in their position, size and orientation with the CO and dusty disks identified in two sources: NGC 5643 and NGC 6300. We measure differences of up to an order of magnitude in the CO/HCO+ ratios within our combined sample of NUGA and GATOS: CO/HCO+ ∼ 2.8–38. This wide range of values point to a very different density radial stratification inside the dusty molecular tori in our sample galaxies.
-
We find a positive correlation between the line-of-sight gas column densities responsible for the absorption of X-rays and the molecular gas column densities derived from CO toward the AGN in our sources. Furthermore, the median values of the distributions of both column densities are similar. This suggests that the neutral gas line-of-sight column densities of the dusty molecular tori imaged by ALMA with ≃7 − 10 pc spatial resolution make a significant contribution to the obscuration of X-rays. We also find a positive correlation between the average gas surface densities of the dusty molecular tori and the gas column densities responsible for the reflection of hard X-rays. However the median values of these two column densities differ by more than an order of magnitude. This discrepancy could be accounted for if the bulk of the neutral gas producing the reflection of X-rays is located at the inner walls of the tori.
-
We analyzed the normalized radial distributions of molecular gas in the CND of our Seyfert galaxies to look for signs of nuclear-scale molecular gas deficits. We find that the imprint of AGN feedback is seen to be more extreme in higher luminosity and/or higher Eddington ratio sources, as captured by the nuclear gas deficit trends and the scaling laws of the dusty molecular tori found in this work. We find clear evidence of molecular outflows in the sources that show the most extreme nuclear-scale gas deficits in our sample. This suggests that AGN feedback can be ‘caught in the act’ more frequently among the higher luminosity and/or higher Eddington ratio sources of the GATOS sample. In agreement with this picture, AH21 find extended mid-IR polar emission likely associated with AGN-driven dusty outflows launched from the tori in the five GATOS sources where we detect large-scale molecular outflows and the most extreme nuclear-scale gas deficits.
It is tempting to claim the existence of an evolutionary link connecting the Seyferts along the sequence depicted in Fig. 20. In this idealized scenario, a nascent AGN would start its activity cycle as a low-luminosity galaxy akin to a NUGA source. At this stage the galaxy would have a massive dusty molecular torus, which could have been assembled following an AGN fueling episode. During the growing phase of the activity cycle, a wide-angle ionized wind launched from the accretion disk could impact a sizeable fraction of gas ‘locally’ in the torus and its immediate surroundings (∼1–to-tens of pc). These ‘local’ dusty outflows could help regulate the fueling of the central engine and the growth of the dusty molecular torus. If the geometry helps AGN winds and/or radio jets to be strongly coupled with the ISM of the host disk, molecular outflows can propagate in the disk and clear the gas on CND scales (∼hundreds of pc) as the galaxy reaches its maximum level of nuclear activity (modulo the travel time). AGN fueling would be therefore thwarted on nuclear scales during the phase of peak activity. The gas reservoir in the torus would be eventually exhausted, and as a consequence, both the AGN luminosity and the impact of AGN feedback would be reduced. This cycle could be restarted after the completion of another AGN fueling phase.
The misalignment between the inner molecular torus and the large-scale disk can help enhance the impact of AGN feedback on the ISM. Several mechanisms have been described in the literature to explain the origin of this misalignment as well as the lifetime and recurrence of this particular configuration in active galaxies (e.g., see Combes 2021, and references therein). However, it is still unclear if the orientation of the accretion disks and molecular tori is more easily ‘randomized’ relative to that of the large-scale disks during the low activity phase or if these processes are expected to be at work throughout the entire activity cycle.
Furthermore, the evolutionary scenario described in Sect. 8.3 needs to be confirmed by adding high-resolution ALMA observations of a sample of active galaxies that could significantly expand the range of AGN luminosities and/or Eddington ratios covered by the present work. We might foresee finding a more dramatic imprint of AGN feedback in higher luminosity objects. Similarly, high-resolution ALMA observations of a comparison sample of non-AGN galaxies, properly matched in mass and Hubble type with our current sample, would be a key to validating this picture.
Hereafter we use the term dusty molecular “torus” to denote the compact disk detected both in dust continuum and molecular line emission around the central engine, and which tends to show an equatorial geometry relative to the AGN wind/jet axis. The detailed internal morphology of this dusty molecular disk feature has nevertheless yet to be determined.
A similar conclusion is drawn from an inspection of the 870 μm continuum images obtained from the ALMA HSR dataset.
For NGC 7314 we used data of the F450W filter to replace the F160W filter, which is not available.
Hereafter the ranges in Mgas and N(H2) span the values derived from the MSR and HSR datasets.
Lower limits on the CO/HCO+ ratios obtained in NGC 4388 and NGC 4941, ≥2.3 − 4.4, are less statistically significant. In NGC 7213 and NGC 6814, the CO line is either not detected (NGC 7213) or barely detected at a ≃3σ level (NGC 6814).
See Sect. 7.2 for an alternative estimate of the X-ray reflected component in our sources using data from the X-ray satellite NuSTAR.
CO images were deprojected using values of PA and i derived in the kinematic fit of Appendix D or taken from LEDA for the NUGA galaxies.
These estimates are in line with those typically assumed in the literature: ∼ ± 0.23 dex (e.g., Genzel et al. 2010).
MSR and HSR datasets give virtually identical values for  except for the two upper limit estimates in NGC 6814 and NGC 7213 where we adopt the more compelling value derived from the MSR dataset.
The outflows of NGC 5643, NGC 3227, and NGC 1068 have already been amply studied in previous works referred to in Sect. 8.
Acknowledgments
This paper makes use of the following ALMA data: ADS/JAO.ALMA#2017.1.00082.S, #2018.1.00113.S, and #2016.1.00254.S. ALMA is a partnership of ESO (representing its member states), NSF (USA), and NINS (Japan), together with NRC (Canada) and NSC and ASIAA (Taiwan), in cooperation with the Republic of Chile. The Joint ALMA Observatory is operated by ESO, AUI/NRAO, and NAOJ. The National Radio Astronomy Observatory is a facility of the National Science Foundation operated under cooperative agreement by Associated Universities, Inc. We used observations made with the NASA/ESA Hubble Space Telescope, and obtained from the Hubble Legacy Archive, which is a collaboration between the Space Telescope Science Institute (STScI/NASA), the Space Telescope European Coordinating Facility (ST-ECF/ESA), and the Canadian Astronomy Data center (CADC/NRC/CSA). SGB and MQ acknowledge support from the research project PID2019-106027GA-C44 of the Spanish Ministerio de Ciencia e Innovación. SGB and CRA acknowledge support from the Spanish MINECO and FEDER funding grant AYA2016-76682-C3-2-P. CRA acknowledges the Ramón y Cajal Program of the Spanish Ministry of Economy and Competitiveness through project RYC-2014-15779, from the European Union’s Horizon 2020 research and innovation programme under Marie Skłodowska-Curie grant agreement No 860744 (BiD4BESt), from the State Research Agency (AEI-MCINN) of the Spanish MCIU under grants “Feeding and feedback in active galaxies” with reference PID2019-106027GB-C42, and “Quantifying the impact of quasar feedback on galaxy evolution (QSOFEED)” with reference EUR2020-112266 AAH, SGB, and AU acknowledge support through grant PGC2018-094671-B-I00 (MCIU/AEI/FEDER,UE). AAH’s work was done under project No. MDM-2017-0737 Unidad de Excelencia “María de Maeztu”– Centro de Astrobiología (INTA-CSIC). SFH acknowledges support by the EU Horizon 2020 framework programme via the ERC Starting Grant DUST-IN-THE-WIND (ERC-2015-StG-677117). AB acknowledges support from a Royal Society International Exchange Grant. BG-L acknowledges support from the Spanish Agencia Estatal de Investigación del Ministerio de Ciencia e Innovación (AEI-MCINN) under grant with reference PID2019-107010GB-I00. AB has received funding from the European Research Council (ERC) under the European Union’s Horizon 2020 Advanced Grant 789056 “First Galaxies”. CR acknowledges support from the Fondecyt Iniciación grant 11190831. IGB acknowledges support from STFC through grant ST/S000488/1. AL acknowledges the support from Comunidad de Madrid through the Atracción de Talento Investigador Grant 2017-T1/TIC-5213, and PID2019-106280GB-I00 (MCIU/AEI/FEDER,UE). MPS acknowledges support from the Comunidad de Madrid through the Atracción de Talento Investigador Grant 2018-T1/TIC-11035 and PID2019-105423GA-I00 (MCIU/AEI/FEDER,UE). PB acknowledges financial support from the Czech Science Foundation project No. 19-05599Y. The authors thank G. Pérez Díaz (SMM, IAC) for his help in designing Fig. 20.
References
- Aalto, S., Muller, S., Costagliola, F., et al. 2017, A&A, 608, A22 [NASA ADS] [CrossRef] [EDP Sciences] [Google Scholar]
- Aalto, S., Muller, S., König, S., et al. 2019, A&A, 627, A147 [NASA ADS] [CrossRef] [EDP Sciences] [Google Scholar]
- Aalto, S., Falstad, N., Muller, S., et al. 2020, A&A, 640, A104 [EDP Sciences] [Google Scholar]
- Alonso-Herrero, A., Ramos Almeida, C., Mason, R., et al. 2011, ApJ, 736, 82 [Google Scholar]
- Alonso-Herrero, A., Pereira-Santaella, M., García-Burillo, S., et al. 2018, ApJ, 859, 144 [Google Scholar]
- Alonso-Herrero, A., García-Burillo, S., Pereira-Santaella, M., et al. 2019, A&A, 628, A65 [NASA ADS] [CrossRef] [EDP Sciences] [Google Scholar]
- Alonso-Herrero, A., Pereira-Santaella, M., Rigopoulou, D., et al. 2020, A&A, 639, A43 [NASA ADS] [CrossRef] [EDP Sciences] [Google Scholar]
- Alonso-Herrero, A., García-Burillo, S., Hönig, S., et al. 2021, A&A, 652, A99 [NASA ADS] [CrossRef] [EDP Sciences] [Google Scholar]
- Annuar, A., Gandhi, P., Alexander, D. M., et al. 2015, ApJ, 815, 36 [NASA ADS] [CrossRef] [Google Scholar]
- Antonucci, R. 1993, ARA&A, 31, 473 [Google Scholar]
- Antonucci, R. R. J., & Miller, J. S. 1985, ApJ, 297, 621 [Google Scholar]
- Asmus, D. 2019, MNRAS, 489, 2177 [CrossRef] [Google Scholar]
- Asmus, D., Gandhi, P., Hönig, S. F., Smette, A., & Duschl, W. J. 2015, MNRAS, 454, 766 [NASA ADS] [CrossRef] [Google Scholar]
- Asmus, D., Hönig, S. F., & Gandhi, P. 2016, ApJ, 822, 109 [NASA ADS] [CrossRef] [Google Scholar]
- Audibert, A., Combes, F., García-Burillo, S., et al. 2019, A&A, 632, A33 [NASA ADS] [CrossRef] [EDP Sciences] [Google Scholar]
- Audibert, A., Combes, F., García-Burillo, S., et al. 2020, A&A, submitted [arXiv:2011.09133] [Google Scholar]
- Baloković, M., Brightman, M., Harrison, F. A., et al. 2018, ApJ, 854, 42 [Google Scholar]
- Barbosa, F. K. B., Storchi-Bergmann, T., Cid Fernandes, R., Winge, C., & Schmitt, H. 2009, MNRAS, 396, 2 [NASA ADS] [CrossRef] [Google Scholar]
- Barbosa, F. K. B., Storchi-Bergmann, T., McGregor, P., Vale, T. B., & Rogemar Riffel, A. 2014, MNRAS, 445, 2353 [NASA ADS] [CrossRef] [Google Scholar]
- Bauer, F. E., Arévalo, P., Walton, D. J., et al. 2015, ApJ, 812, 116 [NASA ADS] [CrossRef] [Google Scholar]
- Baumgartner, W. H., Tueller, J., Markwardt, C. B., et al. 2013, ApJS, 207, 19 [Google Scholar]
- Bianchi, S., Chiaberge, M., Piconcelli, E., & Guainazzi, M. 2007, MNRAS, 374, 697 [NASA ADS] [CrossRef] [Google Scholar]
- Bianchi, S., Piconcelli, E., Chiaberge, M., et al. 2009, ApJ, 695, 781 [NASA ADS] [CrossRef] [Google Scholar]
- Bianchi, S., Maiolino, R., & Risaliti, G. 2012, Adv. Astron., 2012, 782030 [NASA ADS] [CrossRef] [Google Scholar]
- Blank, D. L., Harnett, J. I., & Jones, P. A. 2005, MNRAS, 356, 734 [CrossRef] [Google Scholar]
- Bolatto, A. D., Wolfire, M., & Leroy, A. K. 2013, ARA&A, 51, 207 [Google Scholar]
- Braito, V., Reeves, J. N., Bianchi, S., Nardini, E., & Piconcelli, E. 2017, A&A, 600, A135 [EDP Sciences] [Google Scholar]
- Bransford, M. A., Appleton, P. N., Heisler, C. A., Norris, R. P., & Marston, A. P. 1998, ApJ, 497, 133 [NASA ADS] [CrossRef] [Google Scholar]
- Brightman, M., & Nandra, K. 2011, MNRAS, 413, 1206 [CrossRef] [Google Scholar]
- Burtscher, L., Meisenheimer, K., Tristram, K. R. W., et al. 2013, A&A, 558, A149 [NASA ADS] [CrossRef] [EDP Sciences] [Google Scholar]
- Buta, R. J., Knapen, J. H., Elmegreen, B. G., et al. 2009, AJ, 137, 4487 [NASA ADS] [CrossRef] [Google Scholar]
- Cao, X. 2005, ApJ, 619, 86 [NASA ADS] [CrossRef] [Google Scholar]
- Chan, C.-H., & Krolik, J. H. 2016, ApJ, 825, 67 [NASA ADS] [CrossRef] [Google Scholar]
- Chan, C.-H., & Krolik, J. H. 2017, ApJ, 843, 58 [NASA ADS] [CrossRef] [Google Scholar]
- Colbert, E. J. M., Baum, S. A., Gallimore, J. F., O’Dea, C. P., & Christensen, J. A. 1996, ApJ, 467, 551 [NASA ADS] [CrossRef] [Google Scholar]
- Combes, F. 2021, IAU Symp., 359, 312 [NASA ADS] [Google Scholar]
- Combes, F., García-Burillo, S., Audibert, A., et al. 2019, A&A, 623, A79 [NASA ADS] [CrossRef] [EDP Sciences] [Google Scholar]
- Cresci, G., Marconi, A., Zibetti, S., et al. 2015, A&A, 582, A63 [NASA ADS] [CrossRef] [EDP Sciences] [Google Scholar]
- Das, V., Crenshaw, D. M., Kraemer, S. B., & Deo, R. P. 2006, AJ, 132, 620 [Google Scholar]
- Davies, R. I., Maciejewski, W., Hicks, E. K. S., et al. 2014, ApJ, 792, 101 [NASA ADS] [CrossRef] [Google Scholar]
- Davies, R. L., Dopita, M. A., Kewley, L., et al. 2016, ApJ, 824, 50 [NASA ADS] [CrossRef] [Google Scholar]
- Devereux, N., Taniguchi, Y., Sanders, D. B., Nakai, N., & Young, J. S. 1994, AJ, 107, 2006 [NASA ADS] [CrossRef] [Google Scholar]
- De Vis, P., Jones, A., Viaene, S., et al. 2019, A&A, 623, A5 [NASA ADS] [CrossRef] [EDP Sciences] [Google Scholar]
- Domínguez-Fernández, A. J., Alonso-Herrero, A., García-Burillo, S., et al. 2020, A&A, 643, A127 [CrossRef] [EDP Sciences] [Google Scholar]
- Draine, B. T., Dale, D. A., Bendo, G., et al. 2007, ApJ, 663, 866 [Google Scholar]
- Ebrero, J., Costantini, E., Kaastra, J. S., de Marco, B., & Dadina, M. 2011, A&A, 535, A62 [NASA ADS] [CrossRef] [EDP Sciences] [Google Scholar]
- Efstathiou, A., & Rowan-Robinson, M. 1995, MNRAS, 273, 649 [NASA ADS] [CrossRef] [Google Scholar]
- Efstathiou, A., Hough, J. H., & Young, S. 1995, MNRAS, 277, 1134 [Google Scholar]
- Elitzur, M. 2012, ApJ, 747, L33 [NASA ADS] [CrossRef] [Google Scholar]
- Elitzur, M., & Shlosman, I. 2006, ApJ, 648, L101 [NASA ADS] [CrossRef] [Google Scholar]
- Emmanoulopoulos, D., McHardy, I. M., Vaughan, S., & Papadakis, I. E. 2016, MNRAS, 460, 2413 [NASA ADS] [CrossRef] [Google Scholar]
- Emmering, R. T., Blandford, R. D., & Shlosman, I. 1992, ApJ, 385, 460 [NASA ADS] [CrossRef] [Google Scholar]
- Erroz-Ferrer, S., Carollo, C. M., den Brok, M., et al. 2019, MNRAS, 484, 5009 [NASA ADS] [CrossRef] [Google Scholar]
- Esparza-Arredondo, D., González-Martín, O., Dultzin, D., et al. 2019, ApJ, 886, 125 [Google Scholar]
- Esparza-Arredondo, D., González Martín, O., Dultzin, D., et al. 2021, A&A, 651, A91 [NASA ADS] [CrossRef] [EDP Sciences] [Google Scholar]
- Ezhikode, S. H., Gandhi, P., Done, C., et al. 2017, MNRAS, 472, 3492 [NASA ADS] [CrossRef] [Google Scholar]
- Fabbiano, G., Elvis, M., Paggi, A., et al. 2017, ApJ, 842, L4 [NASA ADS] [CrossRef] [Google Scholar]
- Fabbiano, G., Paggi, A., Siemiginowska, A., & Elvis, M. 2018, ApJ, 869, L36 [NASA ADS] [CrossRef] [Google Scholar]
- Falcke, H., Wilson, A. S., & Simpson, C. 1998, ApJ, 502, 199 [CrossRef] [Google Scholar]
- Ferruit, P., Wilson, A. S., & Mulchaey, J. 2000, ApJS, 128, 139 [NASA ADS] [CrossRef] [Google Scholar]
- Fischer, T. C., Crenshaw, D. M., Kraemer, S. B., & Schmitt, H. R. 2013, ApJS, 209, 1 [NASA ADS] [CrossRef] [Google Scholar]
- Fluetsch, A., Maiolino, R., Carniani, S., et al. 2019, MNRAS, 483, 4586 [NASA ADS] [Google Scholar]
- Fuller, L., Lopez-Rodriguez, E., Packham, C., et al. 2019, MNRAS, 483, 3404 [NASA ADS] [CrossRef] [Google Scholar]
- Gaia Collaboration (Brown, A. G. A., et al.) 2018, A&A, 616, A1 [NASA ADS] [CrossRef] [EDP Sciences] [Google Scholar]
- Galametz, M., Madden, S. C., Galliano, F., et al. 2011, A&A, 532, A56 [NASA ADS] [CrossRef] [EDP Sciences] [Google Scholar]
- Gallagher, S. C., Everett, J. E., Abado, M. M., & Keating, S. K. 2015, MNRAS, 451, 2991 [NASA ADS] [CrossRef] [Google Scholar]
- Galliano, E., Pantin, E., Alloin, D., & Lagage, P. O. 2005, MNRAS, 363, L1 [NASA ADS] [CrossRef] [Google Scholar]
- Gallimore, J. F., Baum, S. A., O’Dea, C. P., & Pedlar, A. 1996, ApJ, 458, 136 [NASA ADS] [CrossRef] [Google Scholar]
- Gallimore, J. F., Baum, S. A., & O’Dea, C. P. 2004, ApJ, 613, 794 [Google Scholar]
- Gallimore, J. F., Elitzur, M., Maiolino, R., et al. 2016, ApJ, 829, L7 [NASA ADS] [CrossRef] [Google Scholar]
- Gandhi, P., Horst, H., Smette, A., et al. 2009, A&A, 502, 457 [NASA ADS] [CrossRef] [EDP Sciences] [Google Scholar]
- Gandhi, P., Hönig, S. F., & Kishimoto, M. 2015, ApJ, 812, 113 [NASA ADS] [CrossRef] [Google Scholar]
- García-Bernete, I., Ramos Almeida, C., Acosta-Pulido, J. A., et al. 2016, MNRAS, 463, 3531 [NASA ADS] [CrossRef] [Google Scholar]
- García-Bernete, I., Ramos Almeida, C., Alonso-Herrero, A., et al. 2019, MNRAS, 486, 4917 [Google Scholar]
- García-Bernete, I., Alonso-Herrero, A., García-Burillo, S., et al. 2021, A&A, 645, A21 [EDP Sciences] [Google Scholar]
- García-Burillo, S., & Combes, F. 2012, J. Phys. Conf. Ser., 372, 012050zz [NASA ADS] [CrossRef] [Google Scholar]
- García-Burillo, S., Combes, F., Usero, A., et al. 2014, A&A, 567, A125 [NASA ADS] [CrossRef] [EDP Sciences] [Google Scholar]
- García-Burillo, S., Combes, F., Ramos Almeida, C., et al. 2016, ApJ, 823, L12 [NASA ADS] [CrossRef] [Google Scholar]
- García-Burillo, S., Combes, F., Ramos Almeida, C., et al. 2019, A&A, 632, A61 [CrossRef] [EDP Sciences] [Google Scholar]
- Gaspar, G., Díaz, R. J., Mast, D., et al. 2019, AJ, 157, 44 [Google Scholar]
- Genzel, R., Tacconi, L. J., Gracia-Carpio, J., et al. 2010, MNRAS, 407, 2091 [Google Scholar]
- González-Martín, O., Masegosa, J., García-Bernete, I., et al. 2019, ApJ, 884, 11 [Google Scholar]
- Granato, G. L., & Danese, L. 1994, MNRAS, 268, 235 [Google Scholar]
- Gravity Collaboration (Pfuhl, O., et al.) 2020, A&A, 634, A1 [NASA ADS] [CrossRef] [EDP Sciences] [Google Scholar]
- Greene, J. E., Seth, A., Lyubenova, M., et al. 2014, ApJ, 788, 145 [NASA ADS] [CrossRef] [Google Scholar]
- Guainazzi, M., Rodriguez-Pascual, P., Fabian, A. C., Iwasawa, K., & Matt, G. 2004, MNRAS, 355, 297 [NASA ADS] [CrossRef] [Google Scholar]
- Harrison, F. A., Craig, W. W., Christensen, F. E., et al. 2013, ApJ, 770, 103 [Google Scholar]
- Hicks, E. K. S., Davies, R. I., Malkan, M. A., et al. 2009, ApJ, 696, 448 [NASA ADS] [CrossRef] [Google Scholar]
- Hönig, S. F. 2019, ApJ, 884, 171 [NASA ADS] [CrossRef] [Google Scholar]
- Hönig, S. F., & Kishimoto, M. 2017, ApJ, 838, L20 [NASA ADS] [CrossRef] [Google Scholar]
- Hönig, S. F., Prieto, M. A., & Beckert, T. 2008, A&A, 485, 33 [NASA ADS] [CrossRef] [EDP Sciences] [Google Scholar]
- Hönig, S. F., Kishimoto, M., Antonucci, R., et al. 2012, ApJ, 755, 149 [NASA ADS] [CrossRef] [Google Scholar]
- Hönig, S. F., Kishimoto, M., Tristram, K. R. W., et al. 2013, ApJ, 771, 87 [NASA ADS] [CrossRef] [Google Scholar]
- Hughes, M. A., Alonso-Herrero, A., Axon, D., et al. 2003, AJ, 126, 742 [NASA ADS] [CrossRef] [Google Scholar]
- Hummel, E., & Saikia, D. J. 1991, A&A, 249, 43 [NASA ADS] [Google Scholar]
- Imanishi, M., & Nakanishi, K. 2013, AJ, 146, 91 [NASA ADS] [CrossRef] [Google Scholar]
- Imanishi, M., & Nakanishi, K. 2014, AJ, 148, 9 [NASA ADS] [CrossRef] [Google Scholar]
- Imanishi, M., Nakanishi, K., Izumi, T., & Wada, K. 2018, ApJ, 853, L25 [Google Scholar]
- Imanishi, M., Nguyen, D. D., Wada, K., et al. 2020, ApJ, 902, 99 [Google Scholar]
- Impellizzeri, C. M. V., Gallimore, J. F., Baum, S. A., et al. 2019, ApJ, 884, L28 [Google Scholar]
- Iono, D., Saito, T., Yun, M. S., et al. 2013, PASJ, 65, L7 [NASA ADS] [CrossRef] [Google Scholar]
- Izumi, T., Kohno, K., Aalto, S., et al. 2015, ApJ, 811, 39 [NASA ADS] [CrossRef] [Google Scholar]
- Izumi, T., Kawakatu, N., & Kohno, K. 2016a, ApJ, 827, 81 [NASA ADS] [CrossRef] [Google Scholar]
- Izumi, T., Kohno, K., Aalto, S., et al. 2016b, ApJ, 818, 42 [NASA ADS] [CrossRef] [Google Scholar]
- Izumi, T., Wada, K., Fukushige, R., Hamamura, S., & Kohno, K. 2018, ApJ, 867, 48 [Google Scholar]
- Jana, A., Chatterjee, A., Kumari, N., et al. 2020, MNRAS, 499, 5396 [NASA ADS] [CrossRef] [Google Scholar]
- Jungwiert, B., Combes, F., & Axon, D. J. 1997, A&A, 125, 479 [Google Scholar]
- Kawakatu, N., Saitoh, T. R., & Wada, K. 2005, ApJ, 628, 129 [NASA ADS] [CrossRef] [Google Scholar]
- Klaas, U., Haas, M., Müller, S. A. H., et al. 2001, A&A, 379, 823 [NASA ADS] [CrossRef] [EDP Sciences] [Google Scholar]
- Koss, M., Trakhtenbrot, B., Ricci, C., et al. 2017, ApJ, 850, 74 [Google Scholar]
- Koss, M. J., Strittmatter, B., Lamperti, I., et al. 2021, ApJS, 252, 29 [CrossRef] [Google Scholar]
- Krajnović, D., Cappellari, M., de Zeeuw, P. T., & Copin, Y. 2006, MNRAS, 366, 787 [NASA ADS] [CrossRef] [Google Scholar]
- Krajnović, D., Emsellem, E., Cappellari, M., et al. 2011, MNRAS, 414, 2923 [NASA ADS] [CrossRef] [Google Scholar]
- Krips, M., Martín, S., Eckart, A., et al. 2011, ApJ, 736, 37 [NASA ADS] [CrossRef] [Google Scholar]
- Krolik, J. H. 2007, ApJ, 661, 52 [NASA ADS] [CrossRef] [Google Scholar]
- Krolik, J. H., & Begelman, M. C. 1988, ApJ, 329, 702 [Google Scholar]
- Kudoh, Y., Wada, K., & Norman, C. 2020, ApJ, 904, 9 [NASA ADS] [CrossRef] [Google Scholar]
- Leipski, C., Falcke, H., Bennert, N., & Hüttemeister, S. 2006, A&A, 455, 161 [NASA ADS] [CrossRef] [EDP Sciences] [Google Scholar]
- Levenson, N. A., Radomski, J. T., Packham, C., et al. 2009, ApJ, 703, 390 [NASA ADS] [CrossRef] [Google Scholar]
- Liu, Y., & Li, X. 2015, MNRAS, 448, L53 [NASA ADS] [CrossRef] [Google Scholar]
- López-Gonzaga, N., Jaffe, W., Burtscher, L., Tristram, K. R. W., & Meisenheimer, K. 2014, A&A, 565, A71 [NASA ADS] [CrossRef] [EDP Sciences] [Google Scholar]
- López-Gonzaga, N., Burtscher, L., Tristram, K. R. W., Meisenheimer, K., & Schartmann, M. 2016, A&A, 591, A47 [NASA ADS] [CrossRef] [EDP Sciences] [Google Scholar]
- Lopez-Rodriguez, E., Alonso-Herrero, A., García-Burillo, S., et al. 2020, ApJ, 893, 33 [Google Scholar]
- Lutz, D., Sturm, E., Janssen, A., et al. 2020, A&A, 633, A134 [NASA ADS] [CrossRef] [EDP Sciences] [Google Scholar]
- Magdziarz, P., & Zdziarski, A. A. 1995, MNRAS, 273, 837 [NASA ADS] [CrossRef] [Google Scholar]
- Maiolino, R., Marconi, A., Salvati, M., et al. 2001, A&A, 365, 28 [NASA ADS] [CrossRef] [EDP Sciences] [Google Scholar]
- Mao, R.-Q., Schulz, A., Henkel, C., et al. 2010, ApJ, 724, 1336 [NASA ADS] [CrossRef] [Google Scholar]
- Marinucci, A., Bianchi, S., Fabbiano, G., et al. 2017, MNRAS, 470, 4039 [CrossRef] [Google Scholar]
- Markowitz, A. G., Krumpe, M., & Nikutta, R. 2014, MNRAS, 439, 1403 [NASA ADS] [CrossRef] [Google Scholar]
- Márquez, I., Durret, F., González Delgado, R. M., et al. 1999, A&A, 140, 1 [Google Scholar]
- Márquez, I., Masegosa, J., Durret, F., et al. 2003, A&A, 409, 459 [NASA ADS] [CrossRef] [EDP Sciences] [Google Scholar]
- Martín, S., Aalto, S., Sakamoto, K., et al. 2016, A&A, 590, A25 [NASA ADS] [CrossRef] [EDP Sciences] [Google Scholar]
- Martini, P., Regan, M. W., Mulchaey, J. S., & Pogge, R. W. 2003, ApJS, 146, 353 [NASA ADS] [CrossRef] [Google Scholar]
- Mateos, S., Carrera, F. J., Alonso-Herrero, A., et al. 2016, ApJ, 819, 166 [Google Scholar]
- Mauersberger, R., Henkel, C., Walsh, W., & Schulz, A. 1999, A&A, 341, 256 [NASA ADS] [Google Scholar]
- May, D., & Steiner, J. E. 2017, MNRAS, 469, 994 [NASA ADS] [CrossRef] [Google Scholar]
- McMullin, J. P., Waters, B., Schiebel, D., Young, W., & Golap, K. 2007, in Astronomical Data Analysis Software and Systems XVI, eds. R. A. Shaw, F. Hill, & D. J. Bell, ASP Conf. Ser., 376, 127 [Google Scholar]
- Miller, J. M., Kammoun, E., Ludlam, R. M., et al. 2019, ApJ, 884, 106 [CrossRef] [Google Scholar]
- Minezaki, T., & Matsushita, K. 2015, ApJ, 802, 98 [NASA ADS] [CrossRef] [Google Scholar]
- Mingozzi, M., Cresci, G., Venturi, G., et al. 2019, A&A, 622, A146 [NASA ADS] [CrossRef] [EDP Sciences] [Google Scholar]
- Monje, R. R., Blain, A. W., & Phillips, T. G. 2011, ApJS, 195, 23 [NASA ADS] [CrossRef] [Google Scholar]
- Morganti, R., Oosterloo, T., Oonk, J. B. R., Frieswijk, W., & Tadhunter, C. 2015, A&A, 580, A1 [NASA ADS] [CrossRef] [EDP Sciences] [Google Scholar]
- Morris, S., Ward, M., Whittle, M., Wilson, A. S., & Taylor, K. 1985, MNRAS, 216, 193 [NASA ADS] [CrossRef] [Google Scholar]
- Mukai, K., Hellier, C., Madejski, G., Patterson, J., & Skillman, D. R. 2003, ApJ, 597, 479 [NASA ADS] [CrossRef] [Google Scholar]
- Mulchaey, J. S., Regan, M. W., & Kundu, A. 1997, ApJS, 110, 299 [NASA ADS] [CrossRef] [Google Scholar]
- Müller Sánchez, F., Davies, R. I., Genzel, R., et al. 2009, ApJ, 691, 749 [NASA ADS] [CrossRef] [Google Scholar]
- Müller-Sánchez, F., Prieto, M. A., Hicks, E. K. S., et al. 2011, ApJ, 739, 69 [Google Scholar]
- Mundell, C. G., Wilson, A. S., Ulvestad, J. S., & Roy, A. L. 2000, ApJ, 529, 816 [NASA ADS] [CrossRef] [Google Scholar]
- Murphy, T., Sadler, E. M., Ekers, R. D., et al. 2010, MNRAS, 402, 2403 [Google Scholar]
- Nagar, N. M., Wilson, A. S., Mulchaey, J. S., & Gallimore, J. F. 1999, ApJS, 120, 209 [NASA ADS] [CrossRef] [Google Scholar]
- Nenkova, M., Ivezić, Ž., & Elitzur, M. 2002, ApJ, 570, L9 [Google Scholar]
- Nenkova, M., Sirocky, M. M., Ivezić, Ž., & Elitzur, M. 2008a, ApJ, 685, 147 [NASA ADS] [CrossRef] [Google Scholar]
- Nenkova, M., Sirocky, M. M., Nikutta, R., Ivezić, Ž., & Elitzur, M. 2008b, ApJ, 685, 160 [NASA ADS] [CrossRef] [Google Scholar]
- Netzer, H. 2015, ARA&A, 53, 365 [Google Scholar]
- Nyland, K., Young, L. M., Wrobel, J. M., et al. 2016, MNRAS, 458, 2221 [NASA ADS] [CrossRef] [Google Scholar]
- Ogawa, S., Ueda, Y., Tanimoto, A., & Yamada, S. 2021, ApJ, 906, 84 [Google Scholar]
- Orienti, M., & Prieto, M. A. 2010, MNRAS, 401, 2599 [NASA ADS] [CrossRef] [Google Scholar]
- Osterbrock, D. E. 1981, ApJ, 249, 462 [Google Scholar]
- Packham, C., Radomski, J. T., Roche, P. F., et al. 2005, ApJ, 618, L17 [NASA ADS] [CrossRef] [Google Scholar]
- Pasetto, A., González-Martín, O., Esparza-Arredondo, D., et al. 2019, ApJ, 872, 69 [Google Scholar]
- Pier, E. A., & Krolik, J. H. 1992, ApJ, 401, 99 [Google Scholar]
- Pier, E. A., & Krolik, J. H. 1993, ApJ, 418, 673 [NASA ADS] [CrossRef] [Google Scholar]
- Quillen, A. C., Kuchinski, L. E., Frogel, J. A., & DePoy, D. L. 1997, ApJ, 481, 179 [NASA ADS] [CrossRef] [Google Scholar]
- Radomski, J. T., Piña, R. K., Packham, C., et al. 2003, ApJ, 587, 117 [NASA ADS] [CrossRef] [Google Scholar]
- Ramakrishnan, V., Nagar, N. M., Finlez, C., et al. 2019, MNRAS, 487, 444 [NASA ADS] [CrossRef] [Google Scholar]
- Ramos Almeida, C., & Ricci, C. 2017, Nat. Astron., 1, 679 [Google Scholar]
- Ramos Almeida, C., Levenson, N. A., Rodríguez Espinosa, J. M., et al. 2009a, ApJ, 702, 1127 [NASA ADS] [CrossRef] [Google Scholar]
- Ramos Almeida, C., Pérez García, A. M., & Acosta-Pulido, J. A. 2009b, ApJ, 694, 1379 [NASA ADS] [CrossRef] [Google Scholar]
- Ramos Almeida, C., Levenson, N. A., Alonso-Herrero, A., et al. 2011, ApJ, 731, 92 [Google Scholar]
- Ramos Almeida, C., Martínez González, M. J., Asensio Ramos, A., et al. 2016, MNRAS, 461, 1387 [NASA ADS] [CrossRef] [Google Scholar]
- Ricci, C., Ueda, Y., Koss, M. J., et al. 2015, ApJ, 815, L13 [NASA ADS] [CrossRef] [Google Scholar]
- Ricci, C., Trakhtenbrot, B., Koss, M. J., et al. 2017a, ApJS, 233, 17 [NASA ADS] [CrossRef] [Google Scholar]
- Ricci, C., Trakhtenbrot, B., Koss, M. J., et al. 2017b, Nature, 549, 488 [NASA ADS] [CrossRef] [Google Scholar]
- Ricci, C., Ho, L. C., Fabian, A. C., et al. 2018a, MNRAS, 480, 1819 [NASA ADS] [CrossRef] [Google Scholar]
- Ricci, T. V., Steiner, J. E., May, D., Garcia-Rissmann, A., & Menezes, R. B. 2018b, MNRAS, 473, 5334 [CrossRef] [Google Scholar]
- Riffel, R. A., Storchi-Bergmann, T., Dors, O. L., & Winge, C. 2009, MNRAS, 393, 783 [NASA ADS] [CrossRef] [Google Scholar]
- Risaliti, G., Elvis, M., & Nicastro, F. 2002, ApJ, 571, 234 [NASA ADS] [CrossRef] [Google Scholar]
- Rivers, E., Baloković, M., Arévalo, P., et al. 2015, ApJ, 815, 55 [NASA ADS] [CrossRef] [Google Scholar]
- Roche, P. F., Packham, C., Telesco, C. M., et al. 2006, MNRAS, 367, 1689 [NASA ADS] [CrossRef] [Google Scholar]
- Rodríguez-Ardila, A., Mason, R. E., Martins, L., et al. 2017, MNRAS, 465, 906 [Google Scholar]
- Rosario, D. J., Burtscher, L., Davies, R. I., et al. 2018, MNRAS, 473, 5658 [NASA ADS] [CrossRef] [Google Scholar]
- Rosario, D. J., Togi, A., Burtscher, L., et al. 2019, ApJ, 875, L8 [NASA ADS] [CrossRef] [Google Scholar]
- Ruschel-Dutra, D., Pastoriza, M., Riffel, R., Sales, D. A., & Winge, C. 2014, MNRAS, 438, 3434 [NASA ADS] [CrossRef] [Google Scholar]
- Salak, D., Tomiyasu, Y., Nakai, N., et al. 2018, ApJ, 856, 97 [NASA ADS] [CrossRef] [Google Scholar]
- Salvestrini, F., Gruppioni, C., Pozzi, F., et al. 2020, A&A, 641, A151 [NASA ADS] [CrossRef] [EDP Sciences] [Google Scholar]
- Sanders, D. B., Phinney, E. S., Neugebauer, G., Soifer, B. T., & Matthews, K. 1989, ApJ, 347, 29 [NASA ADS] [CrossRef] [Google Scholar]
- Scharwächter, J., Dopita, M. A., Shastri, P., et al. 2016, in The Universe of Digital Sky Surveys, eds. N. R. Napolitano, G. Longo, M. Marconi, M. Paolillo, & E. Iodice, 42, 263 [CrossRef] [Google Scholar]
- Schmitt, H. R., & Kinney, A. L. 1996, ApJ, 463, 498 [NASA ADS] [CrossRef] [Google Scholar]
- Schmitt, H. R., Ulvestad, J. S., Antonucci, R. R. J., & Kinney, A. L. 2001, ApJS, 132, 199 [NASA ADS] [CrossRef] [Google Scholar]
- Schmitt, H. R., Donley, J. L., Antonucci, R. R. J., Hutchings, J. B., & Kinney, A. L. 2003, ApJS, 148, 327 [NASA ADS] [CrossRef] [Google Scholar]
- Schnorr-Müller, A., Storchi-Bergmann, T., Nagar, N. M., & Ferrari, F. 2014, MNRAS, 438, 3322 [NASA ADS] [CrossRef] [Google Scholar]
- Schoenmakers, R. H. M. 1999, Ph.D. Thesis, University of Groningen, The Netherlands [Google Scholar]
- Schoenmakers, R. H. M., Franx, M., & de Zeeuw, P. T. 1997, MNRAS, 292, 349 [NASA ADS] [CrossRef] [Google Scholar]
- Schönell, A. J., Storchi-Bergmann, T., Riffel, R. A., et al. 2019, MNRAS, 485, 2054 [NASA ADS] [CrossRef] [Google Scholar]
- Scoville, N., Aussel, H., Sheth, K., et al. 2014, ApJ, 783, 84 [NASA ADS] [CrossRef] [Google Scholar]
- Scoville, N., Sheth, K., Aussel, H., et al. 2016, ApJ, 820, 83 [NASA ADS] [CrossRef] [Google Scholar]
- Shimizu, T. T., Davies, R. I., Lutz, D., et al. 2019, MNRAS, 490, 5860 [NASA ADS] [CrossRef] [Google Scholar]
- Shirley, Y. L. 2015, PASP, 127, 299 [Google Scholar]
- Siebenmorgen, R., & Krügel, E. 2007, A&A, 461, 445 [NASA ADS] [CrossRef] [EDP Sciences] [Google Scholar]
- Simpson, C., Wilson, A. S., Bower, G., et al. 1997, ApJ, 474, 121 [NASA ADS] [CrossRef] [Google Scholar]
- Skrutskie, M. F., Cutri, R. M., Stiening, R., et al. 2006, AJ, 131, 1163 [NASA ADS] [CrossRef] [Google Scholar]
- Stalevski, M., Asmus, D., & Tristram, K. R. W. 2017, MNRAS, 472, 3854 [NASA ADS] [CrossRef] [Google Scholar]
- Stone, Jr., J. L., Wilson, A. S., & Ward, M. J. 1988, ApJ, 330, 105 [NASA ADS] [CrossRef] [Google Scholar]
- Storchi-Bergmann, T., & Bonatto, C. J. 1991, MNRAS, 250, 138 [NASA ADS] [Google Scholar]
- Storchi-Bergmann, T., Riffel, R. A., Riffel, R., et al. 2012, ApJ, 755, 87 [CrossRef] [Google Scholar]
- Storchi-Bergmann, T., & Schnorr-Müller, A. 2019, Nat. Astron., 3, 48 [Google Scholar]
- Sun, S., Guainazzi, M., Ni, Q., et al. 2018, MNRAS, 478, 1900 [NASA ADS] [CrossRef] [Google Scholar]
- Tazaki, R., & Ichikawa, K. 2020, ApJ, 892, 149 [NASA ADS] [CrossRef] [Google Scholar]
- Thean, A., Pedlar, A., Kukula, M. J., Baum, S. A., & O’Dea, C. P. 2000, MNRAS, 314, 573 [Google Scholar]
- Toba, Y., Ueda, Y., Matsuoka, K., et al. 2019, MNRAS, 484, 196 [Google Scholar]
- Toba, Y., Ueda, Y., Gandhi, P., et al. 2021, ApJ, 912, 91 [NASA ADS] [CrossRef] [Google Scholar]
- Tortosa, A., Bianchi, S., Marinucci, A., et al. 2018, MNRAS, 473, 3104 [NASA ADS] [CrossRef] [MathSciNet] [Google Scholar]
- Trachternach, C., de Blok, W. J. G., Walter, F., Brinks, E., & Kennicutt, Jr., R. C. 2008, AJ, 136, 2720 [NASA ADS] [CrossRef] [Google Scholar]
- Tristram, K. R. W., Raban, D., Meisenheimer, K., et al. 2009, A&A, 502, 67 [NASA ADS] [CrossRef] [EDP Sciences] [Google Scholar]
- Tristram, K. R. W., Burtscher, L., Jaffe, W., et al. 2014, A&A, 563, A82 [NASA ADS] [CrossRef] [EDP Sciences] [Google Scholar]
- Ulvestad, J. S., & Ho, L. C. 2001, ApJ, 562, L133 [NASA ADS] [CrossRef] [Google Scholar]
- Ulvestad, J. S., & Wilson, A. S. 1984, ApJ, 285, 439 [NASA ADS] [CrossRef] [Google Scholar]
- Urry, C. M., & Padovani, P. 1995, PASP, 107, 803 [Google Scholar]
- Veilleux, S., Bland-Hawthorn, J., & Cecil, G. 1999a, AJ, 118, 2108 [NASA ADS] [CrossRef] [Google Scholar]
- Veilleux, S., Bland-Hawthorn, J., Cecil, G., Tully, R. B., & Miller, S. T. 1999b, ApJ, 520, 111 [NASA ADS] [CrossRef] [Google Scholar]
- Veilleux, S., Maiolino, R., Bolatto, A. D., & Aalto, S. 2020, A&ARv, 28, 2 [NASA ADS] [CrossRef] [Google Scholar]
- Venanzi, M., Hönig, S., & Williamson, D. 2020, ApJ, 900, 174 [Google Scholar]
- Venturi, G., Nardini, E., Marconi, A., et al. 2018, A&A, 619, A74 [NASA ADS] [CrossRef] [EDP Sciences] [Google Scholar]
- Véron-Cetty, M. P., & Véron, P. 2006, A&A, 455, 773 [NASA ADS] [CrossRef] [EDP Sciences] [Google Scholar]
- Viti, S., García-Burillo, S., Fuente, A., et al. 2014, A&A, 570, A28 [NASA ADS] [CrossRef] [EDP Sciences] [Google Scholar]
- Vollmer, B., Schartmann, M., Burtscher, L., et al. 2018, A&A, 615, A164 [NASA ADS] [CrossRef] [EDP Sciences] [Google Scholar]
- Wada, K. 2012, ApJ, 758, 66 [NASA ADS] [CrossRef] [Google Scholar]
- Wada, K. 2015, ApJ, 812, 82 [NASA ADS] [CrossRef] [Google Scholar]
- Wada, K., & Norman, C. A. 2002, ApJ, 566, L21 [NASA ADS] [CrossRef] [Google Scholar]
- Wada, K., Schartmann, M., & Meijerink, R. 2016, ApJ, 828, L19 [NASA ADS] [CrossRef] [Google Scholar]
- Wada, K., Fukushige, R., Izumi, T., & Tomisaka, K. 2018, ApJ, 852, 88 [NASA ADS] [CrossRef] [Google Scholar]
- Williamson, D., Hönig, S., & Venanzi, M. 2019, ApJ, 876, 137 [NASA ADS] [CrossRef] [Google Scholar]
- Williamson, D., Hönig, S., & Venanzi, M. 2020, ApJ, 897, 26 [NASA ADS] [CrossRef] [Google Scholar]
- Yamada, T. 1994, ApJ, 423, L27 [NASA ADS] [CrossRef] [Google Scholar]
- Yan, Z., & Xie, F.-G. 2018, MNRAS, 475, 1190 [NASA ADS] [CrossRef] [Google Scholar]
- Yaqoob, T., Serlemitsos, P. J., Turner, T. J., George, I. M., & Nandra, K. 1996, ApJ, 470, L27 [NASA ADS] [CrossRef] [Google Scholar]
- Yi, H., Wang, J., Shu, X., et al. 2021, ApJ, 908, 156 [NASA ADS] [CrossRef] [Google Scholar]
- Yoshida, M., Yagi, M., Okamura, S., et al. 2002, ApJ, 567, 118 [NASA ADS] [CrossRef] [Google Scholar]
- Young, L. M., Meier, D. S., Bureau, M., et al. 2021, ApJ, 909, 98 [NASA ADS] [CrossRef] [Google Scholar]
- Zhuang, M.-Y., Ho, L. C., & Shangguan, J. 2018, ApJ, 862, 118 [NASA ADS] [CrossRef] [Google Scholar]
Appendix A: Notes on individual galaxies
NGC 4388. The host galaxy of this Seyfert 1.9 is classified as an SA(s)b and is highly-inclined (i = 78°; Veilleux et al. 1999a, i = 90°; HyperLeda). The galaxy is part of the Virgo cluster and it is a candidate for suffering strong ram pressure stripping as betrayed by the detection a rich complex of ionized gas that extends up to 35 kpc above the disk (Veilleux et al. 1999b; Yoshida et al. 2002). NGC 4388 has a prominent ionization cone/NLR detected with HST [OIII] λ5007 Å narrow-band imaging (Schmitt et al. 2003) and near-infrared IFU observations of the [SiVI]1.96 μm and Brγ emission lines (Greene et al. 2014). The ionization cone has an approximate PA of 190° −200°, extends for ∼1 kpc and presents a large opening angle (∼95° −105°). In the optical the northeast side of the ionization cone is mostly obscured by the host galaxy whereas it appears nearly symmetric in the near-IR, as expected if the north side of the galaxy is the near side. We see the south ionization cone coming toward us and the north cone directed away from us. Radio emission extends out of the galaxy plane and consists of two point-like sources and a diffuse lobe located north (Stone et al. 1988; Hummel & Saikia 1991). The northern knot coincides with the nucleus and the southern knot coincides with a bright region of ionized gas seen in the [OIII] line, which suggests a jet–ISM interaction (Falcke et al. 1998; Rodríguez-Ardila et al. 2017). The column densities toward the central engine of NGC 4388 derived from X-ray observations show significant variations: N(H)∼(2.1 − 6.5)×1023 cm−2 (Yi et al. 2021). The most recent determinations give N(H) ∼ (2.6 − 2.7)×1023 cm−2 (Miller et al. 2019).
NGC 4941. This nearly face-on (i = 37°; HyperLeda), ring galaxy (morphological type (R)SAB(r)ab) is classified as a Seyfert 2 and has, together with NGC 7465, the lowest 14–150 keV luminosity in our sample. Recent VLT/MUSE optical IFU observations showed that the inner 2 kpc are dominated by AGN/shock emission in a spiral-like structure (Erroz-Ferrer et al. 2019). Using optical IFU [SIII] λ9069 Å observations, Barbosa et al. (2009) proposed the presence of a compact outflow associated with the emission of a radio jet. The gas emission is enhanced in the regions where significant radio emission is detected. The average orientation of the outflow is PA ∼ −40° to −60°, which roughly coincides with the direction of the large-scale high excitation emission detected with MUSE. The nuclear radio emission appears to be partially resolved, and presents a double source morphology extended by ∼15 pc along PA ∼ −25° (Thean et al. 2000; Schmitt et al. 2001).
NGC 5506. This is a highly-inclined (i ∼ 90°, HyperLeda) galaxy (morphological type Sa peculiar) within the Virgo supercluster classified as a Seyfert 1.9. HST narrow-band [OIII]λ5007Å imaging shows a one-sided ionization cone/NLR perpendicular to the disk of the host galaxy at an approximate PA = 15° −20° and a 5″ extension to the northeast (Fischer et al. 2013). The V − H color map also reveals a blue fan-shaped structure to the N of the nucleus (Martini et al. 2003, see also this work). The northern [OIII] ionization cone is inclined slightly toward our line-of-sight and avoids the high extinction of the galaxy disk. Both sides of the ionization cone appear well defined in the velocity dispersion maps of the near-IR [FeII]λ1.257 μm and Brγ emission lines (Schönell et al. 2019). From the modeling of the optical NLR kinematics, Fischer et al. (2013) derived an outer semi-opening angle of the cone of 40° −45°. The VLA 4.9 GHz map of Colbert et al. (1996) shows that besides the central source there is elongated radio emission out to several kpc from the nucleus in the direction of the minor axis. Overall, there is multiple observational evidence implying the presence of a minor-axis wind. The nuclear X-ray source of NGC 5506 is absorbed by a column density N(H) ∼ 3 × 1022 cm−2, that is, in the Compton-thin regime. However, the obscuring matter covering the nucleus has an average integrated column density about two orders of magnitude larger (Sun et al. 2018).
NGC 5643. The host of this Seyfert 2 is a spiral galaxy with a morphological type of SAB(rs)c, seen close to a face-on orientation (i = 30°, HyperLeda). Jungwiert et al. (1997) and Mulchaey et al. (1997) identified the presence of a large-scale stellar bar in the near-IR with a diameter D ∼ 67″(5.6 kpc) and oriented along PA ∼ 85°. A large ionization cone/NLR/outflow is identified using [OIII]λ5007Å (Simpson et al. 1997; Cresci et al. 2015; Mingozzi et al. 2019; García-Bernete et al. 2021). VLA radio observations show emission corresponding to a radio jet of this radio-quiet galaxy (Morris et al. 1985; Leipski et al. 2006). The outflow and radio jet extend for approximately 2 kpc close to the east-west direction (PA ∼ 80° −85°). The NLR modeling of Fischer et al. (2013) inferred an outer semi-opening angle of 50° −55° for the ionization cone. Davies et al. (2014) found evidence of noncircular motions in their study of the kinematics of hot molecular gas traced by the H2 1–0 S(1) line in a region located ∼2″ northeast of the nucleus. NGC 5643 is classified as a compton-thick galaxy with an obscuring column density N(H) ∼ (2.5)×1025 cm−2 (Guainazzi et al. 2004; Annuar et al. 2015; Ricci et al. 2015). It has a moderate X-ray luminosity (L2 − 10 keV ∼ 1042 erg s−1). Ramos Almeida et al. (2016) did not detect optical broad lines in polarized light in NGC 5643. This nondetection has been explained by Ramos Almeida et al. (2016) as due to its Compton-thick nature and low AGN luminosity or, alternatively, as due to the different properties of the material responsible for the scattering.
NGC 6300. This ring barred spiral galaxy (morphological type SB(rs)b) is observed at an intermediate inclination (i = 53°, HyperLeda) and is classified as a Seyfert 2. Ramos Almeida et al. (2016) detected a broad Hα component identifying it as hidden BLR candidate. The large-scale stellar bar detected in the Ks band by Gaspar et al. (2019) has a projected length ∼1′ and is oriented along PA ∼ 46°. Mulchaey et al. (1997) discussed the presence of a secondary nuclear bar at scales ≤4″. Two spiral dust lanes connect inside the bar the outer ring with the nucleus. Gaspar et al. (2019) found evidence of the presence of large amounts of hot dust in the nuclear region itself but also in a circumnuclear disk up to r ∼ 27 pc, and attributed to this compact disk part of the obscuration in this Seyfert 2 nucleus. Davies et al. (2014) modeled the kinematics of the near-IR H2 line at 2.12 μm and inferred the presence of an edge-on large opening angle outflow (∼90° −100°) oriented in an approximate north-south direction (PA ∼ 15° −20°) superimposed on a rotating disk. Using optical IFU observations, Scharwächter et al. (2016) observed that this biconical structure extends out to approximately 20″ (∼1.6 kpc) from the AGN. It presents enhanced [NII]/Hα ratios and relatively high velocity dispersion when compared to the HII regions observed in the circumnuclear ring. Both the obscuration of the nuclear region and the intrinsic AGN luminosity of NGC 6300 were found to evolve over the years based on X-ray observations: N(H) ∼ (1.1 − 5.8)×1023 cm−2 and Lbol ∼ (0.7 − 3.8)×1042 erg s−1 (Jana et al. 2020).
NGC 6814. This galaxy at moderate inclination (i = 52°, HyperLeda) has a morphological type of SAB(rs)bc, although a large-scale stellar bar is clearly observed in the near-IR. The bar has a diameter of 24″ and it extends along PA = 21 − 25° (Mulchaey et al. 1997; Márquez et al. 1999). The HST sharp-divided image of NGC 6814 published by Márquez et al. (2003) shows a two-armed spiral structure inside r < 1″ = 120 pc. This dusty feature transforms into a multi-arm filamentary feature at larger radii up to r ∼ 4 − 5″ = 500 pc. On smaller scales, the nucleus is absorbed by a dusty gas disk that lies along PA ∼ 45° within r < 0.5″ = 60 pc. Spectroscopically the galaxy is classified as a Seyfert 1.5. Using HST narrow-band [OIII]λ5007 Å, Schmitt & Kinney (1996) detected a compact core and extended emission along PA ∼ 150° over a total extent of 1″. The radio emission imaged by Ulvestad & Wilson (1984) shows a compact core and an elongation up to 2″ to the W of the nucleus at PA ∼ 105°, which has no counterpart in the [OIII] image. Müller-Sánchez et al. (2011) modeled the kinematics of the near-IR Brγ and [SiVI]1.96 μm emission lines with a rotating disk oriented along PA ∼ 145° and a biconical outflow oriented at PA ∼ 30° −35° with an opening angle ∼100° −120°. This Seyfert 1.5 galaxy shows a X-ray variability of a factor of 10 over time-scales of years (Mukai et al. 2003). Tortosa et al. (2018) estimated an X-ray obscuring column density toward the nucleus N(H) ∼ 3.5 × 1023 cm−2.
NGC 7213. This nearly face-on (i = 39°, HyperLeda) SA(s)a galaxy is classified as a Seyfert 1.5 galaxy. The HST [OIII]λ5007 Å emission has a relatively compact halo-like emission extending for approximately 1″ (Schmitt et al. 2003). However, there is evidence of an extension of the [OIII] emission around PA = −15° to −40°. Using optical IFU observations, Schnorr-Müller et al. (2014) found evidence of inflowing gas along a nuclear two-arm spiral structure that extends from the nucleus out to r ∼ 4″ (440 pc) to the NW and SE. This spiral structure seen in ionized gas is roughly co-spatial with a dusty spiral feature revealed by the structure map of the galaxy published by Schnorr-Müller et al. (2014). The line of nodes is derived from the stellar kinematics is oriented along PA ∼ 356° (Schnorr-Müller et al. 2014). At centimeter and millimeter wavelengths the galaxy shows a compact and mostly unresolved structure in the radio continuum (Bransford et al. 1998; Thean et al. 2000; Blank et al. 2005; Murphy et al. 2010; Salvestrini et al. 2020). Bransford et al. (1998) interpreted the radio emission at 3 cm as either nuclear synchrotron or free-free emission. The radio power of the galaxy, ∼3 × 1029 erg s−1 Hz−1 at 20 cm, is a factor of 10 higher than usually found in radio-quiet Seyfert galaxies. Among the galaxies in our sample, it shows the lowest X-ray column density and it is a relatively faint and unobscured AGN with evidence of significant variability (Yan & Xie 2018). Ruschel-Dutra et al. (2014) fit a clumpy torus model to the MIR SED finding a low i = 21° and a very low gas column density N(H) ∼ 1018 cm−2, which seems to correspond to its Seyfert 1.5 type classification.
NGC 7314. This highly inclined galaxy (i = 70°, HyperLeda) is morphologically classified as an SAB(rs)bc and contains a Sy1.9 nucleus. Thean et al. (2000) detected a double radio structure oriented in an almost north-south direction and extending for approximately 4″ (350 pc). An HST/STIS acquisition image at 7230Å shows a bright compact nuclear source and a dust lane east of the AGN and also oriented north-south (Hughes et al. 2003). NGC 7314 experiences extreme variability events in X-ray flux (Yaqoob et al. 1996; Ebrero et al. 2011; Emmanoulopoulos et al. 2016). Ebrero et al. (2011) found evidence that the source is seen through a warm absorber situated within a clumpy torus. The reported changes in the neutral column density were interpreted by Ebrero et al. (2011) as due to the crossing of a cloud of neutral gas that is grazing the edge of the torus. Da Silva et al. (in prep.) detected a wide opening angle (∼90° −100°) [OIII] structure that extends mostly west of the nucleus, interpreted as the signature of an ionized outflow with a mean axis PAout ∼ 100° −120°.
NGC 7465. This relatively inclined (i = 64°, HyperLeda) barred galaxy (morphological type (R’)SB(s)0) hosts a Seyfert 2 nucleus. However, Ramos Almeida et al. (2009b) classified the galaxy as a type-1 LINER through its near-IR spectrum, which shows broad Paβ and Brγ. The galaxy belongs to the NGC 7448 group and it forms an interacting pair with NGC 7464. The optical continuum HST images of this galaxy, published by Ferruit et al. (2000), show an inverted S-shaped morphology on large scales and tend to a photometric major axis along PA = 120° in the inner 4″ (540 pc). The morphology of the central regions is heavily obscured by a set of dust lanes that are oriented perpendicular to the photometric major axis of the galaxy. HST narrow-band [OIII]λ5007 Å imaging reveals extended emission (approximately 4″) oriented at PA ∼ 100° −120° (Ferruit et al. 2000). The [OIII] morphology resembles a bi-cone with the brighter emission coming from the northwest of the nucleus with an opening angle ∼90° −100°. Krajnović et al. (2011) determined a kinematic major axis along PA ∼ 167°, based on the stellar kinematics of the galaxy. They also found evidence of a an inner decoupled kinematic core with a PA tilted by ∼100° relative to the large-scale disk. Nyland et al. (2016) detected spatially resolved radio continuum emission at 5 GHz stemming from an elongated source of size 0.4″ × 0.3″ at PA ∼ 20°. Baumgartner et al. (2013) detected NGC 7465 in hard X-rays with Swift/BAT.
NGC 7582. This is a highly inclined (i = 68°, HyperLeda) barred galaxy (morphological type (R’)SB(s)ab) optically classified as a Seyfert 2 with a bright circumnuclear ring of star formation. It shows a spectacular ionization cone of wide opening angle (∼90° −100°), which was first identified at optical wavelengths (Morris et al. 1985; Storchi-Bergmann & Bonatto 1991; Davies et al. 2016) with an approximate PA = 235° −245°. The southwest part of the cone shows the brightest emission whereas the northeast part appears to be obscured by the host galaxy, at least in the optical. The kinematics of the [OIII] λ5007 Å line differs significantly from the kinematics of Hα (Ricci et al. 2018b). The structure seen in the radial velocity map of [OIII] has a PA ∼ 230°, with the blueshifted structure being associated with the inner section of the ionization cone. Riffel et al. (2009) analyzed the kinematics of the hot molecular gas, traced by the NIR H2 line emission and found little evidence of outflowing motions for this component. Soft X-ray observations also revealed the ionization cone of the galaxy (Bianchi et al. 2007; Braito et al. 2017). NGC 7582 is a X-ray bright source with a significant obscuration: N(H) ∼ 1023 − 24 cm−2. The source shows very rapid changes of the column density of an inner absorber, but it nevertheless requires the existence of additional constant components (Bianchi et al. 2009). It behaves like a changing-look AGN with highly variable absorption and strong reflection features (Rivers et al. 2015; Braito et al. 2017). The radio emission of this galaxy at 8.4 GHz appears to be extended over several arcseconds (Thean et al. 2000) and is likely spatially coincident with the ring of star formation with no clear association with the AGN source.
Appendix B: HST observations
Table B.1 lists the details of the HST observations used in this paper. We list the instruments, filters, exposure times, and pixel sizes of the observations, as well as the proposal identifications and their principal investigators.
Details of the HST observations.
Appendix C: NuSTAR X-ray observations
In Table C.1 we list the details of the NuSTAR X-ray observations used in this paper, as well as the main parameters obtained in the fitting procedure described in Sect. 7.2.
Parameters of the fit to NuSTAR X-ray observations.
Appendix D: Fits of mean-velocity fields
Figure D.1 shows the mean-velocity fields derived from the CO(3–2) line (⟨vCO⟩) in the GATOS core sample galaxies inside the 17″ ALMA FOV. To maximize the reliability of the maps, isovelocities have been obtained by integrating the emission with a threshold of 3σ. Figure D.2 zooms in on the central Δx × Δy = 100 pc × 100 pc regions to show the overlay of the velocity-integrated emission on ⟨vCO⟩ for the core sample of GATOS galaxies as well as NGC 1068 and NGC 3227 (García-Burillo et al. 2019; Alonso-Herrero et al. 2019).
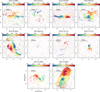 |
Fig. D.1. Same as Fig. 10, but showing the mean-velocity field of the 3–2 line of CO (⟨vCO⟩ in km s−1-units) inside the 17″ ALMA field-of-view for the galaxies of the core sample of GATOS. Mean-velocities have been derived using a 3σ clipping on the emission. |
The velocity field of the gas shows the expected rotation pattern on ∼ kpc scales (Fig. D.1) but also ∼50 pc from the AGN (Fig. D.2) in all the galaxies. The presence of noncircular motions, which distort the rotation pattern, is nevertheless identified across a range of spatial scales for a significant fraction of the sources. Some of the distortions in the large-scale velocity fields visualized in Fig. D.1 can be easily associated with gas inflow motions driven by bars and spiral arms, which have left their imprint in the disks of NGC 4941, NGC 5643, NGC 6300, NGC 7314, NGC 7465, and NGC 7582. However, other distortions of the velocity fields identified closer to the nucleus in NGC 4388, NGC 5506, NGC 5643, NGC 3227, and NGC 1068 are rather indicative of outflow motions16. We use below the software package kinemetry developed by Krajnović et al. (2006) to fit the CO(3–2) mean-velocity fields of Fig. D.1 using an iterative process and a minimum number of free parameters. Our objective is to identify the signature of outflows that can be launched by AGN winds and/or radio jets, which are present in a fraction of our sources.
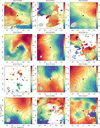 |
Fig. D.2. Overlay of the velocity-integrated emission (ICO; contours) on the mean-velocity field (⟨vCO⟩; linear color scale in km s−1-units) of molecular gas derived from the 3–2 line of CO for the central Δx × Δy = 100 pc × 100 pc regions of the core sample of GATOS galaxies. We also include the images of NGC 1068 (García-Burillo et al. 2019) and NGC 3227 (Alonso-Herrero et al. 2019). We used a 3σ clipping on the MSR data to simultaneously derive ICO and ⟨vCO⟩. Contours: 2.5% (dashed gray), 5% (gray), 10%, 15% 20%, 30% to 90% of |


D.1. Kinemetry fits
The general description of the two-dimensional line-of-sight velocity field of a galaxy disk can be expressed as:
 (D.1)
(D.1)
where (vR, vθ) is the velocity in polar coordinates, ψ is the phase angle measured in the galaxy plane from the receding side of the line of nodes, and i is the inclination angle restricted to the range 0 < i < π/2.
Alternatively, the observed mean-velocity field of a galaxy disk, vmean(r, ψ), expressed as a function of the radius (r) and the phase angle (ψ, measured from the receding side of the line of nodes), can be divided into a number of elliptical ring profiles with a geometry defined by the position angle and inclination (PA, i). We can decompose vmean(r, ψ) as a Fourier series with harmonic coefficients cj(r) and sj(r), where
![Mathematical equation: $$ \begin{aligned} { v}_{\rm mean} (r, \psi )= c_0 + \sum _{j=1}^n [c_j(r) \cos (j\psi ) + s_j(r) \sin (j\psi )]. \end{aligned} $$](/articles/aa/full_html/2021/08/aa41075-21/aa41075-21-eq115.gif) (D.2)
(D.2)
The term c1 accounts for the contribution of circular rotation and the other terms of the series contain the contributions of noncircular motions (Schoenmakers et al. 1997; Schoenmakers 1999). Expanding the series of Eq. (D.2) out to n = 3 provides a fairly complete description of vlos in most models (Trachternach et al. 2008). In a disk with axisymmetric circular rotation (vc), c0 = vsys and c1 = vc sin i and all remaining terms can be neglected. In the case of a pure axisymmetric radial flow (vR), c0 = vsys and s1 = vR sin i, with the rest of coefficients being 0.
We used the software package kinemetry to fit the CO(3–2) mean-velocity fields of Fig. D.1, following the approach adopted by García-Burillo et al. (2014) and García-Burillo et al. (2019) to fit the velocity field of NGC 1068. We used in the fit 32 ellipses with semi major axes covering the disks from  to
to  , with a spacing
  . At each step, kinemetry finds the best fitting ellipses by maximizing the contribution of circular motions and by minimizing the contribution of noncircular motions (vnonc), evaluated as:
 (D.3)
(D.3)
By construction kinemetry provides a good estimate of the c1 term.
We assumed that the dynamical centers for our sources coincide with the AGN positions derived in Sect. 4.2. In a first step we left the position angles PA(r) and the inclinations i(r) as free parameters in the fit. From this first iteration we obtained the best fit for the systemic velocities. We then subtract vsys from vmean and re-derive the Fourier decompositions of Eq. (D.1). We then derived the average values of PA(r) and i(r): ⟨PA⟩ and ⟨i⟩. In a second step, we fixed i to ⟨i⟩ and re-determined the PA(r) profile. From this second iteration, we derived ⟨PA⟩. Finally, we derived the Fourier decomposition of the velocity fields fixing PA and i at all radii to the mean values derived in the two previous iterations.
The approach followed in the present analysis implicitly assumes that the gas kinematics in our sources can be modeled roughly by orbits in thin disks as a way to identify deviations in the velocity fields that can be attributed to mostly coplanar molecular inflows or outflows. Although this approach might appear simplistic at first sight, we note that there is mounting observational evidence suggesting that most of the molecular outflows launched in nearby AGN lie in a geometry configuration close to coplanar with the host galaxy disk (García-Burillo et al. 2014, 2019; Davies et al. 2014; Morganti et al. 2015; Alonso-Herrero et al. 2018, 2019; García-Bernete et al. 2021). More realistic 3D scenarios including vertical components for the velocity fields will nevertheless be explored in Paper III for the GATOS core sample galaxies.
Figure D.3 shows the rotational motions inside the central Δx × Δy = 400 pc × 400 pc regions derived from the fit to the CO velocity fields obtained by kinemetry in eight of the GATOS core sample galaxies. These targets are purposely selected based on the availability of good estimates for the orientation of their AGN wind outflows. Based on the kinemetry fit, we can therefore estimate the velocity gradients that we can attribute to purely rotational motions predicted by the model. We overlay in Fig. D.3 the expected velocities due to rotational motions predicted by the model on the CO(3–2) position-velocity (p-v) diagrams taken along the (projected) direction of the ionized outflow axes. In the majority of the sources shown in Fig. D.3 the projected outflow axes lie at a large angle relative to the kinematic major axes of the disks derived by the model. The contribution of tangential components of both circular and noncircular motions in the p-v plots of Fig. D.3 is therefore expected to be totally negligible. Under the hypothesis that molecular gas lies mostly in a coplanar geometry, and taking into account the known orientation of the galaxy disks relative to the plane of the sky (as identified on each side of the p-v plots), we can therefore attribute any significant (> ± 30 km s−1) deviation from the modeled circular rotation to either inflow or outflow bulk motions. We highlight the regions where inflow/outflow motions can be identified in the p-v plot panels of Fig. D.3.
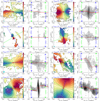 |
Fig. D.3. Rotational motions inside the central Δx × Δy = 400 pc × 400 pc regions of eight galaxies of the core sample of galaxies, derived from the fit to the CO velocity fields obtained by kinemetry, as described in Appendix D. We indicate the best-fit values estimated for the position angle (PAdisk; blue line) and the inclination of the disk (idisk). The green line shows the orientation of the outflow axes. The CO(3–2) position-velocity (p-v) diagrams derived along the outflow axes are shown on the right hand side beside the velocity field panels for each galaxy. The p-v diagrams are centered around the AGN locus and vsys. We identify the near and far sides on the upper x′ axes of the outflow p-v diagrams, based on the morphology of the V − H color maps of Fig. 12 and on the assumption that the spiral structures seen in some galaxies are trailing. Contour spacing: −2.5σ (dashed blue), 2.5σ, 5σ, 10σ, 15σ to the peak intensity in steps of 10σ. The red curves show the velocities along the outflow axes that can be attributed to rotational motions derived from the model. We identify in the p-v diagrams the regions corresponding to coplanar inflow or outflow radial motions. |
We find evidence of outflow motions affecting a sizeable fraction of molecular gas on CND scales in three of the sources of Fig. D.3: NGC 4388, NGC 5506, and NGC 5643. The noncircular motions detected in the CO(3–2) velocity field of NGC 5643 are very similar to those revealed by the previous ALMA CO(2–1) data of Alonso-Herrero et al. (2018) and García-Bernete et al. (2021), who modeled them in terms of a molecular outflow. In NGC 4388, we confirm the results of Domínguez-Fernández et al. (2020), who claimed the existence of a molecular outflow based on a fit to the gas velocity field derived from a lower resolution ( ) CO(2–1) NOEMA image of the galaxy. In the case of NGC 5506, the outflows identified in Fig. D.3 extend in the disk out to deprojected radii ∼100 − 200 pc from the AGN and are characterized by moderate radial deprojected velocities ∼50 − 100 km s−1, similar to those of the NGC 4388 outflow.
In NGC 7582 a perturbed kinematics and marginal evidence of moderate (< 50 km s−1) outflow motions are found ∼100 pc from the AGN. We nevertheless detect the clear signature of inflow motions of up to ∼120 km s−1 down to r ∼ 250 − 300 pc. The latter is plausibly linked to the canonical gas response to the stellar bar outside the ILR region. Similar yet more moderate inflow motions are detected in the p-v diagrams linked to the gas response to the stellar bar in NGC 6300 and to the crossing of the spiral arms in NGC 7314. Finally, we find only tentative evidence of outflowing components in the p-v plots of NGC 4941 and NGC 7465. In NGC 7465, velocities redshifted by ∼50 − 100 km s−1 around 70 pc northwest of the AGN are similar to the [OIII] velocities associated to the outflow in this region (Ferruit et al. 2000; Young et al. 2021).
All Tables
Parameters of the point and extended sources fitted to the continuum emission of the MSR and HSR datasets.
Sizes, masses, and orientations of the extended components of continuum emission.
All Figures
|
Fig. 1. Left panel: comparison of the distribution of intrinsic AGN luminosities measured in the 2–10 keV X-ray band (corrected for absorption) and the column densities, NH, derived from hard X-rays, as measured by Swift/BAT in the 14–150 keV band for the combined GATOS sample listed in Table 1 (star markers) (Ricci et al. 2017a). We also include the data of NGC 613 from the NUGA sample (Combes et al. 2019) (circle), which also has NGC 1365 as a target in common with GATOS. Symbols are color-coded to reflect the Eddington ratios estimated by Koss et al. (2017). Right panel: comparison of the probability density function (PDF) of AGN luminosities in the 2–10 keV band for the combined sample of GATOS and NUGA (gray-filled histogram) and the Swift/BAT sample of Ricci et al. (2017a) (blue histogram). We identify the distribution of NUGA targets by the hatched area. This figure illustrates the complementarity of NUGA and GATOS samples in covering a significant (∼4.5 dex) range of intrinsic AGN luminosities with the combined sample of 19 nearby Seyferts used in this work. |
| In the text | |
|
Fig. 2. Left panels: continuum emission at the (rest) frequency range 350.6–351.1 GHz (Icont) in the central Δα × Δδ = 1″ × 1″ regions of NGC 4388, NGC 4941, NGC 5506, and NGC 5643, obtained from the ALMA MSR datasets. The AGN positions, identified by the blue star markers, correspond to the location of the point sources determined by the two-component fit to the continuum emission described in Sect. 4. The continuum maps are shown in color scale and (black) contour levels with a logarithmic spacing from −2.5σcont(dashed blue), 2.5σcont to 90% of the peak intensity ( |
| In the text | |
|
Fig. 5. Histograms showing the distribution of the deconvolved diameters of the dusty molecular tori (or polar components) derived from the combined sample of NUGA and GATOS (gray-filled histograms). We adopt for GATOS the average sizes estimated from the MSR and HSR datasets. The blue-filled histogram identifies the distribution of sizes of the tori derived for NUGA galaxies (Combes et al. 2019). |
| In the text | |
|
Fig. 6. Top row: overlay of the ALMA 351 GHz continuum map of the central Δα × Δδ = 4″ × 4″ region of NGC 7582 (contours) on the spectral index map of the galaxy (α, with Sν ∝ να; in color) obtained from the images taken at ν = 230 GHz (Alonso-Herrero et al. 2020) and 351 GHz (this work) (left panel). We zoom in on the central Δα × Δδ = 1″ × 1″ region of NGC 7582 in middle panel and display the overlay after subtraction of the point-source in right panel. Middle row: same as top row but zooming in on the central Δα × Δδ = 1″ × 1″ region of NGC 5643; spectral index map obtained from the images taken at ν = 230 GHz (Alonso-Herrero et al. 2018) and 351 GHz (this work). Bottom row: same as middle row but for NGC 3227; spectral index map obtained from the images taken at ν = 230 GHz (Alonso-Herrero et al. 2019) and 351 GHz (this work). The common apertures (gray ellipses) adopted to derive the spectral index maps are: |
| In the text | |
|
Fig. 7. Upper panel: histograms showing the distribution of the masses of the dusty molecular tori (or polar components) derived from the combined sample of NUGA and GATOS (gray-filled histograms). We adopt for GATOS the average masses estimated from the MSR and HSR datasets. The blue-filled histogram identifies the distribution of masses of the tori derived for NUGA galaxies (Combes et al. 2019). Lower panel: comparison of the molecular gas mass derived from the CO(3–2) integrated emission and from the dust emission inside the torus (or polar) features detected by ALMA in the galaxies listed in Table 3; for this comparison the HSR dataset is used. The torus (or polar) regions are identified by the elliptical Gaussians fit to the extended components of the continuum emission shown in Figs. 2–4, as described in Sect. 4.2. The median values of the distributions exclude NGC 7213, highlighted as an outlier. A comparison with the MSR dataset yields virtually identical results. Errorbars at the lower right corner account for an uncertainty of ±0.2 dex due to the assumed conversion factors. |
| In the text | |
|
Fig. 8. Histograms showing the distribution of the projected relative orientation angles between the extended components of continuum emission and the ionized outflow axes, defined as Δ≡ min[|PAGauss − PAout|, 180° −|PAGauss − PAout|] derived from the MSR and HSR ALMA datasets of GATOS. |
| In the text | |
|
Fig. 9. Comparison of the uniform cumulative distribution function (CDF) of Δ values in the 0°–90° range (blue) with those derived from our MSR (green) and HSR (reddish) datasets. |
| In the text | |
|
Fig. 10. Primary-beam corrected velocity-integrated intensity maps of the 3–2 line of CO (ICO) inside the 17″ ALMA field-of-view (FOV; represented by the gray circle) for the galaxies of the core sample of GATOS. Maps were derived using a 3σ clipping. Intensities are expressed in Jy km s−1-units using a logarithmic (color) scale. (Δα, Δδ)-offsets are relative to the phase tracking centers used during the observations, listed in Table 1. Filled-ellipses at the bottom left corners identify the sizes of the ALMA beams. |
| In the text | |
|
Fig. 11. Molecular gas mass detected inside the 17″-FOV of the ALMA CO(3–2) images of the GATOS and NUGA galaxies as a function of the intrinsic AGN luminosities measured in the 2–10 keV band for the galaxies of our combined sample. The regions mapped by ALMA span the central r ≤ 0.4 − 1.2 kpc. Symbols are color-coded as a function of the Eddington ratio of the sample galaxies. Errorbars account for the range of uncertainties on the molecular gas mass estimates, due to the assumed CO-to-H2 and 3–2/1–0 conversion factors (∼±0.2 dex), and on the AGN luminosities (∼±0.15 dex). |
| In the text | |
|
Fig. 12. Velocity-integrated CO(3–2) emission images (ICO; contours), obtained from the ALMA MSR datasets, are overlaid on the V − H color maps (shown in color scale), derived from the images obtained by HST with the F606W (V) and F160W (H) filters, in the central Δx × Δy = 400 pc × 400 pc regions of the galaxies of the core sample of GATOS. For NGC 7314 we used data of the F450W filter to replace the unavailable F160W. We also include the CO and V − H images of NGC 1068 (García-Burillo et al. 2019) and NGC 3227 (Alonso-Herrero et al. 2019). Contour levels have a logarithmic spacing from 3σco to 90% of the peak CO intensity inside the displayed field-of-view ( |
| In the text | |
|
Fig. 13. Overlay of the continuum emission, at the (rest) frequency range 350.6–351.1 GHz (Icont; contours), on the velocity-integrated CO(3–2) maps (ICO; color scale) in the central Δx × Δy = 100 pc × 100 pc regions of the core sample of GATOS galaxies. We also include the CO and continuum images of NGC 1068 (García-Burillo et al. 2019) and NGC 3227 (Alonso-Herrero et al. 2019). In NGC 1068 we use the 694 GHz continuum map of García-Burillo et al. (2016) to better identify the dusty torus. The continuum maps are shown using (black) contour levels with a logarithmic spacing from 3σcont to 90% of the peak intensity in steps of ∼0.16 dex on average. The CO(3–2) maps are displayed in (linear) color scale spanning the range [3σCO, |
| In the text | |
|
Fig. 14. Left panels: overlay of the continuum emission (Icont; contours) on the velocity-integrated CO(3–2) maps (ICO; linear color scale) of the central Δx × Δy = 100 pc × 100 pc regions of NGC 5506, NGC 5643, and NGC 6300, derived from their ALMA HSR datasets. Color scale spans the range [3σCO, |
| In the text | |
|
Fig. 15. Comparison of the molecular gas emission toward the AGN probed by the HCO+(4–3) (yellow-filled histograms) and CO(3–2) (gray-filled histograms) lines in two subsets of GATOS galaxies. Upper panels: comparison for the galaxies shown in Fig. 14 where strong (> 15σ) and/or spatially resolved emission is detected in HCO+(4–3): NGC 5506, NGC 5643, and NGC 6300. The spectra stacked for these sources is shown under the label stacking-I. Lower panels: compare the AGN spectra obtained in NGC 7314, NGC 7465, and NGC 7582. For these galaxies, either the detection of HCO+ or the lower limit on the CO/HCO+ ratio are statistically significant. The spectra stacked for these sources is shown under the label stacking-II. |
| In the text | |
|
Fig. 16. Comparison of the CO(3–2)/HCO+(4–3) ratios measured at the AGN locus in the galaxies of the NUGA (square markers) and GATOS (circle markers) samples as a function of the Eddington ratio. Symbols are color-coded as a function of the AGN luminosities measured in the 2–10 keV band for the sample galaxies. Lower limits on the ratios are identified by the (red) arrows. Uncertainties on the ratios (∼21%) are driven by the absolute flux calibration errors on the lines (∼15%). Eddington ratios have a ∼±0.4 dex uncertainty. |
| In the text | |
|
Fig. 17. Left panel: comparison of the column densities of neutral gas measured from CO toward the AGN (NH(CO); in units of H atoms per cm2) with the column densities derived by modeling the absorption of X-rays (NH(Xabs); Ricci et al. 2017a) in the galaxies listed in Table 3 and in NGC 613. In this comparison we use the HSR datasets of ALMA for the core sample of GATOS. The blue color is used to draw the 1:1 line, while the red color identifies the linear bisector fit to te data. Right panel: comparison of the average surface density of molecular gas measured for the molecular tori of the galaxies listed in Table 3 ( |
| In the text | |
|
Fig. 18. Left panel: estimate of the concentration of molecular gas in the central regions of the galaxies of GATOS and NUGA samples derived from the ratio of the average H2 surface densities measured at two spatial scales: r ≤ 50 pc ( |
| In the text | |
|
Fig. 19. Comparison of physical properties of the molecular tori in GATOS (circle markers) and NUGA (square markers). Average molecular gas surface densities ( |
| In the text | |
|
Fig. 20. Cartoon illustrating the different nuclear and circumnuclear environments of the NUGA and GATOS sources analyzed in this paper. The figure is a (not to scale) simplified sketch of the CND around the SMBH of a Seyfert galaxy representative of the NUGA (left panel) and GATOS samples (middle and right panels). These samples are characterized by different Eddington ratios and AGN luminosities (NUGA: Eddington ratios∼10−6.5–10−3.5 and LAGN(2–10 keV) ∼ 1039.1 − 41.3 erg s−1; GATOS: Eddington ratios∼10−3.0–10−0.3 and LAGN(2–10 keV) ∼ 1041.4 − 43.5 erg s−1). Based on the monotonic trends of Fig. 18, we distinguish between the typical environment of the highest luminosity and highest Eddington ratio GATOS Seyferts (right panel, well represented by sources like NGC 1068, and an intermediate case between NUGA and the most extreme GATOS Seyferts (middle panel), well represented by sources like NGC 5643. The imprint left by AGN winds on the distribution of molecular gas in the torus and its surroundings through the launching of dusty winds, and by the impact of AGN winds on the ISM at larger radii (ISM in the figure), is seen to be more extreme in the higher luminosity and higher Eddington ratio sources. |
| In the text | |
|
Fig. D.1. Same as Fig. 10, but showing the mean-velocity field of the 3–2 line of CO (⟨vCO⟩ in km s−1-units) inside the 17″ ALMA field-of-view for the galaxies of the core sample of GATOS. Mean-velocities have been derived using a 3σ clipping on the emission. |
| In the text | |
|
Fig. D.2. Overlay of the velocity-integrated emission (ICO; contours) on the mean-velocity field (⟨vCO⟩; linear color scale in km s−1-units) of molecular gas derived from the 3–2 line of CO for the central Δx × Δy = 100 pc × 100 pc regions of the core sample of GATOS galaxies. We also include the images of NGC 1068 (García-Burillo et al. 2019) and NGC 3227 (Alonso-Herrero et al. 2019). We used a 3σ clipping on the MSR data to simultaneously derive ICO and ⟨vCO⟩. Contours: 2.5% (dashed gray), 5% (gray), 10%, 15% 20%, 30% to 90% of |
| In the text | |
|
Fig. D.3. Rotational motions inside the central Δx × Δy = 400 pc × 400 pc regions of eight galaxies of the core sample of galaxies, derived from the fit to the CO velocity fields obtained by kinemetry, as described in Appendix D. We indicate the best-fit values estimated for the position angle (PAdisk; blue line) and the inclination of the disk (idisk). The green line shows the orientation of the outflow axes. The CO(3–2) position-velocity (p-v) diagrams derived along the outflow axes are shown on the right hand side beside the velocity field panels for each galaxy. The p-v diagrams are centered around the AGN locus and vsys. We identify the near and far sides on the upper x′ axes of the outflow p-v diagrams, based on the morphology of the V − H color maps of Fig. 12 and on the assumption that the spiral structures seen in some galaxies are trailing. Contour spacing: −2.5σ (dashed blue), 2.5σ, 5σ, 10σ, 15σ to the peak intensity in steps of 10σ. The red curves show the velocities along the outflow axes that can be attributed to rotational motions derived from the model. We identify in the p-v diagrams the regions corresponding to coplanar inflow or outflow radial motions. |
| In the text | |
Current usage metrics show cumulative count of Article Views (full-text article views including HTML views, PDF and ePub downloads, according to the available data) and Abstracts Views on Vision4Press platform.
Data correspond to usage on the plateform after 2015. The current usage metrics is available 48-96 hours after online publication and is updated daily on week days.
Initial download of the metrics may take a while.