| Issue |
A&A
Volume 675, July 2023
|
|
|---|---|---|
| Article Number | A88 | |
| Number of page(s) | 20 | |
| Section | Extragalactic astronomy | |
| DOI | https://doi.org/10.1051/0004-6361/202346074 | |
| Published online | 04 July 2023 | |
AGN feedback in action in the molecular gas ring of the Seyfert galaxy NGC 7172
1
Centro de Astrobiología (CAB), CSIC-INTA, Camino Bajo del Castillo s/n, 28692 Villanueva de la Cañada, Madrid, Spain
e-mail: aalonso@cab.inta-csic.es
2
Observatorio de Madrid, OAN-IGN, Alfonso XII, 3, 28014 Madrid, Spain
3
Instituto de Física Fundamental, CSIC, Calle Serrano 123, 28006 Madrid, Spain
4
Max-Planck-Institut für Extraterrestrische Physik, Postfach 1312, 85741 Garching, Germany
5
LERMA, Observatoire de Paris, Collège de France, PSL University, CNRS, Sorbonne University, Paris, France
6
Department of Physics & Astronomy, University of Alaska Anchorage, Anchorage, AK 99508-4664, USA
7
Instituto de Astrofísica de Canarias, Calle Vía Láctea s/n, 38205 La Laguna, Tenerife, Spain
8
Departamento de Astrofísica, Universidad de La Laguna, 38206 La Laguna, Tenerife, Spain
9
Department of Physics, University of Oxford, Oxford OX1 3RH, UK
10
School of Physics & Astronomy, University of Southampton, Southampton, SO17 1BJ Hampshire, UK
11
Space Telescope Science Institute, 3700 San Martin Drive, Baltimore, MD 21218, USA
12
The University of Texas at San Antonio, One UTSA Circle, San Antonio, TX 78249, USA
13
National Astronomical Observatory of Japan, National Institutes of Natural Sciences (NINS), 2-21-1 Osawa, Mitaka, Tokyo 181-8588, Japan
14
Departamento de Física de la Tierra y Astrofísica, Fac. de CC Físicas, Universidad Complutense de Madrid, 28040 Madrid, Spain
15
Instituto de Física de Partículas y del Cosmos IPARCOS, Fac. CC Físicas, Universidad Complutense de Madrid, 28040 Madrid, Spain
16
INAF – Osservatorio Astrofisico di Arcetri, Largo Enrico Fermi 5, 50125 Firenze, Italy
17
Department of Astronomy, School of Science, Graduate University for Advanced Studies (SOKENDAI), Mitaka, Tokyo 181-8588, Japan
18
Núcleo de Astronomía de la Facultad de Ingeniería, Universidad Diego Portales, Av. Ejército Libertador 441, Santiago, Chile
19
Kavli Institute for Astronomy and Astrophysics, Peking University, Beijing 100871, PR China
Received:
3
February
2023
Accepted:
22
May
2023
We present new ALMA observations of the CO(3−2) transition and associated 854 μm continuum at 0.06 − 0.3″ resolution, together with new VLT/SINFONI observations of NGC 7172. This is a luminous (bolometric luminosity of ≃1044 erg s−1) Seyfert galaxy that belongs to the Galaxy Activity, Torus, and Outflow Survey (GATOS). The ALMA CO(3−2) observations reveal the presence of a highly inclined cold molecular gas ring with an approximate radius of 3 − 4″ ≃ 540 − 720 pc, which is likely associated with an inner Lindblad resonance of a putative stellar bar. There are noncircular motions in the VLT/SINFONI [Si VI]λ1.96 μm and H2 at 2.12 μm, and ALMA CO(3−2) velocity fields. After subtracting the stellar velocity field, we detected [Si VI] blueshifted velocities of a few hundred km s−1 to the south of the active galactic nucleus (AGN) position. They trace outflowing ionized gas outside the plane of the galaxy and out to projected distances of ≃200 pc. The CO(3−2) position-velocity diagram along the kinematic minor axis displays noncircular motions with observed velocities of up to ∼150 km s−1. Assuming that these are taking place in the disk of the galaxy, the observed velocity signs imply that the molecular gas ring is not only rotating but also outflowing. We derived an integrated cold molecular gas mass outflow rate of ∼40 M⊙ yr−1 for the ring. Using the ALMA 854 μm extended emission map, we resolved a 32 pc radius torus with a gas mass of 8 × 10⁵ M⊙. These torus properties are similar to other Seyfert galaxies in the GATOS sample. We measured a decreased cold molecular gas concentration in the nuclear-torus region relative to the circumnuclear region when compared to other less luminous Seyfert galaxies. We conclude that the effects of AGN feedback in NGC 7172, which are likely caused by the AGN wind and/or the moderate luminosity radio jet, are seen as a large-scale outflowing molecular gas ring and accompanying redistribution of molecular gas in the nuclear regions.
Key words: galaxies: active / galaxies: ISM / galaxies: Seyfert / galaxies: nuclei / galaxies: evolution
© The Authors 2023
 Open Access article, published by EDP Sciences, under the terms of the Creative Commons Attribution License (https://creativecommons.org/licenses/by/4.0), which permits unrestricted use, distribution, and reproduction in any medium, provided the original work is properly cited.
This article is published in open access under the Subscribe to Open model. Subscribe to A&A to support open access publication.
1. Introduction
The formation and evolution of galaxies is one of the key challenges of modern astrophysics. State-of-the-art cosmological simulations provide the theoretical benchmark to understand the growth of galaxies and their supermassive black holes, and in particular, the effects of feedback (see for instance, Sijacki et al. 2015; Dubois et al. 2016; Davé et al. 2019; Anglés-Alcázar et al. 2021). With the new computational advances, these simulations are able to track the gas cycle on all relevant physical scales, from the circumgalactic medium all the way down to the sphere of influence of supermassive black holes. One important result from these simulations is that feedback is needed to regulate the buildup of the stellar mass in massive galaxies. In these types of galaxies, feedback is believed to be driven by radiation pressure from an active galactic nucleus (AGN) and mechanical energy from radio jets (see e.g., Fabian 2012, for a review).
Energetic multiphase (ionized, neutral, warm, and cold molecular gas) outflows have been routinely discovered in powerful AGNs and (ultra)luminous infrared galaxies. In strongly star-forming galaxies, the molecular outflow rates are comparable to, or higher by a factor of few, than the ongoing star-formation activity (Cicone et al. 2014). When an AGN is present, the outflow rates can be strongly boosted, with more luminous AGNs driving more energetic outflows (see, e.g., Fiore et al. 2017; Fluetsch et al. 2019). Still, at a given AGN luminosity, the outflow rates of the ionized gas span a range of nearly two orders of magnitude in nearby Seyfert galaxies (see Davies et al. 2020, and references therein). Similar results are found for the molecular phase of outflows in AGNs and ultraluminous infrared galaxies (ULIRGs), where the AGN luminosity is found not to be the only factor driving massive outflows (see e.g., Ramos Almeida et al. 2022; Lamperti et al. 2022, respectively). Other factors, such as jet and/or wind inclination relative to the galaxy disks, or gas concentration can also play a significant role.
In nearby Seyfert galaxies where the molecular and ionized gas phases were studied together, there is evidence for positive and/or negative feedback effects on scales of out to a few kiloparsecs caused by AGN winds, sometimes combined with low-power radio jets (García-Burillo et al. 2014; Cresci et al. 2015; Shimizu et al. 2019; Venturi et al. 2018, 2021; García-Bernete et al. 2021; Gao et al. 2021). At Seyfert-like luminosities, the molecular phase has a larger contribution to the total mass outflow rate and kinetic power than the ionized phase (Fiore et al. 2017; Fluetsch et al. 2019). The superb angular resolution attained with (sub)millimeter interferometry, including the Atacama Large Millimeter/submillimeter Array (ALMA), allows for AGN-driven cold molecular gas outflows to be probed from circumnuclear scales of a few hundred parsecs all the way to the molecular dusty torus on tens of parsecs. The derived molecular mass outflow rates in Seyfert galaxies range from ∼1 M⊙ yr−1 to a few tens of M⊙ yr−1, and the velocities are up to hundreds of km s−1 (Combes et al. 2013; García-Burillo et al. 2014; Morganti et al. 2015; Zschaechner et al. 2016; Alonso-Herrero et al. 2018, 2019; Audibert et al. 2019; Domínguez-Fernández et al. 2020).
The Galactic Activity, Torus, and Outflow Survey (GATOS) aims to understand the obscuring material (torus) and the nuclear gas cycle (inflows and outflows) in the dusty regions immediately surrounding the active nucleus of nearby AGNs. To do so, we selected local Seyfert galaxies from the 70 month Swift/BAT All-sky Hard X-ray Survey (Baumgartner et al. 2013). García-Burillo et al. (2021) obtained ALMA band 7 observations of ten GATOS Seyfert galaxies in the southern hemisphere and with distances in the 10−30 Mpc range. Combining these Seyfert galaxies with a sample of low-luminosity AGNs (from Combes et al. 2019), they found that galaxies with higher AGN luminosities and/or Eddington ratios are more efficient at clearing molecular gas from the nuclear (torus) regions. This was interpreted as the imprint on the nuclear molecular gas distribution left by the presence of AGN winds, that is, AGN-driven feedback. In a few GATOS Seyfert galaxies, this is confirmed by the presence of (circum)nuclear molecular outflows (Alonso-Herrero et al. 2018, 2019; García-Burillo et al. 2019) and polar dust emission (Alonso-Herrero et al. 2021) on these scales.
Up until now, we investigated the ALMA properties of intermediate luminosity Seyfert galaxies with LAGN(2 − 10 keV) = 1041.4 − 43.5 erg s−1 and distances of less than 28 Mpc in the GATOS sample (Alonso-Herrero et al. 2018, 2019; García-Burillo et al. 2021). NGC 7172 is a nearly edge-on Sa spiral galaxy in the GATOS sample at a redshift-independent distance of 37 Mpc (Davies et al. 2015) with an AGN bolometric luminosity of ∼1.3 × 1044 erg s−1 (Davies et al. 2015). It belongs to the Hickson compact group HCG90, which also includes, among other galaxies, NGC 7173, NGC 7174, and NGC 7176. NGC 7172 is optically classified as a Seyfert 2 (Véron-Cetty & Véron 2006), although Smajić et al. (2012) found evidence for the presence of broad hydrogen recombination lines in the near-infrared (near-IR). The nuclear region is crossed by dust lane that obscures the galaxy nucleus in the optical but not at longer wavelengths (Smajić et al. 2012). There is also a broader dust lane extending east-west across the galaxy that appears to be warped at the edges (Sharples et al. 1984). Figure 1 (top panel) shows a red-green-blue (RGB) optical to near-IR Hubble Space Telescope (HST) image of NGC 7172 retrieved from ESASky (Baines et al. 2017; Giordano et al. 2018), where this morphology is clearly seen. The distribution of the prominent dust lanes to the north of the nucleus indicates this is the near side of the galaxy. This is also in agreement with the extinction distribution in the (circum)nuclear regions of the galaxy (Smajić et al. 2012).
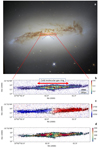 |
Fig. 1. Seyfert galaxy NGC 7172. From top to bottom: Panel a: HST optical to near-IR composite RGB image of NGC 7172 retrieved from ESASky4.3.0. It combines observations from the Advanced Camera for Surveys (ACS) at 6060 and 8140 Å, and the Wide Field Camera 3 (WFC3) at 1.6 μm. The orientation of the image is north up, east to the left. The FoV is ≃2′ × 2′. The rectangle shows approximately the ALMA FoV, while the dashed lines represent the opening angle of the southern (brighter) side of the optical ionization cone. Image credit: ESA/Hubble & NASA, D. J. Rosario, A. Barth. Panel b: ALMA CO(3−2) intensity map (moment 0) produced with a 3σ clipping using the merged configuration observations. We trimmed the original FoV to approximately 17.6″ × 3.3″. Both the image and the contours are shown on a linear scale. The color bar shows the intensity scale in Jy km s−1 per beam units. The first contour is at 0.05 Jy km s−1 per beam. The ALMA beam (not shown) is 0.08″ × 0.07″ (14 pc × 13 pc) at PAbeam = 90.4°. Panel c: ALMA CO(3−2) mean velocity map (moment 1) produced with a 3σ clipping using the merged configuration observations. The contours are the isovelocities. Panel d: ALMA CO(3−2) mean velocity dispersion map (moment 2) produced with a 3σ clipping using the merged configuration observations. For the last two panels the scale bar units are km s−1. |
Thomas et al. (2017) detected a prominent two-sided ionization cone in NGC 7172 using optical integral field unit (IFU) spectroscopy. It has a projected opening angle of approximately 120°. The southern part of the cone is brighter, which is consistent with the position of the main dust lane and with north being the near side of the galaxy (see Fig. 1, top panel). The size on this side of the cone is approximately 5″, which is equivalent to a projected physical size of 900 pc. Using spectroscopic observations with X-shooter on the Very Large Telescope (VLT), Davies et al. (2020) derived a velocity for the ionized gas outflow of ∼400 km s−1 and an outflow rate of 0.005 M⊙ yr−1. In this work, we present new band 7 ALMA observations of the CO(3−2) transition and the associated 854 μm continuum of the GATOS galaxy NGC 7172. The ALMA observations were taken with an angular resolutions of approximately 0.06″ and 0.3″, which correspond to 11 pc and 54 pc, respectively for the assumed distance. This allows us to resolve the morphology and kinematics of the cold molecular gas of both the nuclear and circumnuclear regions of this galaxy. This paper is organized as follows. Section 2 presents the ALMA band 7 CO(J = 3 − 2) and associated continuum observations as well as ancillary new VLT/SINFONI observations. In Sect. 3 we discuss the overall ALMA and SINFONI morphology and kinematics, while in Sect. 4 we model the ALMA CO(3−2) kinematics. In Sect. 5, we derive the properties of the torus of NGC 7172. Finally, in Sects. 6 and 7 we discuss the results of this work and present our conclusions, respectively.
2. Observations and data reduction
2.1. ALMA band 7
We observed the emission of the CO(3−2) and HCO+(J = 4 − 3) lines and their underlying continuum emission in the circumnuclear disk (CND) of NGC 7172 using the band 7 ALMA receiver and a single pointing (project-ID:#2019.1.00618.S; PI: A. Alonso-Herrero). Although the phase tracking center of the galaxy was assumed to be at right ascension and declination (RA2000, Dec2000) = (22h02m01.90s, −31°52′11.6″), the position of the AGN has nevertheless been reassigned through a comparison with the radio coordinates and a fit of the continuum emission, as detailed in Sects. 3.1 and 5, respectively. The ALMA field of view (FoV) of 17″ corresponds to the central 3.1 kpc region of the galaxy. We combined two sets of configurations of the ALMA array, namely, an extended (C43−7) and a compact (C43−4) configuration. The aim was to reach an angular resolution of  pc while keeping the largest angular scale recovered in our maps out to ∼3″ = 540 pc. This scale is enough to recover a sizeable fraction of the flux inside the FoV and image with high fidelity the torus and its connections with the CND region, which are relevant to this work. Observations required the execution of two scheduling blocks for the C43−7 configuration set conducted in July 2021 and one for the C43−4 conducted in October 2019, and the use of ∼43 − 44 antennas of ALMA.
We placed four spectral windows of 1.875 GHz-bandwidth, two in the lower side band (LSB) and two in the upper sideband (USB). This setup allowed us to observe the CO(J = 3 − 2) line (345.796 GHz at rest) and the continuum emission (344.0 GHz at rest) in the LSB bands, as well as HCO+(4−3) (356.734 GHz at rest) and the continuum emission (358.1 GHz at rest) in the USB bands. We calibrated the data making use of the ALMA reduction package CASA (McMullin et al. 2007)1.
In this work we make use of the line and continuum data sets from the compact, extended, and the merged configurations. The calibrated uv-tables of the merged configurations were exported to GILDAS2 to proceed with the continuum subtraction and imaging procedures, as detailed below. We first subtracted the continuum from each of the spectral (u, v) data sets using the GILDAS task UV-BASELINE. We fit a baseline to the (u, v) data sets through a polynomial of degree zero masking the line emission around each transition with a range of velocity widths ∼900 km s−1 and subsequently obtained continuum-free spectral line images for CO(3−2) and HCO+(4−3). An inspection of the HCO+ line data cube showed no significant emission inside the ALMA FoV. The estimated upper limit flux for this transition is 0.12 Jy km s−1, which provides a CO(3−2) to HCO+(4−3) ratio of > 1.4. The lower upper limit on the CO-to-HCO+ ratio is consistent with the values and upper limit measured in other GATOS Seyfert galaxies of similar Eddington ratios (García-Burillo et al. 2021).
In the rest of this work, we restrict our analysis and discussion to the CO(3−2) line data. We derived images of the continuum emission by averaging in each of the two subbands centered around spectral lines those channels free of line emission using the GILDAS tasks UV-FILTER and UV-CONT, making use of the same velocity width masks employed by the UV-BASELINE task. The four line-free continuum uv-tables were combined using the task UV-MERGE to obtain a genuine continuum image of the galaxy at an average frequency range ∼351.1 GHz or 854 μm (at rest).
For the merged data set, we obtained an angular resolution  pc by changing in the GILDAS task UV-MAP the robust parameter (b) to 1. The line data cubes were binned to a common frequency resolution of 7.8 MHz (equivalent to ∼6.8 km s−1 in band 7). We estimated that the flux accuracy is about 10−15%, comparable to the level of uncertainty of standard ALMA observations at the same range of frequencies. The point-source sensitivities in the line data cubes were derived by selecting areas free from emission in all channels. We summarize in Table 1 all the relevant parameters of the ALMA observations. We created CO(3−2) moment maps from the merged configuration data set using the GILDAS moment task with a 3σ clipping. We show the 0th, 1st, and 2nd moment maps in Fig. 1, while Fig. 2 show the 854 μm continuum maps of the central region observed with the compact and merged configurations. Additionally, in Sect. 4 we discuss the moment maps from the compact configuration.
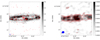 |
Fig. 2. ALMA band 7 observations. Left panel: in gray scale and contours is a zoom-in on the ALMA CO(3−2) intensity map of Fig. 1 (second panel from the top) showing the inner part of the cold molecular gas ring. The FoV matches that of the SINFONI observations (see Fig. 4). The gray bar shows the CO(3−2) intensity scale in Jy km s−1 beam−1. The red contours are the band 7 continuum map at 854 μm from the merged configuration, shown on a linear scale. The first contour is at three times the measured continuum rms of 17 μJy. The continuum beam (0.08″ × 0.06″ at PAbeam = 90.6°) is the blue filled ellipse in the bottom-left corner. Right panel: the gray scale map and the red contours are the compact configuration 854 μm continuum map, with the same FoV as in the left panel. The contours are on a linear scale. The continuum beam (0.34″ × 0.27″ at PAbeam = −78°) is the blue filled ellipse in the bottom-left corner. |
ALMA band 7 observations.
2.2. VLT/SINFONI
In this section we present new near-IR IFU spectroscopic observations obtained with the SINFONI instrument (Eisenhauer et al. 2003; Bonnet et al. 2004) at the VLT, as part of program 093.B-0057(B) (PI: R. Davies). NGC 7172 was observed during the nights of 16 and 20 July 2014. The H + K grating was used with laser guide star adaptive optics to achieve a spectral resolution R ≃ 1500 over a ≃3″ × 3″ FoV. A standard observing sequence of Object-Sky-Object was used with detector integration times of 300 (12 exposures) and 50 s (6 exposures) and small dithering between each Object exposure resulting in a total exposure time of 65 min.
The raw detector images were reduced with SPRED (Abuter et al. 2006), a custom data reduction package for SINFONI developed at MPE. SPRED performs all standard reduction steps needed to reconstruct NIR IFU cubes. We further used the MXCOR and SKYSUB routines (Davies 2007) to improve OH sky emission subtraction and LAC3D, a 3D version of LACOSMIC (van Dokkum 2001) to identify and remove bad pixels and cosmic rays. We removed atmospheric telluric features and flux calibrated the data based on observations of four B-type stars. A final additional step we implemented was the correction for differential atmospheric refraction which induces wavelength dependent spatial offsets. The custom procedure for this is described in Lin et al. (2018).
After the data reduction, the FoV of the SINFONI images is 3.9″ × 4.2″ with a pixel size of 0.05″. We estimated an angular resolution of the observations of ≃0.2″ full width at half maximum (FWHM), as measured from the K-band continuum image (see below) of the galaxy. For this study, we focus on two emission lines, namely, the coronal line [Si VI] at 1.96 μm to trace the ionized gas excited by the AGN (see, e.g., Müller-Sánchez et al. 2011; Ramos Almeida et al. 2017; Shimizu et al. 2019) and H2(1−0)S(1) 2.122 μm to trace the hot molecular gas emission. Before we fit these two emission lines in the SINFONI data cube, we modeled and removed the continuum using the Penalized Pixel Fitting tool (PPXF, see Cappellari & Emsellem 2004). We modeled the emission lines using a single Gaussian to derive the flux, velocity, and velocity dispersion (corrected for instrumental resolution) maps shown in Fig. 3.
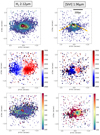 |
Fig. 3. VLT/SINFONI observations. From top to bottom, integrated flux (in arbitrary units), velocity (in km s−1), and velocity dispersion (in km s−1) maps of the H2 line at 2.12 μm (left panels) and [Si VI]λ1.96 μm line (right panels). In the top-right panel, the thick orange dashed lines indicate the approximate opening angle of the [O III]λ5007 ionization cone (Thomas et al. 2017). We note that in these SINFONI maps, the fitted emission does not fully cover the 3.9″ × 4.2″ FoV. The colors and the contours are on a linear scale. The (0, 0) point in all the panels corresponds to the peak of the SINFONI line maps. The hatched circle in the bottom-right panel shows the angular resolution (FWHM) of the observations. |
3. Morphology and kinematics
3.1. ALMA CO(3−2) and 854 μm emission
Figure 1 (second panel from the top) shows the ALMA CO(3−2) intensity map (moment 0) derived from the merged configuration data set. It maximizes the best angular resolution with the best sensitivity of our observations. The map displays approximately the full FoV of the observation along the RA direction. The CO(3−2) intensity map reveals a bright circumnuclear cold molecular gas ring with an approximate diameter of 6 − 8″ or 1.1−1.4 kpc, containing bright clumps. Beyond the ring, the CO(3−2) emission becomes more diffuse and covers the ALMA FoV along the east-west direction. The presence of this ring was already suspected from previous ALMA CO(2−1) images at lower angular resolution (see Alonso-Herrero et al. 2020). For a scale reference, the top panel of Fig. 1 displays the approximate FoV of the ALMA CO(3−2) image plotted as a red rectangle. The CO(3−2) emission clearly traces the prominent dust lane that crosses the (circum)nuclear region of the galaxy. In the innermost 4″, the CO(3−2) emission delineates the extinction in the ring derived from the VLT/SINFONI near-IR continuum and the narrow components of hydrogen recombination lines (see Fig. 6 of Smajić et al. 2012). The CO(3−2) morphology detected in NGC 7172 might correspond to an inner Lindblad resonance (ILR) and spiral arms associated to a nuclear bar. This CO(3−2) morphology appears to be similar to that of NGC 613 (Audibert et al. 2019), although observed at a higher inclination. In Sect. 4.3 we discuss further the ILR.
The ALMA 854 μm high-angular resolution image from the merged configuration data set (see Fig. 2, red contours in left panel) shows a continuum peak lying at the center of the CO(3−2) ring. The measured coordinates are RA = 22h02m01.89s and Dec = −31°52′10.49″ (2000), which agree well with those of the ALMA 1.3 mm peak emission (Alonso-Herrero et al. 2020) and the radio emission at 8.4 GHz (Thean et al. 2000). We thus assumed that this position corresponds to the nucleus of the galaxy, that is, it marks the AGN position. In the cold molecular gas ring, there is another bright 854 μm source, which is located to the southwest of the nucleus at an approximate projected distance of 0.5″. There is some faint continuum emission possibly connecting the two continuum sources. Other faint continuum peaks are also detected. Indeed, the lower angular resolution ALMA 854 μm map from the compact configuration (Fig. 2, right panel) shows both diffuse and compact continuum emission in the cold molecular gas ring. From ground-based subarcsecond resolution mid-infrared (mid-IR) imaging, there is a hint of the presence of the two bright sources detected at 854 μm, although the mid-IR emission is dominated by the AGN (see Roche et al. 2007; Asmus et al. 2016). The lower angular resolution Spitzer/IRAC 8 μm image (see García-Bernete et al. 2016) reveals emission along the molecular gas ring and again suggests the presence of mid-IR emission at an orientation of ∼ − 120°, likely arising from the two bright 854 μm sources emission.
The map of the CO(3−2) mean velocity (see Fig. 1, third panel from the top) from the merged configuration shows a rotation pattern. There are also clear distorsions in the velocity field, which might be in part due to the presence of an ILR in NGC 7172. However the clear departure from rotation in central region along the minor axis of the galaxy are indicative of the presence of radial motions. In Sect. 4, we perform a detailed modeling of the CO(3−2) kinematics and quantify the velocity and sign of these radial motions. The mean velocity dispersion map (see Fig. 1, bottom panel) shows a complex structure with several regions with velocity dispersions above 100 km s−1, whereas the most external parts of the disk probed by these observations show lower values, down to 5 − 10 km s−1.
3.2. VTL/SINFONI
To compare the VLT/SINFONI and ALMA maps, we first aligned them by assuming that the peak of the SINFONI emission line and continuum maps (the latter not shown here) and the ALMA 854 μm continuum emission coincide. This is justified since Smajić et al. (2012) showed that the peaks of the SINFONI near-IR continuum maps mark the position of the nucleus of the galaxy.
The overall SINFONI H2 2.12 μm morphology of the central ∼4″ × 4″ (top-left panel of Fig. 4), which is similar to the map from Smajić et al. (2012), shows two bright sources and diffuse emission which extends over larger scales coincident with the CO(3−2) ring. The brighest of the two H2 peaks arises from the nucleus, while the second peak lies close (in projection) and to the southwest of the AGN. The comparison of the SINFONI map with the ALMA CO(3−2) (bottom-left panel of Fig. 4) shows that the secondary H2 peak coincides with one of the bright CO(3−2) clumps in the ring of cold molecular gas as well as with an 854 μm continuum peak. It is also noticeable that there is bright H2 emission at the AGN position, while the CO(3−2) emission is fainter there, when compared to regions in the cold molecular gas ring. Bright H2 and faint CO(3−2) emission at the AGN position has been observed in other Seyfert galaxies, for instance, NGC 2110 (Rosario et al. 2019). Conversely, we do not detect bright H2 emission from other CO(3−2) clumps in the ring. Finally, the more diffuse H2 emission appears to be filling the region of the inner rim of the CO(3−2) ring but it also extends to the ring.
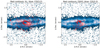 |
Fig. 4. Comparison of the ALMA and VLT/SINFONI observations. The blue color scale image is a zoom-in on the ALMA CO(3−2) intensity map of Fig. 1 with a FoV matching that of the VLT/SINFONI observations (see Fig. 3). The red contours are the H2 line at 2.12 μm (left panel) and [Si VI]λ1.96 μm (right panel), as Fig. 3. The (0, 0) position in all the panels corresponds to the peak of the SINFONI line maps as well as the ALMA 854 μm continuum. |
The extended emission from the SINFONI [Si VI]λ1.96 μm line map (top right panel of Fig. 3) shows the characteristic wide-angle ionization cone morphology, similar to that observed in the optical emission lines (Thomas et al. 2017). It is also mostly extended to the southeast and southwest of the AGN. Likely, the other side of the cone is obscured by the north rim of the ring, which also marks the near side of the galaxy. The projected size of the detected emission in this side is approximately 1.5″ ≃ 270 pc. This high-excitation line only traces the emission in the cone closest to the AGN and it is generally between the broad and the narrow line region (Müller-Sánchez et al. 2011). Indeed, the optical ionization cone traced by the optical [O III]λ5007 emission line is known to be extended over much larger scales (see Thomas et al. 2017). The second [Si VI] peak is seen close in projection to the AGN but it appears to be slightly displaced to the east with respect to the CO(3−2) and H2 clumps in the ring (Fig. 4).
The H2 kinematics (see Fig. 3, middle-left panel) shows a rotation pattern with some deviations along the minor axis of the galaxy, which are similar to those observed in the CO(3−2) mean velocity field. The [Si VI] velocity field (see Fig. 3, middle-right panel) also shows an apparent rotation pattern, although it can be seen that it is not exactly at the same orientation and velocity values as that of the H2 mean velocity field (see below). The presence of rotational + outflow motions in the coronal [Si VI] line has been inferred in other AGNs (Müller-Sánchez et al. 2011; Ramos Almeida et al. 2017). The velocity dispersion maps of the two lines are quite different. The H2 line (Fig. 3, bottom-left panel) shows, except at the AGN position, a mostly uniform distribution of with σ(H2)≃100 km s−1. These values are slightly higher than those measured in the central regions of other Seyfert galaxies (Hicks et al. 2009). The [Si VI] velocity dispersion map (Fig. 3, bottom-right panel), on the other hand, displays an interesting structure. In general, the measured values of the velocity dispersion indicate the presence of relatively broad lines near the AGN position with σ([SiVI]) = 400 − 600 km s−1 (FWHM = 900 − 1400 km s−1), which are indicative of the presence of an ionized gas outflow (see below). The exception is the region where the AGN wind appears to have impacted the disk of the galaxy, where the velocity dispersions are markedly decreased.
To evaluate the presence of noncircular motions in the H2 and [Si VI] velocity fields, we subtracted the stellar velocity field fitted with PPXF. The H2 velocity residual map shows (Fig. 5, left panel) red and blue excesses to the northeast and southwest, respectively. If these motions are taking place in the plane of the galaxy, they would indicate the presence of a molecular outflow in the galaxy disk, as the near side of the galaxy is to the north. Given the higher velocity resolution of the ALMA CO(3−2) observations, in Sect. 4 we model the kinematics of this molecular gas transition to separate the rotation from the noncircular motions. The [Si VI] velocity residual map (see Fig. 5, right panel), on the other hand, displays mostly blueshifted velocities of a few hundred km s−1 in the southern part of the ionization cone out to ∼200 pc (in projection) from the AGN. These noncircular motions together with the large FWHM of the lines fitted in the same region can be interpreted as an ionized gas outflow outside the plane of the galaxy. It likely traces the inner part of the larger scale outflow detected in the [O III]λ5007 emission line (Thomas et al. 2017; Davies et al. 2020). The milder red residual velocities of the [Si VI] line to the southwest of the AGN are associated with the brightening of the line described above, which probably indicates that the AGN is illuminating a clump of gas in the disk of the galaxy rather than in the ionized gas outflow region. The redshifted velocities might indicate outflowing motions in the disk of the galaxy.
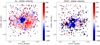 |
Fig. 5. VLT/SINFONI velocity fields of the H2 line at 2.12 μm (left panel) and the [Si VI]λ1.96 μm line (right panel) after subtracting the stellar velocity field fitted with PPXF. The (0, 0) position in all the panels corresponds to the peak of the SINFONI line map. The units of the color bars are km s−1. |
4. Modeling of the ALMA CO(3−2) kinematics
In this section we model the ALMA compact configuration CO(3−2) kinematics of NGC 7172 with the 3DBAROLO code (Di Teodoro & Fraternali 2015). The angular resolution of these observations (see Table 1) allows to resolve the kinematics on physical scales of ∼54 pc. This code fits simple rotating disk models using 3D tilted rings and can be used with a variety of emission line data, including ALMA data cubes.
4.1. Rotating disk
3DBAROLO can fit a number of free parameters for a rotating disk model, including the kinematic center, the systemic velocity, the disk inclination (i) and position angle (PA) of the kinematic major axis, the scale height of the disk, the circular velocity, and the gas velocity dispersion (σgas). It also takes into account effects related to the beam smearing in the definition of the best-fit model for a given spatial resolution. 3DBAROLO also produces maps of the observed velocity-integrated intensity (moment 0), a map of the observed mean velocity field (moment 1) and velocity dispersion field (moment 2), as well as position-velocity (p − v) diagrams along the kinematic major and minor axes. Before we started the fits, we trimmed the original compact configuration data cube to the FoV with detected emission, ∼20.9″ × 4.6″.
Figure 6 shows the ALMA CO(3−2) observed moment maps of NGC 7172. The intensity, velocity, and velocity dispersion maps are similar to those in Fig. 1, considering the difference in angular resolution. The CO(3−2) mean velocity field shows a general rotation pattern. However, some important distorsions are readily seen in the molecular gas ring, which are accompanied by the presence of high velocity dispersion values, especially along the east-west direction in the disk of the galaxy. The CO(3−2) velocity dispersions show relatively large values of up to ∼100 km s−1 in the ring, whereas in the outer parts of the disk mapped with ALMA the velocity dispersions decrease to ∼5 km s−1.
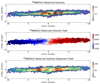 |
Fig. 6. 3DBAROLO observed moment maps. From top to bottom, ALMA CO(3−2) maps of the observed velocity-integrated intensity (moment 0), observed mean velocity field (moment 1), and velocity dispersion field (moment 2), produced with the compact configuration observations using 3DBAROLO. All the contours are on a linear scale. The ALMA beam (not shown) is 0.34″ × 0.27″ at PAbeam = −74.9°. The units of the velocity and velocity dispersion maps are km s−1. In the top panel, the star marks the approximate location of the AGN. |
For all the 3DBAROLO fits, we fixed the kinematic center at the position of the 854 μm continuum peak (see Sect. 3.1) and used a disk Gaussian scale height of 0.05″ (≃10 pc, equivalent to a 24 pc FWHM at the assumed distance). Since NGC 7172 is seen at a high inclination (see below), this relatively thin disk is needed to avoid mixing the different emitting regions in our line of sight. We took a radial separation between the rings of 0.125″ and a total of 70 rings, thus reaching out to radial distances of approximately 8.75″ (≃1.6 kpc). Given the high inclination of NGC 7172, we first measured it from the apparent relative size of the cold molecular gas ring, assuming that it has a circular shape. We obtained i = 85°, which we allowed to vary by a few degrees during the fit. The observed PA of the CO(3−2) kinematics appears to be close to the east-west direction, as found for the optical emission lines (Thomas et al. 2017). We thus allowed our fit to vary this parameter by 10°. During the first step, we fit five parameters, namely, i, PA, systemic velocity, circular velocity, and σgas. For the last parameter we imposed a minimum value of 5 km s−1, as seen in the observations.
We derived a systemic velocity of 2532 km s−1 and an average value of the inclination of i = 88°. Figure 7 shows the best-fit model CO(3−2) mean velocity field (top panel) and the CO(3−2) mean velocity residuals (bottom panel), which were computed by subtracting the model velocity from the observed velocity field. There are velocity residuals of a few tens to ≃100 km s−1, in the central region and in the outer parts of the galaxy disk. To understand better the mean velocity residuals, we produced p − v diagrams along the kinematic major and minor axes of the galaxy. The observed p − v diagram along the kinematic major axis (Fig. 8, top panel, gray scale map and blue contours) has a tilted X-shape, which is the result of beam smearing and the ring-like structure of the highly inclined disk of NGC 7172. The 3DBAROLO rotating disk model (red contours in Fig. 8) produces a reasonably good fit to this p − v diagram. However, the fitted rotation curve (yellow dots in the figure) does not reach the terminal velocity at radial distances r ∼ 3 − 6″ and is not well fitted in the innermost regions. Both are in part responsible for the large velocity residuals seen in Fig. 7 (bottom panel). Along the kinematic minor axis (Fig. 8, bottom panel), there are clear noncircular motions in the central 2″ that we address in the see next section.
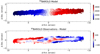 |
Fig. 7. Velocity map of the 3DBAROLO rotating disk model without a radial velocity component fitted to the ALMA CO(3−2) observations (top) and residual velocity map (bottom). The latter was computed by subtracting the 3DBAROLO model from the observed moment 1 map. |
4.2. Rotating disk with radial velocity
Within the approximate inner 2″, the minor axis p − v diagram shows redshifted motions to the south of the AGN and blueshifted to the north (see Fig. 8, bottom panel). Since the north is the near side of the galaxy (see the top panel of Fig. 1), this suggests the presence of an outflow in the cold molecular gas ring, if these motions are taking place in the plane of the galaxy. We thus run another 3DBAROLO model including a radial velocity (vrad) component. We fixed the inclination to the average value from the previous run and the derived systemic velocity. We also fixed the rotation curve to agree better with the observed p − v diagram along the major axis. We therefore left PA, σgas, and vrad as free parameters.
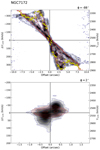 |
Fig. 8. ALMA CO(3−2) p − v diagrams generated with 3DBAROLO along the kinematic major (top panel) and minor (bottom panel) axes. The gray scale and blue contours are the ALMA CO(3−2) observations, while the red contours are the 3DBAROLO rotating disk model. The yellow dots are the fitted rotation curve. |
We show the resulting mean velocity model and velocity residual map in Fig. 9 (top and bottom panels, respectively). It is immediately clear from the comparison with Fig. 7, that the 3DBAROLO model with the fixed rotation curve and the radial velocity component produces a better fit to the observations. The effect of including the latter is appreciated in the CO(3−2) p − v diagram along the kinematic minor axis (see Fig. 10). However, even when including radial velocities, the model does not reach the observed velocity of nearly +150 km s−1 to the south, close to the AGN position. The maximum fitted radial velocities are 80 − 100 km s−1 (see the bottom panel of Fig. 11), progressively decreasing to ≃20 − 30 km s−1 out to a radial distance of ≃4.5″. This deceleration might be due to the AGN wind encountering large amounts of molecular gas. The bright peaks of H2, CO(3−2), and 854 μm emission in the ring (see Sect. 3) might be caused by this impact. Within the gas ring, the gas velocity dispersion takes values of approximately σgas ≃ 10 km s−1, except in the region with the largest radial velocity values (see the middle panel of Fig. 11) where the gas dispersion is slightly lower. At r > 4.5″, the velocity dispersion goes down to the minimum value imposed in our fit (σgas = 5 km s−1).
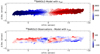 |
Fig. 9. Velocity map of the 3DBAROLO rotating disk model with a radial velocity component and residual velocity map. Panels are the same as in Fig. 7. The star symbol shows the approximate location of the AGN. |
 |
Fig. 10. ALMA CO(3−2) p − v diagrams generated with 3DBAROLO. Panels, colors, and lines are the same as Fig. 8, but for the 3DBAROLO disk model with a radial velocity component. The yellow dots in the top panel are the fixed rotation curve used for this model. |
Despite having included a radial velocity component in the 3DBAROLO model, there are still some CO(3−2) mean velocity residuals in some regions of the map (Fig. 9, bottom panel). Some are beyond the expected virial motions around rotation of typically a few tens of km s−1. In the central 2″ of NGC 7172, there are two regions with moderate velocity residuals of the order of 50 km s−1, which are redshifted to the southwest of the AGN and blueshifted to the northeast. They appear to be coincident with those regions where the innermost part of AGN wind, traced by the VLT/SINFONI [Si VI] emission (see left panels of Fig. 4), impacts the inner part of the cold molecular gas ring. Even though at the radial distances of these regions we fit the largest values of the radial velocities (bottom panel of Fig. 11), the residuals mean that this azimuthally averaged model cannot explain completely the observed kinematics. In fact, these distinct velocity residuals also define kinematically the expanding molecular ring with a diameter of ∼6″ or approximately 1.1 kpc. The residual mean velocities are not only confined to these regions, but there are some residuals beyond the molecular ring, mostly to the northeast.
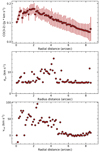 |
Fig. 11. Radial profiles of the ALMA CO(3−2) median intensity (top panel), gas velocity dispersion (middle panel), and radial velocity (bottom panel) fitted with the 3DBAROLO model in Sect. 4.2. As explained by García-Burillo et al. (2019), the vertical error bars in the integrated CO(3−2) emission reflect the deviations from symmetry in the gas distribution. |
We note that the 3DBAROLO tool does not take into account the potential contribution from other terms of the Fourier decomposition of noncircular motions. These include tangental motions or higher order terms that could improve the quality of the fit (Schoenmakers et al. 1997). The missing terms, which can capture better the density wave streaming motions produced by a stellar bar, are in principle more suitably accounted for by tools like kinemetry (Krajnović et al. 2006). This is particularly clear in those cases where the mean velocity fields provide a realistic description of the gas motions, that is, in galaxy disks seen at favorably low inclinations3. García-Burillo et al. (2019) benchmarked the solutions found by 3DBAROLO against the output provided by kinemetry for the disk of NGC 1068, which is seen at i ≃ 41°, and concluded that there is an overall excellent agreement in the sign and magnitude of the vrad radial profiles derived by the two modeling tools, in spite of their different working approaches.
In this context, it is worth recalling that in all realistic gas configurations for the gas response to a stellar bar inside its corotation (see Sect. 4.3, for a discussion of an alternative scenario), the average value of the vrad term should reflect prevalent inward radial motions along the bar leading edges and down to the ILR ring. These motions are due to the orbit crowding of precessing individual elliptical orbits (see e.g., Wong et al. 2004; García-Burillo et al. 2014, 2019). In particular, for the case of a spiral-like pseudo-ring formed outside and down to the ILR, gas motions should be dominated either by inflow or, in the case of a circular ring by no-flow at all (see e.g., Wong et al. 2004). Other orbit configurations not contemplated in the models published by Wong et al. (2004) cannot be formally excluded, like those related to the presence of a nuclear bar or episodic leading gas spirals. However, there is no evidence for any of these in NGC 7172. Moreover, the fact that the sign of ⟨vrad⟩(r) in the central ≃700 pc of NGC 7172 is reversed relative to the basic theoretical expectation (i.e., no flow ⟨vrad⟩ = 0 or inflow based on the sign of ⟨vrad⟩) suggests that there is a (true) radial (out)flow component superposed to the usual terms that could be potentially attributed to bar-driven noncircular motions in these regions. This is similar to the scenario described by García-Burillo et al. (2014, 2019) for NGC 1068, where the presence of the molecular outflow was unambiguously detected by a clear reversal of the s1 term in the Fourier decomposition of the velocity field of the gas in the inner region of the galaxy disk. Both 3DBAROLO and the Fourier decomposition done by kinemetry capture this signature of the outflow, that is, the sign reversal of radial motions (García-Burillo et al. 2014, 2019).
4.3. Signatures of an ILR in the observed CO(3−2) kinematics
In Sect. 3.1 we proposed that the conspicuous ring morphology displayed by the CO(3−2) merged configuration emission might be explained in terms of the canonical gas response to an ILR of a stellar bar (Buta & Combes 1996). The existence of a large-scale stellar bar in NGC 7172 is still debated. Based on the modeling of the near-IR 2MASS isophotes, Menéndez-Delmestre et al. (2007) reported the existence of a large-scale bar (PA = 96° and a semi-major axis of abar = 45″ ≃ 8 kpc), while Lin et al. (2018) did not require one. However, the noncircular motions of the molecular gas revealed by the CO data in the central ≃1 − 1.5 kpc of the galaxy disk might be reflecting the influence on the gas kinematics of a (not yet observed) nuclear bar located within the large-scale stellar bar. This scenario is explored in detail in the numerical simulations of Appendix A. To explain the observed CO(3−2) molecular ring size, the radius of this putative nuclear bar needs to be significantly smaller, of the order of r = 2 kpc, than that of Menéndez-Delmestre et al. (2007).
As illustrated in Appendix A, the observed S-shape of the CO(3−2) mean velocity field and the outflow signature along the minor axis could be reproduced reasonably well by selecting a favorable phase angle of a nuclear bar in the plane of the galaxy (see Figs. A.3 and A.4). These noncircular motions reflect the projection of elliptical streamlines corresponding to the x1 orbits building the potential of the nuclear bar. In particular, a good correspondence with the data requires that the 2 kpc-semi-major axis nuclear bar is seen at a moderate inclination (i = 60°). This is nevertheless in stark contrast with the high value of the inclination needed to fit the CO(3−2) kinematics with 3DBAROLO. Furthermore, in these simulations the observed CO(3−2) morphology appears as a result of the pile-up of gas in a highly elliptical ring at the location of a single ILR. The nuclear bar in these simulations is a “fast” m = 2 mode. As a result, there is little room for x2 orbits, which are only present when there are two distinct ILRs. This physically possible, yet limit case, configuration has two implications. First, the gas piles up at a highly elliptical ILR ring and, secondly, the x1 orbits do not precess into x2 orbits and, as a consequence, the formation of the canonical bar leading edges feature – favoring the scenario described in Sect. 4.2 – would be thwarted.
While the configuration described above and in Appendix A for a putative nuclear bar is an alternative interpretation for the observations, the lack of any direct evidence of its existence disfavors this scenario versus the AGN-driven outflow scenario we discuss in Sect. 6.
5. The torus of NGC 7172
The first ALMA detection of an AGN torus was for the Seyfert galaxy NGC 1068 (e.g., García-Burillo et al. 2016, 2019; Gallimore et al. 2016; Imanishi et al. 2018; Impellizzeri et al. 2019). The NGC 1068 torus is a multiphase structure with diameters in the 7 − 40 pc range, depending on the molecular transition and the cold dust continuum. In other nearby AGNs, ALMA high-angular resolution (typically less than 0.1″) observations of the cold dust and molecular gas have proven to be the most efficient way to resolve molecular dusty tori. In the approximately twenty detections reported so far, the tori/disks are found to be relatively large, with diameters 20 − 130 pc, and masses in the 105 − 107 M⊙ range in Seyfert galaxies (Izumi et al. 2018; Alonso-Herrero et al. 2018, 2019; García-Burillo et al. 2021) and low-luminosity AGNs (Combes et al. 2019). Moreover, the molecular gas column densities at the AGN location appear to be broadly correlated with the X-ray absorptions NH, but physical resolutions of the order of 10 pc are needed to reach the relevant scales responsible for AGN obscuration (Alonso-Herrero et al. 2018; García-Burillo et al. 2021).
The left panels of Fig. 12 show the observed 854 μm continuum of the central 0.4″ × 0.4″ (approximately 72 pc × 72 pc) for the observations with the highest angular resolution (extended configuration, top panel) and the intermediate resolution (merged configuration, bottom panel). The corresponding physical resolutions are approximately 11 pc and 13 pc, respectively. From the comparison with the beam of the merged configuration observations, it is immediately clear that the continuum emission is extended. In the bottom panels of this figure we marked the extent of the torus with a blue dashed ellipse, which traces approximately the 3 × rms contour (see below). The orientation of this extended emission appears to be nearly perpendicular to the [Si VI]λ1.96 μm emission, which indicates that it is likely tracing equatorial emission in the dusty torus. The aspect ratio of the 854 μm emission (before the point-source subtraction, see below) implies a torus inclination of approximately itorus = 67°. In fact, this needs to be taken as an upper limit because the torus is likely to have some thickness. Nevertheless, this estimate is in good agreement within intermediate inclinations inferred from the fitting of the infrared and X-ray emission with torus models for NGC 7172 (Ramos Almeida et al. 2009, 2011; Alonso-Herrero et al. 2011; Ichikawa et al. 2015; Vasylenko 2018; Tanimoto et al. 2020). The derived torus radius is approximately 0.18″ ∼ 32 pc, which is within the range observed for other Seyfert galaxies and low-luminosity AGNs (Alonso-Herrero et al. 2018; Combes et al. 2019; García-Burillo et al. 2021).
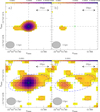 |
Fig. 12. Central 0.4″ × 0.4″ region showing the ALMA 854 μm emission. Top panels: observed (left panel) and point-source subtracted (right panel) images from the extended configuration data set. Lower panels: same as the upper panels, but for the merged configuration. The dashed blue ellipse marks the approximate extent of the torus. In all the panels, the first contour is at 3 × rms. The gray ellipses represent the corresponding observation beams. |
Nevertheless, as found in other Seyfert galaxies, it is likely that even at 854 μm there is some contribution from synchrotron emission (Pasetto et al. 2019; Alonso-Herrero et al. 2019; García-Burillo et al. 2019, 2021). We followed a slightly modified version of the method described by García-Burillo et al. (2021) to fit the unresolved emission, which is assumed to provide an upper limit to the synchrotron emission. Briefly, we started by fitting the extended configuration 854 μm continuum map with a point source with the observation beam size and orientation, and an elliptical component. The estimated unresolved flux is 520 μJy. We then subtracted the point-source fit from the observations. The point-source subtracted image (Fig. 12, top-right panel) shows no emission residuals at the AGN position, that is, all the observed emission at this angular resolution is unresolved. Next, we generated a point source image corresponding to the beam of the merged configuration data set, scaled it to the point source flux from the previous step, and subtracted it from the observations.
The 854 μm point source subtracted image shows significant extended emission at the 3 to 5 × σ levels, whereas at the AGN position there is no residual emission (bottom-right panel of Fig. 12). The measured fluxes are 877 μJy for the point + extended emission and 364 μJy after the point source subtraction. The extended emission therefore accounts for approximately 42% of the observed flux within r = 32 pc and can be associated with cold dust emission in the torus. It is likely that the point source is oversubtracted since in the first step we assumed that all the unresolved emission within the 11 pc beam of the extended configuration is produced by synchrotron emission. Higher angular resolution observations demonstrate that at this far-IR wavelength, the synchrotron emission is confined to regions of only a few parsecs in size (see García-Burillo et al. 2019, 2021, and in prep.).
We estimated the torus gas mass using the 854 μm extended emission flux and assuming Tdust ≃ Tgas = 100 K, a dust emissivity value of κ351 GHz = 0.0865 m2 kg−1 (Klaas et al. 2001), and a gas-to-dust ratio of 100. We obtained  . For comparison, we integrated the CO(3−2) flux within the torus radius of 32 pc and its derived inclination (see Table 2), using the same assumptions as in Sect. 6.1. For this estimate, we took the brightness temperature ratio measured in the NGC 1068 torus, TBCO(3−2)/TBCO(1−0) = 2.9 (García-Burillo et al. 2014). We derived a cold molecular gas in the torus of
  , in excellent agreement with the value estimated from the cold dust emission. It is also within the range of torus masses inferred in other Seyfert galaxies (García-Burillo et al. 2021). We measured an H2 column density at the AGN position of log(NH2) = 22.34 mol cm−2, which agrees well the observed values in other GATOS Seyfert galaxies with similar AGN luminosities (see Fig. 19, right, from García-Burillo et al. 2021).
Nuclear and circumnuclear cold molecular gas properties.
6. Discussion
In Sect. 4.2, we showed that the CO(3−2) minor axis p − v diagram (Fig. 10) goes across significantly strong emission from the ring. Under the commonly assumed hypothesis that the bulk of molecular gas shares a coplanar geometry, the vrad term is the only component of gas motions that has a nonzero projection along the disk minor axis. If the molecular gas is following circular orbits, for the known orientation of the galaxy, the derived sign of the radial velocity from the global 3DBAROLO best fit to the CO(3−2) data cube implies the presence of a prevalent outward radial component throughout the ring region and out to r ≃ 700 pc in the disk. In this section, we derive the properties of this molecular outflow, compare them with those of the ionized outflow, and look for evidence of the impact of the outflow on molecular gas in the nuclear regions of NGC 7172.
6.1. Properties of the cold molecular gas outflow
Stone et al. (2016) also found tentative evidence for the presence of a molecular outflow in NGC 7172, using ∼10″ resolution Herschel/PACS observations of the OH 119 μm absorption feature. They measured an approximate blueshifted velocity of 50 km s−1 of the OH feature, which the authors considered just at the limit of their outflow detection criterion. This value of the OH velocity is similar to the typical value of the CO(3−2) radial velocity fit with 3DBAROLO in the molecular gas ring (see bottom panel of Fig. 11). In the particular case of NGC 7172, the detection of the OH outflow was probably aided by the fact that the outflow is observed close to our line of sight.
To compute the properties of the CO(3−2) molecular outflow, we assumed a simple shell geometry so that the mass outflow rate can be written as: dMgas/dt = Mgas × vout/R (Maiolino et al. 2012; Lutz et al. 2020), where Mgas is the mass of molecular gas, vout is the outflow velocity, and R is the size of the outflow region. For a coplanar geometry for the molecular outflow, the outflow velocity is vout = vrad. To derive the molecular gas mass, we used Eq. (3) in Bolatto et al. (2013) with a CO-to-H2 conversion factor of XCO = 2 × 10²⁰ mol cm−2 (K km s−1)−1. This expression includes the helium correction. To obtain the CO(1−0) intensity, we took a typical ratio of the brightness temperature in galaxy disks of TBCO(3−2)/TBCO(1−0) = 0.7 (see García-Burillo et al. 2021, and references therein). We integrated the CO(3−2) flux in the ring (within R = 4″ ≃ 720 pc, see Table 2), which provides a molecular gas mass of Mgas = 6 × 10⁸ M⊙, and taking an average value of the outflow velocity of 46 km s−1. We inferred a mass outflow rate of 40 ± 18 M⊙ yr−1, assuming that the main source of uncertainty in this calculation comes from the fitted radial velocities.
6.2. Coupling between the AGN wind and the disk of the galaxy
The molecular gas mass outflow rate of NGC 7172 derived in the previous section is large compared with the modest ionized gas mass outflow rate of 0.005 M⊙ yr−1 (Davies et al. 2020). Interestingly, even though the Seyfert galaxies in their sample have similar AGN luminosities, NGC 7172 has one of the lowest ionized mass outflow rates. This together with the observed scatter of the so-called AGN-wind scaling laws might imply that AGN luminosity is not the only physical quantity explaining the different gas phases of outflows in active galaxies (Fluetsch et al. 2019; Davies et al. 2020). On the other hand, our results indicate that NGC 7172 follows well the trend between LAGN and molecular gas mass outflow rate found by Lutz et al. (2020) for a compilation of local infrared bright galaxies, gray points in Fig. 13. We note however that other works, such as Ramos Almeida et al. (2022) and Lamperti et al. (2022), do not find tight correlations between these quantities for samples of type 2 quasars (QSO2s) and local ULIRGs classified as AGNs, red triangles and orange squares, respectively.
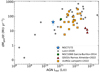 |
Fig. 13. Molecular gas mass outflow rate versus AGN bolometric luminosity of NGC 7172 compared with the compilation of infrared bright galaxies from Lutz et al. (2020) except for NGC 1068 which is from García-Burillo et al. (2014), QSO2s from Ramos Almeida et al. (2022), and local ULIRGs classified as AGNs from Lamperti et al. (2022). For these comparison samples, we only plot galaxies with detections in both axes. |
In simulations of AGN winds in disk galaxies, the outflows are predicted to escape along the path of less resistance and thus are not able to unbind completely a molecular disk (see for instance, Faucher-Giguère & Quataert 2012). However, outflows are predicted to be able to sweep up part of the material in a galaxy disk, but at much lower velocities than the initial AGN wind, which can be favored with a good geometrical coupling. An illustration of the idea of the geometrical coupling can be found in Fig. 4 of Ramos Almeida et al. (2022). Observationally, the scarcity of strong molecular outflows in several Seyfert galaxies (Domínguez-Fernández et al. 2020), QSO2s with AGN-driven winds (Ramos Almeida et al. 2022), and local ULIRGs classified as AGNs (Lamperti et al. 2022) has been explained due to the lack of a geometrical coupling.
The derived torus inclination of NGC 7172 is ∼61 − 67° (see Sect. 5), while the molecular gas ring is seen almost edge-on (see Sect. 4). The inclination (presumably perpendicular to the torus) and wide opening angle of the ionization cone of NGC 7172 (Thomas et al. 2017) therefore allow for a relatively strong geometrical coupling between the AGN wind and the galaxy interstellar medium (ISM), thus favoring the molecular outflow in the ring. The good spatial correspondence between the CO(3−2), near-IR H2 and continuum 854 μm bright knot in the ring to the southwest of the AGN, and the edge of the ionization cone traced by the VLT/SINFONI [Si VI] emission (Sect. 3 and Figs. 2 and 4) add support to this scenario. At this particular location of the NGC 7172 ring (also on the other side, to the northeast of the AGN), it is likely that the impact with material in the ring caused a strong deceleration of the AGN wind and subsequently in the outflow velocity of the molecular gas, as seen in Fig. 11 (bottom panel). Indeed, in Davies et al. (2020) sample, NGC 7172 is among the Seyfert galaxies with the lowest velocities of the ionized gas, thus providing further evidence to the above scenario.
6.3. Radio emission
A radio jet, even with low power, running through a galaxy can interact with its ISM and entrain molecular gas in the galaxy disk. Moreover, in simulations the geometrical coupling between radio jets and the ISM of Seyfert galaxies, including its molecular gas phase, has been found to be an important factor (Mukherjee et al. 2018; Talbot et al. 2022). Evidence of the interaction of radio jets with the galaxy ISM has been observed in a few nearby Seyfert galaxies (see, e.g., García-Burillo et al. 2014; Morganti et al. 2015; Pereira-Santaella et al. 2022; Peralta de Arriba et al. 2023).
In this section we discuss the possibility that a low-power radio jet might be driving, at least in part, the molecular outflow observed in NGC 7172. The moderate angular resolution VLA 8.4 GHz observations of Morganti et al. (1999) revealed bright nuclear emission as well as extended emission along the major axis of the galaxy. This extended emission likely corresponds to the molecular ring detected with our ALMA observations. Subsequent VLA observations at subarcsecond resolution showed again nuclear point-like emission and some faint radio emission to the northeast and southwest of the AGN with an approximate 2″ extent (Thean et al. 2000). The orientation of this faint extended radio emission, especially to the southwest, resembles that of the [Si VI] emission (see Fig. 8 of Smajić et al. 2012).
We estimated a jet power of Pjet ∼ 1043 erg s−1 for NGC 7172, using the relation given by Bîrzan et al. (2008) and the 8.4 GHz flux density quoted in Thean et al. (2000), assuming a power law fν ∝ ν−1 to derive the 1400 MHz flux density. The kinetic luminosity of the molecular outflow can be computed as:  (García-Burillo et al. 2014). We obtained Lkin ∼ 3 × 1040 erg s−1. If indeed, there is a radio jet in NGC 7172, it could in principle provide sufficient power to drive the molecular outflow in this galaxy. However, sensitive radio observations at higher angular resolution are needed to confirm this.
6.4. Feedback in the molecular gas ring of NGC 7172
In nearby active galaxies, feedback can manifest itself in various manners, including suppressing star formation (Gao et al. 2021), triggering star formation (Cresci et al. 2015; Maiolino et al. 2017; Bessiere & Ramos Almeida 2022; Bellocchi et al. 2023), as well as redistributing the molecular gas in galaxy disks (Alonso-Herrero et al. 2018; Shimizu et al. 2019; García-Bernete et al. 2021; Ramos Almeida et al. 2022). In a sample of GATOS Seyfert galaxies, García-Burillo et al. (2021) observed a clear imprint left by the AGN wind on the molecular gas at torus and nuclear scales, with a decreased molecular gas surface density compared to that on circumnuclear scales (r = 200 pc) in Seyfert galaxies with the highest AGN luminosities and/or Eddington ratios.
To evaluate the level of clearing of molecular gas in the torus and nuclear regions of NGC 7172, we measured the cold molecular gas surface densities (Σ) on different scales using the CO(3−2) fluxes reported in Table 2. We computed two cold molecular gas concentration indices defined by García-Burillo et al. (2021), namely, Index-1 = 
 and Index-II =
  . The main difference between these two concentration indices in NGC 7172 is driven by the different inclinations used for the torus and the r = 50 pc scales and the different temperature brightness ratios (see Table 2). The circumnuclear r = 200 pc scale does not encompass the entire ring at all. Increasing the size of the circumnuclear region to include the ring gives a concentration index of
  .
.
The comparison of the two molecular gas concentration indices of NGC 7172 with the sample of low-luminosity AGNs and GATOS Seyfert galaxies (Fig. 18 of García-Burillo et al. 2021) indicates that NGC 7172 follows well the observed trends for the two physical scales of the torus and its immediate surroundings. That is, there is a redistribution of the molecular gas in the torus and nuclear regions of NGC 7172 when compared to other less luminous Seyfert galaxies and AGNs. For this comparison, we used an absorption-corrected 2 − 10 keV luminosity of log L(2 − 10 keV) = 42.84 erg s−1 (Ricci et al. 2017, recalculated for the assumed distance in this work) and an Eddington ratio of ∼0.02 (Vasudevan et al. 2010).
NGC 7172 shows molecular gas concentration indices similar to NGC 3227 and NGC 4388, which also show evidence for the presence of (circum)nuclear local outflows (Alonso-Herrero et al. 2019; Domínguez-Fernández et al. 2020; García-Burillo et al. 2021). However, despite the clear evidence for the presence of a large-scale (out to r ∼ 4″ ∼ 720 pc from the AGN) outflowing ring in NGC 7172 (see Sect. 6.1), it does not seem to present an extreme behavior in these relations. In other words, NGC 7172 does not show a markedly strong deficiency of cold molecular gas in its nuclear regions, as seen for instance in NGC 1068, even though both show comparable molecular gas outflow rates. One possible explanation is that the AGN wind is more collimated and faster in NGC 1068. Indeed, this galaxy shows an ionized gas outflow velocity of up to 1000 km s−1 (García-Burillo et al. 2019), which is about 2.5 times faster than that in NGC 7172 (Davies et al. 2020). Furthermore, the velocities of the molecular gas outflow in NGC 1068 are 100 − 150 km s−1 (see García-Burillo et al. 2019), thus about a factor of 2 − 3 faster than those in the outflow of NGC 7172. This likely resulted in a more efficient clearing of the molecular gas in the nuclear region of NGC 1068 compared to NGC 7172.
We finally explore the fate of the circumnuclear molecular gas in NGC 7172 since its mass outflow rate appears to be at the high end of those observed in other AGNs of similar luminosity (Fig. 13). On the other hand, the velocity of the molecular outflow of NGC 7172 is modest when compared with the galaxy circular velocity. In Appendix B we modeled the escape velocity in NGC 7172 using the 3DBAROLO rotation curve. At a radial distance of 900 pc, just outside of the outflow region, the escape velocity is 850 km s−1, whereas at smaller radial distances this velocity is even higher (see Fig. B.1). Given that the molecular outflow is taking place mostly in the disk of the galaxy and its velocity is low with respect to the expected escape velocity, we can therefore conclude that in this galaxy most of the molecular gas will not leave the galaxy, at least during this period of AGN activity.
7. Summary and conclusions
We presented new ALMA band 7 observations of the CO(3−2) transition and associated 854 μm continuum, together with new VLT/SINFONI observations of NGC 7172. This is a nearby (d = 37 Mpc) luminous Seyfert galaxy in the GATOS sample with an AGN bolometric luminosity of 1.3 × 1044 erg s−1 (Davies et al. 2015). The angular resolutions of the ALMA observations (0.06 − 0.3″) allowed us to probe regions on physical scales of 11 − 56 pc.
The ALMA CO(3−2) intensity maps show the presence of a highly inclined (i ≃ 85 − 87°) cold molecular gas ring with an approximate radius of 3 − 4″ ≃ 540 − 720 pc, likely associated with an ILR. There is also extended emission along the disk of the galaxy covering the FoV of the ALMA observations along the east-west direction. This ring is also detected at 854 μm and appears to trace the strong dust lane that crosses the (circum)nuclear region of NGC 7172. The cold molecular gas mass of the ring is ≃6.2 × 10⁸ M⊙. The ALMA 854 μm continuum emission and the VLT/SINFONI H2 at 2.12 μm and [Si VI]λ1.96 μm line maps peak at the AGN position (see Smajić et al. 2012, for a detailed discussion of previous SINFONI results). The CO(3−2) map, on the other hand, shows the brightest emission in several clumps in the ring. There are also secondary H2 and 854 μm peaks, which additionally coincide with one of the bright CO(3−2) clumps in the ring. They all are located close to the edge of the inner ionization cone delineated by the [Si VI] line emission.
The velocity fields of [Si VI], H2, and CO(3−2) show clear evidence for the presence of noncircular motions. After subtraction of the stellar velocity field, the velocities of the ionized gas, traced with the [Si VI]λ1.96 μm line, are blueshifted a few hundred km s−1 in a region to the south of the AGN position. We interpreted this as ionized gas outflowing outside the plane of the galaxy out to projected distances of ≃200 pc. This emission likely corresponds to the inner part of the larger ionized gas cone and outflow detected in [O III]. The CO(3−2) p − v diagram along the kinematic minor axis reveals the presence of noncircular motions of the cold molecular gas with observed velocities of up to ∼150 km s−1. These are blueshifted to the north of the AGN and redshifted to the south. Since the north side of the galaxy is the near side, these noncircular motions imply the presence of a molecular outflow in the plane of the galaxy.
A 3DBAROLO model of a rotating disk with a radial velocity component reproduces reasonably well the complicated CO(3−2) kinematics observed in NGC 7172. We note that we also discussed an alternative scenario in which the noncircular motions could be the result of a nuclear bar (see Appendix A). However, the most plausible explanation for the observed CO(3−2) kinematics indicates that the entire ring is not only rotating but also outflowing. The largest values of the fitted radial velocity take place close to the AGN with a gradual deceleration, which is probably caused by the impact of the AGN wind, traced by the [Si VI] line, with the galaxy ISM.
The integrated cold molecular gas mass outflow rate of the ring is ∼40 M⊙ yr−1, which is several orders of magnitude higher than that of the ionized phase (0.005 M⊙ yr−1, see Davies et al. 2020). The wide-angle ionization cone (see Fig. 4, and also Thomas et al. 2017) of NGC 7172 probably implies that the AGN wind is not highly collimated. As discussed by Müller-Sánchez et al. (2011), this can result in relatively slow outflow velocities and moderate mass outflow rates of the ionized gas phase, as seen in NGC 7172 (Davies et al. 2020). Despite this, the geometrical coupling between the wide-angle ionization cone (perpendicular to itorus) and the disk of the galaxy may have favored the interaction of the AGN wind with the surrounding ISM, thus entraining molecular gas in the galaxy disk.
The torus of NGC 7172 is detected as extended emission in the ALMA 854 μm map, after subtracting the unresolved emission. The latter likely has a synchrotron origin. The derived torus radius is 32 pc and is seen at an inclination of itorus ≃ 67° (lower limit), based on the observed aspect ratio. The torus gas mass is 8 × 10⁵ M⊙, as measured from the extended 854 μm emission as well as the CO(3−2) emission. These torus properties are similar to other Seyfert galaxies in the GATOS sample. When compared to less luminous AGNs, NGC 7172 presents decreased CO(3−2) surface brightness on torus and nuclear scales relative to that on circumnuclear scales. We interpreted this as evidence of redistribution of molecular gas in the torus and nuclear region of NGC 7172 due to AGN feedback, as observed in other luminous Seyfert galaxies.
Acknowledgments
We thank the referee for some insightful comments. A.A.-H. and S.G.-B. acknowledge support from grant PGC2018-094671-B-I00 funded by MCIN/AEI/10.13039/501100011033 and by ERDF A way of making Europe. A.A.H. also acknowledges support from PID2021-124665NB-I00 funded by the Spanish Ministry of Science and Innovation and the State Agency of Research MCIN/AEI/10.13039/501100011033 PID2021-124665NB-I00 and ERDF A way of making Europe. S.G.B. also acknowledges support from the research project PID2019-106027GA-C44 of the Spanish Ministerio de Ciencia e Innovación. C.R.A. acknowledges the projects “Feeding and feedback in active galaxies”, with reference PID2019-106027GB-C42, funded by MICINN-AEI/10.13039/501100011033, “Quantifying the impact of quasar feedback on galaxy evolution”, with reference EUR2020-112266, funded by MICINN-AEI/10.13039/501100011033 and the European Union NextGenerationEU/PRTR, and from the Consejería de Economía, Conocimiento y Empleo del Gobierno de Canarias and the European Regional Development Fund (ERDF) under grant “Quasar feedback and molecular gas reservoirs”, with reference ProID2020010105, ACCISI/FEDER, UE. C.R. acknowledges support from the Fondecyt Iniciacion grant 11190831 and ANID BASAL project FB210003. E.B. acknowledges the María Zambrano program of the Spanish Ministerio de Universidades funded by the Next Generation European Union and is also partly supported by grant RTI2018-096188-B-I00 funded by MCIN/AEI/10.13039/501100011033. This paper makes use of the following ALMA data: ADS/JAO.ALMA#2019.1.00618.S. ALMA is a partnership of ESO (representing its member states), NSF (USA) and NINS (Japan), together with NRC (Canada), MOST and ASIAA (Taiwan), and KASI (Republic of Korea), in cooperation with the Republic of Chile. The Joint ALMA Observatory is operated by ESO, AUI/NRAO and NAOJ. Based on observations collected at the European Southern Observatory under ESO programme 093.B-0057(B). This research has made use of ESASky, developed by the ESAC Science Data Centre (ESDC) team and maintained alongside other ESA science mission’s archives at ESA’s European Space Astronomy Centre (ESAC, Madrid, Spain). This research has made use of the NASA/IPAC Extragalactic Database (NED), which is operated by the Jet Propulsion Laboratory, California Institute of Technology, under contract with the National Aeronautics and Space Administration. We acknowledge the usage of the HyperLeda database (http://leda.univ-lyon1.fr). This research made use of NumPy (Harris et al. 2020), Matplotlib (Hunter 2007), and Astropy (Astropy Collaboration 2013, 2018).
References
- Abuter, R., Schreiber, J., Eisenhauer, F., et al. 2006, New Astron. Rev., 50, 398 [Google Scholar]
- Alonso-Herrero, A., Ramos Almeida, C., Mason, R., et al. 2011, ApJ, 736, 82 [NASA ADS] [CrossRef] [Google Scholar]
- Alonso-Herrero, A., Pereira-Santaella, M., García-Burillo, S., et al. 2018, ApJ, 859, 144 [Google Scholar]
- Alonso-Herrero, A., García-Burillo, S., Pereira-Santaella, M., et al. 2019, A&A, 628, A65 [NASA ADS] [CrossRef] [EDP Sciences] [Google Scholar]
- Alonso-Herrero, A., Pereira-Santaella, M., Rigopoulou, D., et al. 2020, A&A, 639, A43 [NASA ADS] [CrossRef] [EDP Sciences] [Google Scholar]
- Alonso-Herrero, A., García-Burillo, S., Hönig, S. F., et al. 2021, A&A, 652, A99 [NASA ADS] [CrossRef] [EDP Sciences] [Google Scholar]
- Anglés-Alcázar, D., Quataert, E., Hopkins, P. F., et al. 2021, ApJ, 917, 53 [CrossRef] [Google Scholar]
- Asmus, D., Hönig, S. F., & Gandhi, P. 2016, ApJ, 822, 109 [NASA ADS] [CrossRef] [Google Scholar]
- Astropy Collaboration (Robitaille, T. P., et al.) 2013, A&A, 558, A33 [NASA ADS] [CrossRef] [EDP Sciences] [Google Scholar]
- Astropy Collaboration (Price-Whelan, A. M., et al.) 2018, AJ, 156, 123 [Google Scholar]
- Audibert, A., Combes, F., García-Burillo, S., et al. 2019, A&A, 632, A33 [NASA ADS] [CrossRef] [EDP Sciences] [Google Scholar]
- Baines, D., Giordano, F., Racero, E., et al. 2017, PASP, 129, 028001 [NASA ADS] [CrossRef] [Google Scholar]
- Baumgartner, W. H., Tueller, J., Markwardt, C. B., et al. 2013, ApJS, 207, 19 [Google Scholar]
- Bellocchi, E., Martín-Pintado, J., Rico-Villas, F., Martín, S., & Jiménez-Sierra, I. 2023, MNRAS, 519, L68 [Google Scholar]
- Bessiere, P. S., & Ramos Almeida, C. 2022, MNRAS, 512, L54 [NASA ADS] [CrossRef] [Google Scholar]
- Bîrzan, L., McNamara, B. R., Nulsen, P. E. J., Carilli, C. L., & Wise, M. W. 2008, ApJ, 686, 859 [Google Scholar]
- Bolatto, A. D., Wolfire, M., & Leroy, A. K. 2013, ARA&A, 51, 207 [CrossRef] [Google Scholar]
- Bonnet, H., Abuter, R., Baker, A., et al. 2004, The Messenger, 117, 17 [NASA ADS] [Google Scholar]
- Buta, R., & Combes, F. 1996, Fund. Cosmic Phys., 17, 95 [Google Scholar]
- Cappellari, M., & Emsellem, E. 2004, PASP, 116, 138 [Google Scholar]
- Chilingarian, I. V., Di Matteo, P., Combes, F., Melchior, A. L., & Semelin, B. 2010, A&A, 518, A61 [NASA ADS] [CrossRef] [EDP Sciences] [Google Scholar]
- Cicone, C., Maiolino, R., Sturm, E., et al. 2014, A&A, 562, A21 [NASA ADS] [CrossRef] [EDP Sciences] [Google Scholar]
- Combes, F. 2008, ArXiv e-prints [arXiv:0811.0153] [Google Scholar]
- Combes, F., García-Burillo, S., Casasola, V., et al. 2013, A&A, 558, A124 [NASA ADS] [CrossRef] [EDP Sciences] [Google Scholar]
- Combes, F., García-Burillo, S., Audibert, A., et al. 2019, A&A, 623, A79 [NASA ADS] [CrossRef] [EDP Sciences] [Google Scholar]
- Cresci, G., Marconi, A., Zibetti, S., et al. 2015, A&A, 582, A63 [NASA ADS] [CrossRef] [EDP Sciences] [Google Scholar]
- Davé, R., Anglés-Alcázar, D., Narayanan, D., et al. 2019, MNRAS, 486, 2827 [Google Scholar]
- Davies, R. I. 2007, MNRAS, 375, 1099 [Google Scholar]
- Davies, R. I., Burtscher, L., Rosario, D., et al. 2015, ApJ, 806, 127 [Google Scholar]
- Davies, R., Baron, D., Shimizu, T., et al. 2020, MNRAS, 498, 4150 [Google Scholar]
- Di Teodoro, E. M., & Fraternali, F. 2015, MNRAS, 451, 3021 [Google Scholar]
- Domínguez-Fernández, A. J., Alonso-Herrero, A., García-Burillo, S., et al. 2020, A&A, 643, A127 [NASA ADS] [CrossRef] [EDP Sciences] [Google Scholar]
- Dubois, Y., Peirani, S., Pichon, C., et al. 2016, MNRAS, 463, 3948 [Google Scholar]
- Eisenhauer, F., Abuter, R., Bickert, K., et al. 2003, SPIE Conf. Ser., 4841, 1548 [Google Scholar]
- Fabian, A. C. 2012, ARA&A, 50, 455 [Google Scholar]
- Faucher-Giguère, C.-A., & Quataert, E. 2012, MNRAS, 425, 605 [Google Scholar]
- Fiore, F., Feruglio, C., Shankar, F., et al. 2017, A&A, 601, A143 [NASA ADS] [CrossRef] [EDP Sciences] [Google Scholar]
- Fluetsch, A., Maiolino, R., Carniani, S., et al. 2019, MNRAS, 483, 4586 [NASA ADS] [Google Scholar]
- Gallimore, J. F., Elitzur, M., Maiolino, R., et al. 2016, ApJ, 829, L7 [Google Scholar]
- Gao, Y., Egusa, F., Liu, G., et al. 2021, ApJ, 913, 139 [NASA ADS] [CrossRef] [Google Scholar]
- García-Bernete, I., Ramos Almeida, C., Acosta-Pulido, J. A., et al. 2016, MNRAS, 463, 3531 [CrossRef] [Google Scholar]
- García-Bernete, I., Alonso-Herrero, A., García-Burillo, S., et al. 2021, A&A, 645, A21 [EDP Sciences] [Google Scholar]
- García-Burillo, S., Combes, F., Usero, A., et al. 2014, A&A, 567, A125 [Google Scholar]
- García-Burillo, S., Combes, F., Ramos Almeida, C., et al. 2016, ApJ, 823, L12 [Google Scholar]
- García-Burillo, S., Combes, F., Ramos Almeida, C., et al. 2019, A&A, 632, A61 [Google Scholar]
- García-Burillo, S., Alonso-Herrero, A., Ramos Almeida, C., et al. 2021, A&A, 652, A98 [NASA ADS] [CrossRef] [Google Scholar]
- Giordano, F., Racero, E., Norman, H., et al. 2018, Astron. Comput., 24, 97 [NASA ADS] [CrossRef] [Google Scholar]
- Harris, C. R., Millman, K. J., van der Walt, S. J., et al. 2020, Nature, 585, 357 [NASA ADS] [CrossRef] [Google Scholar]
- Hicks, E. K. S., Davies, R. I., Malkan, M. A., et al. 2009, ApJ, 696, 448 [NASA ADS] [CrossRef] [Google Scholar]
- Hunter, J. D. 2007, Comput. Sci. Eng., 9, 90 [NASA ADS] [CrossRef] [Google Scholar]
- Ichikawa, K., Packham, C., Ramos Almeida, C., et al. 2015, ApJ, 803, 57 [NASA ADS] [CrossRef] [Google Scholar]
- Imanishi, M., Nakanishi, K., Izumi, T., & Wada, K. 2018, ApJ, 853, L25 [NASA ADS] [CrossRef] [Google Scholar]
- Impellizzeri, C. M. V., Gallimore, J. F., Baum, S. A., et al. 2019, ApJ, 884, L28 [NASA ADS] [CrossRef] [Google Scholar]
- Izumi, T., Wada, K., Fukushige, R., Hamamura, S., & Kohno, K. 2018, ApJ, 867, 48 [NASA ADS] [CrossRef] [Google Scholar]
- Klaas, U., Haas, M., Müller, S. A. H., et al. 2001, A&A, 379, 823 [NASA ADS] [CrossRef] [EDP Sciences] [Google Scholar]
- Krajnović, D., Cappellari, M., de Zeeuw, P. T., & Copin, Y. 2006, MNRAS, 366, 787 [Google Scholar]
- Lamperti, I., Pereira-Santaella, M., Perna, M., et al. 2022, A&A, 668, A45 [NASA ADS] [CrossRef] [EDP Sciences] [Google Scholar]
- Lin, M.-Y., Davies, R. I., Hicks, E. K. S., et al. 2018, MNRAS, 473, 4582 [NASA ADS] [CrossRef] [Google Scholar]
- Lutz, D., Sturm, E., Janssen, A., et al. 2020, A&A, 633, A134 [NASA ADS] [CrossRef] [EDP Sciences] [Google Scholar]
- Maiolino, R., Gallerani, S., Neri, R., et al. 2012, MNRAS, 425, L66 [Google Scholar]
- Maiolino, R., Russell, H. R., Fabian, A. C., et al. 2017, Nature, 544, 202 [Google Scholar]
- McMullin, J. P., Waters, B., Schiebel, D., Young, W., & Golap, K. 2007, ASP Conf. Ser., 376, 127 [Google Scholar]
- Menéndez-Delmestre, K., Sheth, K., Schinnerer, E., Jarrett, T. H., & Scoville, N. Z. 2007, ApJ, 657, 790 [Google Scholar]
- Morganti, R., Tsvetanov, Z. I., Gallimore, J., & Allen, M. G. 1999, A&AS, 137, 457 [NASA ADS] [CrossRef] [EDP Sciences] [Google Scholar]
- Morganti, R., Oosterloo, T., Oonk, J. B. R., Frieswijk, W., & Tadhunter, C. 2015, A&A, 580, A1 [NASA ADS] [CrossRef] [EDP Sciences] [Google Scholar]
- Mukherjee, D., Bicknell, G. V., Wagner, A. Y., Sutherland, R. S., & Silk, J. 2018, MNRAS, 479, 5544 [NASA ADS] [CrossRef] [Google Scholar]
- Müller-Sánchez, F., Prieto, M. A., Hicks, E. K. S., et al. 2011, ApJ, 739, 69 [Google Scholar]
- Pasetto, A., González-Martín, O., Esparza-Arredondo, D., et al. 2019, ApJ, 872, 69 [Google Scholar]
- Peralta de Arriba, L., Alonso-Herrero, A., García-Burillo, S., et al. 2023, A&A, 675, A58 [NASA ADS] [CrossRef] [EDP Sciences] [Google Scholar]
- Pereira-Santaella, M., Álvarez-Márquez, J., García-Bernete, I., et al. 2022, A&A, 665, L11 [NASA ADS] [CrossRef] [EDP Sciences] [Google Scholar]
- Ramos Almeida, C., Levenson, N. A., Rodríguez Espinosa, J. M., et al. 2009, ApJ, 702, 1127 [NASA ADS] [CrossRef] [Google Scholar]
- Ramos Almeida, C., Levenson, N. A., Alonso-Herrero, A., et al. 2011, ApJ, 731, 92 [Google Scholar]
- Ramos Almeida, C., Piqueras López, J., Villar-Martín, M., & Bessiere, P. S. 2017, MNRAS, 470, 964 [NASA ADS] [CrossRef] [Google Scholar]
- Ramos Almeida, C., Bischetti, M., García-Burillo, S., et al. 2022, A&A, 658, A155 [NASA ADS] [CrossRef] [EDP Sciences] [Google Scholar]
- Ricci, C., Trakhtenbrot, B., Koss, M. J., et al. 2017, ApJS, 233, 17 [Google Scholar]
- Roche, P. F., Packham, C., Aitken, D. K., & Mason, R. E. 2007, MNRAS, 375, 99 [NASA ADS] [CrossRef] [Google Scholar]
- Rosario, D. J., Togi, A., Burtscher, L., et al. 2019, ApJ, 875, L8 [NASA ADS] [CrossRef] [Google Scholar]
- Schoenmakers, R. H. M., Franx, M., & de Zeeuw, P. T. 1997, MNRAS, 292, 349 [NASA ADS] [CrossRef] [Google Scholar]
- Sharples, R. M., Longmore, A. J., Hawarden, T. G., & Carter, D. 1984, MNRAS, 208, 15 [NASA ADS] [CrossRef] [Google Scholar]
- Shimizu, T. T., Davies, R. I., Lutz, D., et al. 2019, MNRAS, 490, 5860 [Google Scholar]
- Sijacki, D., Vogelsberger, M., Genel, S., et al. 2015, MNRAS, 452, 575 [NASA ADS] [CrossRef] [Google Scholar]
- Smajić, S., Fischer, S., Zuther, J., & Eckart, A. 2012, A&A, 544, A105 [NASA ADS] [CrossRef] [EDP Sciences] [Google Scholar]
- Stone, M., Veilleux, S., Meléndez, M., et al. 2016, ApJ, 826, 111 [NASA ADS] [CrossRef] [Google Scholar]
- Talbot, R. Y., Sijacki, D., & Bourne, M. A. 2022, MNRAS, 514, 4535 [NASA ADS] [CrossRef] [Google Scholar]
- Tanimoto, A., Ueda, Y., Odaka, H., et al. 2020, ApJ, 897, 2 [NASA ADS] [CrossRef] [Google Scholar]
- Thean, A., Pedlar, A., Kukula, M. J., Baum, S. A., & O’Dea, C. P. 2000, MNRAS, 314, 573 [Google Scholar]
- Thomas, A. D., Dopita, M. A., Shastri, P., et al. 2017, ApJS, 232, 11 [NASA ADS] [CrossRef] [Google Scholar]
- van Dokkum, P. G. 2001, PASP, 113, 1420 [Google Scholar]
- Vasudevan, R. V., Fabian, A. C., Gandhi, P., Winter, L. M., & Mushotzky, R. F. 2010, MNRAS, 402, 1081 [NASA ADS] [CrossRef] [Google Scholar]
- Vasylenko, A. A. 2018, Kinemat. Phys. Celest. Bodies, 34, 302 [NASA ADS] [CrossRef] [Google Scholar]
- Venturi, G., Nardini, E., Marconi, A., et al. 2018, A&A, 619, A74 [NASA ADS] [CrossRef] [EDP Sciences] [Google Scholar]
- Venturi, G., Cresci, G., Marconi, A., et al. 2021, A&A, 648, A17 [NASA ADS] [CrossRef] [EDP Sciences] [Google Scholar]
- Véron-Cetty, M. P., & Véron, P. 2006, A&A, 455, 773 [Google Scholar]
- Wong, T., Blitz, L., & Bosma, A. 2004, ApJ, 605, 183 [NASA ADS] [CrossRef] [Google Scholar]
- Zschaechner, L. K., Walter, F., Bolatto, A., et al. 2016, ApJ, 832, 142 [NASA ADS] [CrossRef] [Google Scholar]
Appendix A: Modelization of noncircular motions due to a central bar
This appendix describes a bar-ring model, with the nuclear bar being the source of noncircular motions in the center, as an alternative explanation for the observed CO(3-2) kinematics of the central regions of NGC 7172. The central gas distribution mapped with ALMA has an extent of 3.2 kpc or projected radius of 1.6 kpc (c.f., Fig. 1). Its morphology reveals a central ring, with the characteristic enhancement in the northeast and southwest parts of the ring, as shown in Fig. 2. This indicates that the ring may be a pseudo-ring, made by the winding of the two spiral arms, elongated along the bar, and usually observed as the dusty leading edges of the bar in spiral galaxies. The projected radius of the ring is ∼300 pc, typical of an ILR. This central molecular feature appears very elongated. It is likely however that the ring and barred structure are intrinsically elongated, considering that the inclination of the galaxy is not completely edge-on, but of the order of ∼60°, as noted by Hyperleda and the observed large-scale optical morphology (Fig. 1). We then assumed this value of the inclination in the following modelization.
We used N-body simulations with gas, star formation, and feedback, as described in Combes (2008). The Poisson equation is solved with a 3D Particle-Mesh code based on FFT, and is fully self-consistent with a live dark halo. The gas dissipation is represented by sticky particles and a total of 240 000 particles is used. The star formation rate follows a Schmidt law, with exponent n = 1.4, a density threshold, and an average gas consumption time-scale of 5 Gyr. The stellar feedback is modeled by injecting energy and gas velocity dispersion, when the stellar mass loss is distributed through gas on neighboring particles. The potential of the galaxy is modeled with several components, including a stellar bulge and disk, a dark matter halo, and a gas disk, with the parameters listed in Table A.1. The shape of these components are Miyamoto-Nagai disks and Plummer spheres, as described in Chilingarian et al. (2010). The computed circular velocity and angular frequencies, Ω, Ω ± κ/2, Ω − κ/4, are plotted in Fig. A.1.
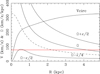 |
Fig. A.1. Circular velocity and corresponding frequencies Ω, Ω ± κ/2, Ω − κ/4 of the gas model for the center of NGC 7172. The pattern speed of the nuclear bar of the N-body simulation is marked in red. |
Parameters adopted for the model.
In the simulation, after 300 Myr a stellar bar has developed and gas has accumulated at the ILR, as shown in the three snapshots of Fig. A.2. The pattern speed of the bar Ωp is ∼80 km s−1 kpc−1, allowing barely for one ILR.
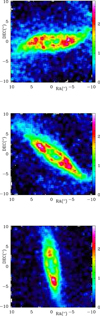 |
Fig. A.2. Three snapshots, separated by 33 Myr, of the gas component viewed face-on, for the NGC 7172 model. |
The gas component at the first snapshot of Fig. A.2 (top panel) is then projected on the sky, with an inclination of 60°, and a position angle providing the best fit to the observations. The data are projected into a cube, with pixel sizes of 0.16″ and 18 km s−1. We smoothed the cube to a beam size comparable to the compact ALMA configuration of our band 7 observations. We show the moment 0 of the cube in Fig. A.3 (left panel) and the isovelocities in Fig. A.3 (right panel).
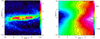 |
Fig. A.3. Moment maps of the gas model for the central regions of NGC 7172. Left panel. Moment 0. The color scale is linear, in arbitrary units. Right panel. Isovelocities of the gas model for the central regions of NGC 7172. Negative velocity contours are traced by dotted lines. The spacing between isovelocities is 30 km s−1. |
The overall morphology of the molecular ring is reproduced in this simulation, although the model does not intend to be a fit for this peculiar galaxy. The simulations presented here are to demonstrate that a bar and ILR ring model, with its noncircular motions, is able to reproduce the main observed features of the molecular gas in NGC 7172. The velocity field, with its characteristic S-shape frequently observed in barred galaxies, indicates noncircular motions corresponding to an apparent outflow of the molecular gas. Indeed, the near-side of the galaxy is to the north, and far side to the south. This is deduced from the dust morphology, and corresponds also to a trailing spiral pattern. Along the minor axis, the velocity is negative with respect to the systemic velocity, the gas is moving toward the observer to the north, and the reverse to the south This apparent gas outflow is also illustrated in the p-v diagrams of Fig. A.4. The major axis is at PA = 90°, and the orientation of the cuts is indicated in the caption. We notice that this apparent outflow is particularly deceiving, since the gas in the simulation is in fact inflowing, due to the gravity torques of the stellar bar.
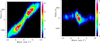 |
Fig. A.4. Computed p-v diagrams along the major axis (left) and minor axis (right) of the gas model for the central regions of NGC 7172. For the major axis, east is to the left, and west to the right. For the minor axis, south is to the left, and north to the right. |
Appendix B: Escape velocity
In this appendix we estimate the escape velocity (Vesc) as a function of the radial distance for NGC 7172. For a particle at radius R, located in a gravitational potential Φ(R), the definition of the escape velocity is when the kinetic energy per unit mass is V2/2 = −Φ(R). It is assumed that Φ(R) reaches zero in the outskirt of the potential, that is, the virial radius of the galaxy. From the rotation curve Vrot of the galaxy, estimated from the observed p-v diagram of Fig. 10 modeled with 3DBAROLO, we can estimate the potential, assuming in a first approximation spherical symmetry. We can thus write  , and compute:
where Φ0 is then computed throughout Φ(Rvir) = 0. We have adopted a simple rotation curve, taking a linearly increasing Vrot from 0 to 300 km s−1 up to 2.5″ = 0.45 kpc, and then a constant Vrot = 300 km s−1 all the way to r = 100″ = 18 kpc. After this optical radius, we assume that the dark matter halo is dominating, with a Navarro-French-White profile, where the dark matter density is varying as ρ(r)∝r−3, and the potential becomes ∝log(r)/r from 18 kpc to Rvir = 180 kpc (virial radius). At each radius  . Figure B.1 shows the derived Vesc as a function of the radial distance. At 0.9 kpc, Vesc is already 850 km s−1.
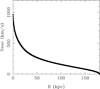 |
Fig. B.1. Modeled escape velocity for NGC 7172. |
All Tables
All Figures
|
Fig. 1. Seyfert galaxy NGC 7172. From top to bottom: Panel a: HST optical to near-IR composite RGB image of NGC 7172 retrieved from ESASky4.3.0. It combines observations from the Advanced Camera for Surveys (ACS) at 6060 and 8140 Å, and the Wide Field Camera 3 (WFC3) at 1.6 μm. The orientation of the image is north up, east to the left. The FoV is ≃2′ × 2′. The rectangle shows approximately the ALMA FoV, while the dashed lines represent the opening angle of the southern (brighter) side of the optical ionization cone. Image credit: ESA/Hubble & NASA, D. J. Rosario, A. Barth. Panel b: ALMA CO(3−2) intensity map (moment 0) produced with a 3σ clipping using the merged configuration observations. We trimmed the original FoV to approximately 17.6″ × 3.3″. Both the image and the contours are shown on a linear scale. The color bar shows the intensity scale in Jy km s−1 per beam units. The first contour is at 0.05 Jy km s−1 per beam. The ALMA beam (not shown) is 0.08″ × 0.07″ (14 pc × 13 pc) at PAbeam = 90.4°. Panel c: ALMA CO(3−2) mean velocity map (moment 1) produced with a 3σ clipping using the merged configuration observations. The contours are the isovelocities. Panel d: ALMA CO(3−2) mean velocity dispersion map (moment 2) produced with a 3σ clipping using the merged configuration observations. For the last two panels the scale bar units are km s−1. |
| In the text | |
|
Fig. 2. ALMA band 7 observations. Left panel: in gray scale and contours is a zoom-in on the ALMA CO(3−2) intensity map of Fig. 1 (second panel from the top) showing the inner part of the cold molecular gas ring. The FoV matches that of the SINFONI observations (see Fig. 4). The gray bar shows the CO(3−2) intensity scale in Jy km s−1 beam−1. The red contours are the band 7 continuum map at 854 μm from the merged configuration, shown on a linear scale. The first contour is at three times the measured continuum rms of 17 μJy. The continuum beam (0.08″ × 0.06″ at PAbeam = 90.6°) is the blue filled ellipse in the bottom-left corner. Right panel: the gray scale map and the red contours are the compact configuration 854 μm continuum map, with the same FoV as in the left panel. The contours are on a linear scale. The continuum beam (0.34″ × 0.27″ at PAbeam = −78°) is the blue filled ellipse in the bottom-left corner. |
| In the text | |
|
Fig. 3. VLT/SINFONI observations. From top to bottom, integrated flux (in arbitrary units), velocity (in km s−1), and velocity dispersion (in km s−1) maps of the H2 line at 2.12 μm (left panels) and [Si VI]λ1.96 μm line (right panels). In the top-right panel, the thick orange dashed lines indicate the approximate opening angle of the [O III]λ5007 ionization cone (Thomas et al. 2017). We note that in these SINFONI maps, the fitted emission does not fully cover the 3.9″ × 4.2″ FoV. The colors and the contours are on a linear scale. The (0, 0) point in all the panels corresponds to the peak of the SINFONI line maps. The hatched circle in the bottom-right panel shows the angular resolution (FWHM) of the observations. |
| In the text | |
|
Fig. 4. Comparison of the ALMA and VLT/SINFONI observations. The blue color scale image is a zoom-in on the ALMA CO(3−2) intensity map of Fig. 1 with a FoV matching that of the VLT/SINFONI observations (see Fig. 3). The red contours are the H2 line at 2.12 μm (left panel) and [Si VI]λ1.96 μm (right panel), as Fig. 3. The (0, 0) position in all the panels corresponds to the peak of the SINFONI line maps as well as the ALMA 854 μm continuum. |
| In the text | |
|
Fig. 5. VLT/SINFONI velocity fields of the H2 line at 2.12 μm (left panel) and the [Si VI]λ1.96 μm line (right panel) after subtracting the stellar velocity field fitted with PPXF. The (0, 0) position in all the panels corresponds to the peak of the SINFONI line map. The units of the color bars are km s−1. |
| In the text | |
|
Fig. 6. 3DBAROLO observed moment maps. From top to bottom, ALMA CO(3−2) maps of the observed velocity-integrated intensity (moment 0), observed mean velocity field (moment 1), and velocity dispersion field (moment 2), produced with the compact configuration observations using 3DBAROLO. All the contours are on a linear scale. The ALMA beam (not shown) is 0.34″ × 0.27″ at PAbeam = −74.9°. The units of the velocity and velocity dispersion maps are km s−1. In the top panel, the star marks the approximate location of the AGN. |
| In the text | |
|
Fig. 7. Velocity map of the 3DBAROLO rotating disk model without a radial velocity component fitted to the ALMA CO(3−2) observations (top) and residual velocity map (bottom). The latter was computed by subtracting the 3DBAROLO model from the observed moment 1 map. |
| In the text | |
|
Fig. 8. ALMA CO(3−2) p − v diagrams generated with 3DBAROLO along the kinematic major (top panel) and minor (bottom panel) axes. The gray scale and blue contours are the ALMA CO(3−2) observations, while the red contours are the 3DBAROLO rotating disk model. The yellow dots are the fitted rotation curve. |
| In the text | |
|
Fig. 9. Velocity map of the 3DBAROLO rotating disk model with a radial velocity component and residual velocity map. Panels are the same as in Fig. 7. The star symbol shows the approximate location of the AGN. |
| In the text | |
|
Fig. 10. ALMA CO(3−2) p − v diagrams generated with 3DBAROLO. Panels, colors, and lines are the same as Fig. 8, but for the 3DBAROLO disk model with a radial velocity component. The yellow dots in the top panel are the fixed rotation curve used for this model. |
| In the text | |
|
Fig. 11. Radial profiles of the ALMA CO(3−2) median intensity (top panel), gas velocity dispersion (middle panel), and radial velocity (bottom panel) fitted with the 3DBAROLO model in Sect. 4.2. As explained by García-Burillo et al. (2019), the vertical error bars in the integrated CO(3−2) emission reflect the deviations from symmetry in the gas distribution. |
| In the text | |
|
Fig. 12. Central 0.4″ × 0.4″ region showing the ALMA 854 μm emission. Top panels: observed (left panel) and point-source subtracted (right panel) images from the extended configuration data set. Lower panels: same as the upper panels, but for the merged configuration. The dashed blue ellipse marks the approximate extent of the torus. In all the panels, the first contour is at 3 × rms. The gray ellipses represent the corresponding observation beams. |
| In the text | |
|
Fig. 13. Molecular gas mass outflow rate versus AGN bolometric luminosity of NGC 7172 compared with the compilation of infrared bright galaxies from Lutz et al. (2020) except for NGC 1068 which is from García-Burillo et al. (2014), QSO2s from Ramos Almeida et al. (2022), and local ULIRGs classified as AGNs from Lamperti et al. (2022). For these comparison samples, we only plot galaxies with detections in both axes. |
| In the text | |
|
Fig. A.1. Circular velocity and corresponding frequencies Ω, Ω ± κ/2, Ω − κ/4 of the gas model for the center of NGC 7172. The pattern speed of the nuclear bar of the N-body simulation is marked in red. |
| In the text | |
|
Fig. A.2. Three snapshots, separated by 33 Myr, of the gas component viewed face-on, for the NGC 7172 model. |
| In the text | |
|
Fig. A.3. Moment maps of the gas model for the central regions of NGC 7172. Left panel. Moment 0. The color scale is linear, in arbitrary units. Right panel. Isovelocities of the gas model for the central regions of NGC 7172. Negative velocity contours are traced by dotted lines. The spacing between isovelocities is 30 km s−1. |
| In the text | |
|
Fig. A.4. Computed p-v diagrams along the major axis (left) and minor axis (right) of the gas model for the central regions of NGC 7172. For the major axis, east is to the left, and west to the right. For the minor axis, south is to the left, and north to the right. |
| In the text | |
|
Fig. B.1. Modeled escape velocity for NGC 7172. |
| In the text | |
Current usage metrics show cumulative count of Article Views (full-text article views including HTML views, PDF and ePub downloads, according to the available data) and Abstracts Views on Vision4Press platform.
Data correspond to usage on the plateform after 2015. The current usage metrics is available 48-96 hours after online publication and is updated daily on week days.
Initial download of the metrics may take a while.