Fig. 3.
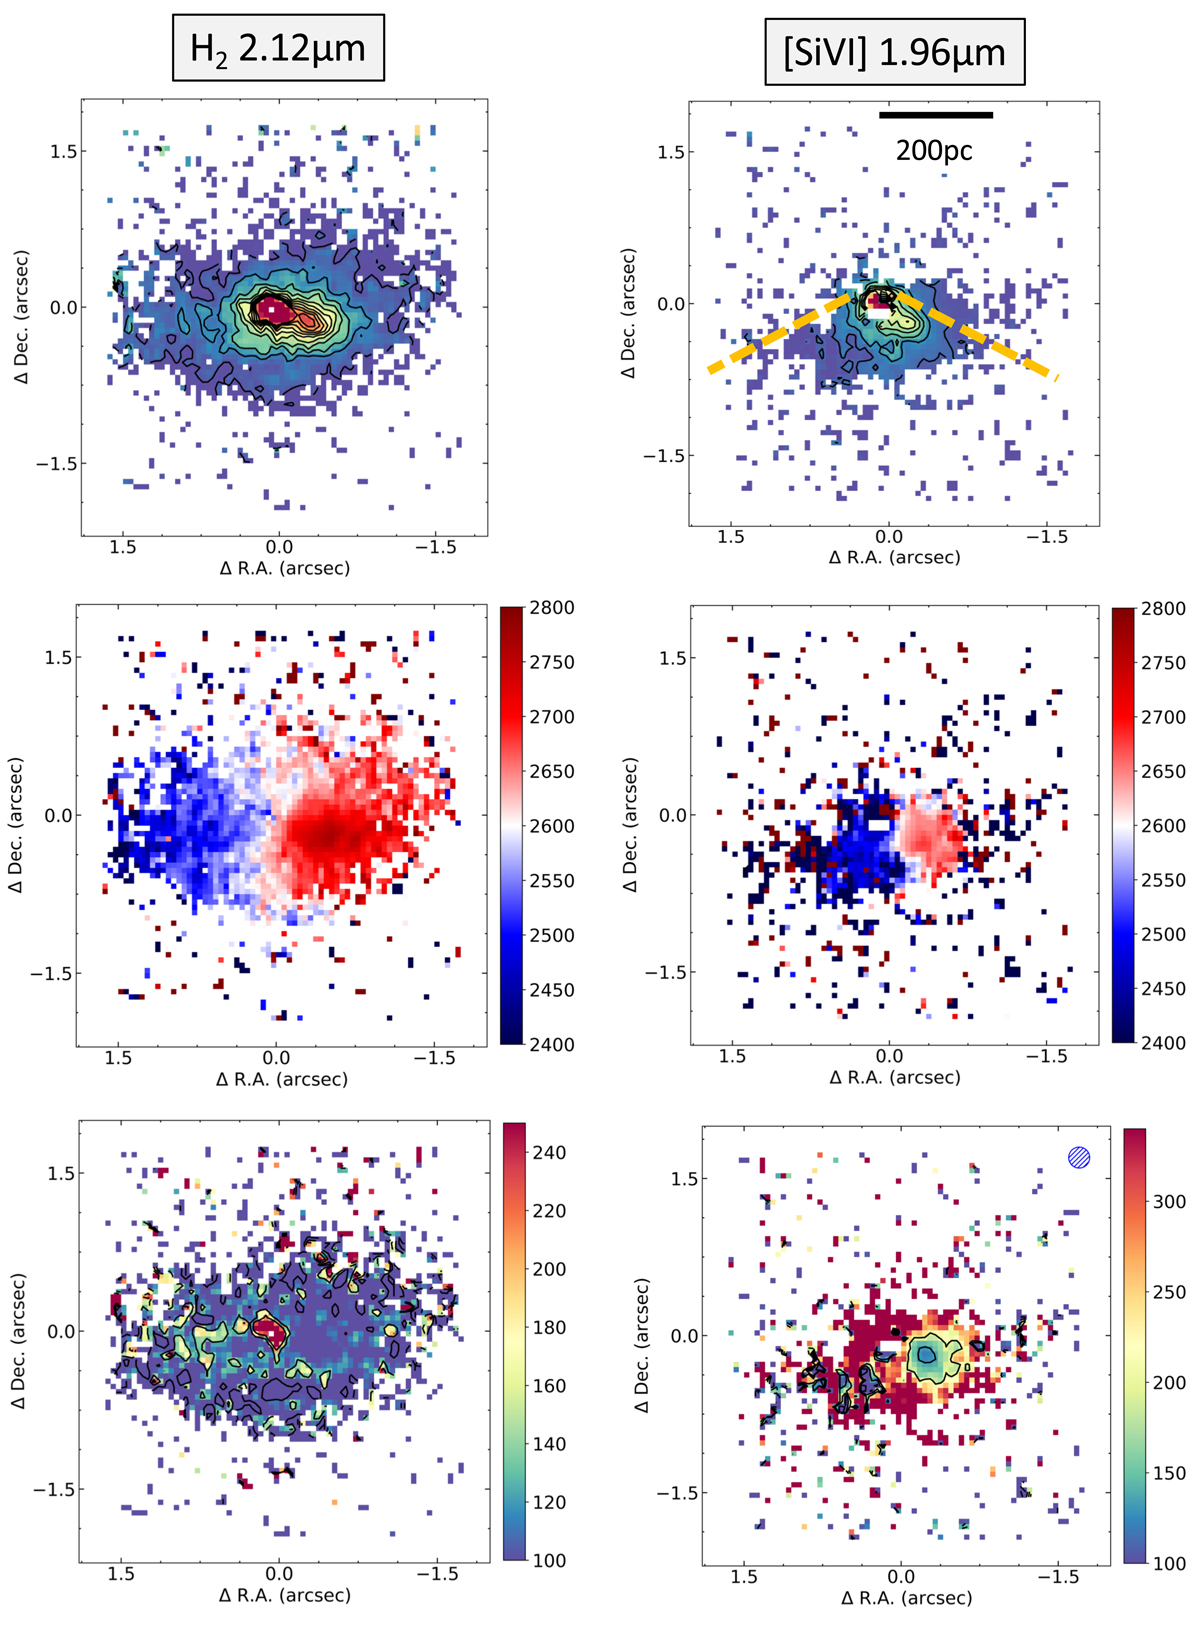
Download original image
VLT/SINFONI observations. From top to bottom, integrated flux (in arbitrary units), velocity (in km s−1), and velocity dispersion (in km s−1) maps of the H2 line at 2.12 μm (left panels) and [Si VI]λ1.96 μm line (right panels). In the top-right panel, the thick orange dashed lines indicate the approximate opening angle of the [O III]λ5007 ionization cone (Thomas et al. 2017). We note that in these SINFONI maps, the fitted emission does not fully cover the 3.9″ × 4.2″ FoV. The colors and the contours are on a linear scale. The (0, 0) point in all the panels corresponds to the peak of the SINFONI line maps. The hatched circle in the bottom-right panel shows the angular resolution (FWHM) of the observations.
Current usage metrics show cumulative count of Article Views (full-text article views including HTML views, PDF and ePub downloads, according to the available data) and Abstracts Views on Vision4Press platform.
Data correspond to usage on the plateform after 2015. The current usage metrics is available 48-96 hours after online publication and is updated daily on week days.
Initial download of the metrics may take a while.