Open Access
Fig. 9.
Download original image
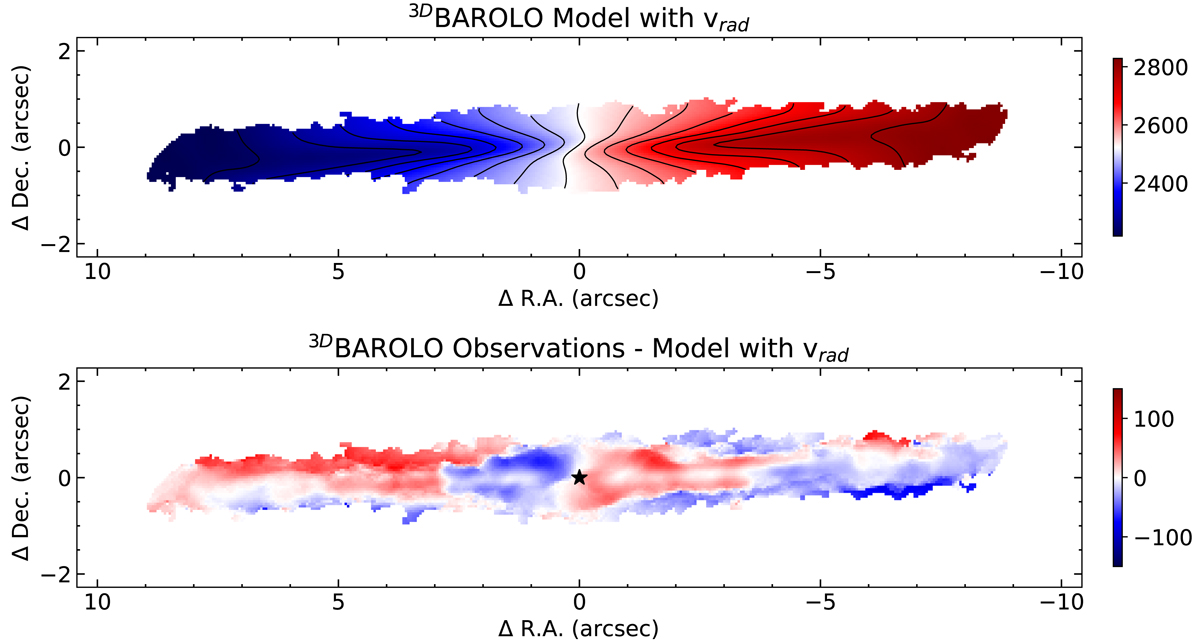
Velocity map of the 3DBAROLO rotating disk model with a radial velocity component and residual velocity map. Panels are the same as in Fig. 7. The star symbol shows the approximate location of the AGN.
Current usage metrics show cumulative count of Article Views (full-text article views including HTML views, PDF and ePub downloads, according to the available data) and Abstracts Views on Vision4Press platform.
Data correspond to usage on the plateform after 2015. The current usage metrics is available 48-96 hours after online publication and is updated daily on week days.
Initial download of the metrics may take a while.