Fig. 6.
Download original image
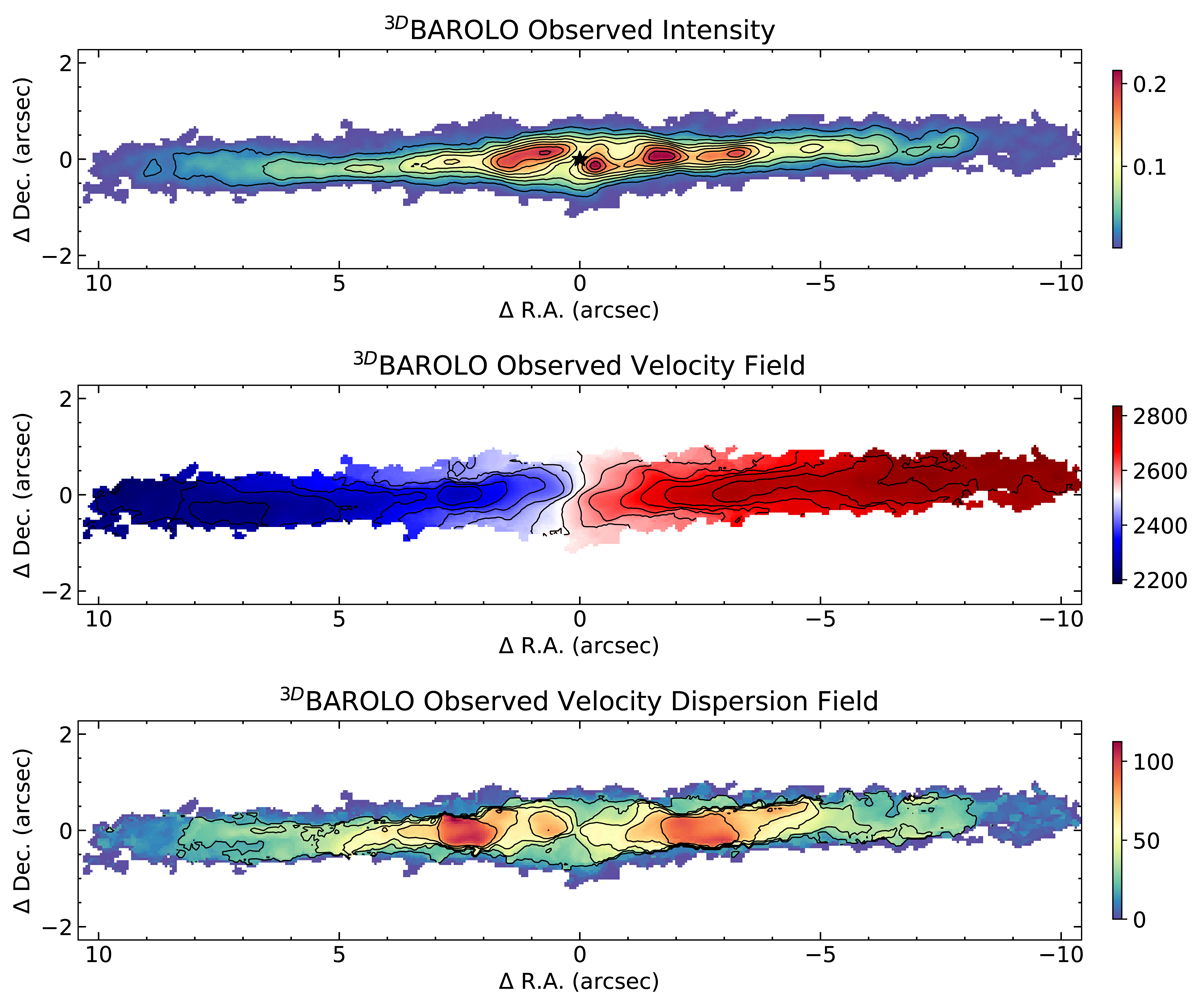
3DBAROLO observed moment maps. From top to bottom, ALMA CO(3−2) maps of the observed velocity-integrated intensity (moment 0), observed mean velocity field (moment 1), and velocity dispersion field (moment 2), produced with the compact configuration observations using 3DBAROLO. All the contours are on a linear scale. The ALMA beam (not shown) is 0.34″ × 0.27″ at PAbeam = −74.9°. The units of the velocity and velocity dispersion maps are km s−1. In the top panel, the star marks the approximate location of the AGN.
Current usage metrics show cumulative count of Article Views (full-text article views including HTML views, PDF and ePub downloads, according to the available data) and Abstracts Views on Vision4Press platform.
Data correspond to usage on the plateform after 2015. The current usage metrics is available 48-96 hours after online publication and is updated daily on week days.
Initial download of the metrics may take a while.