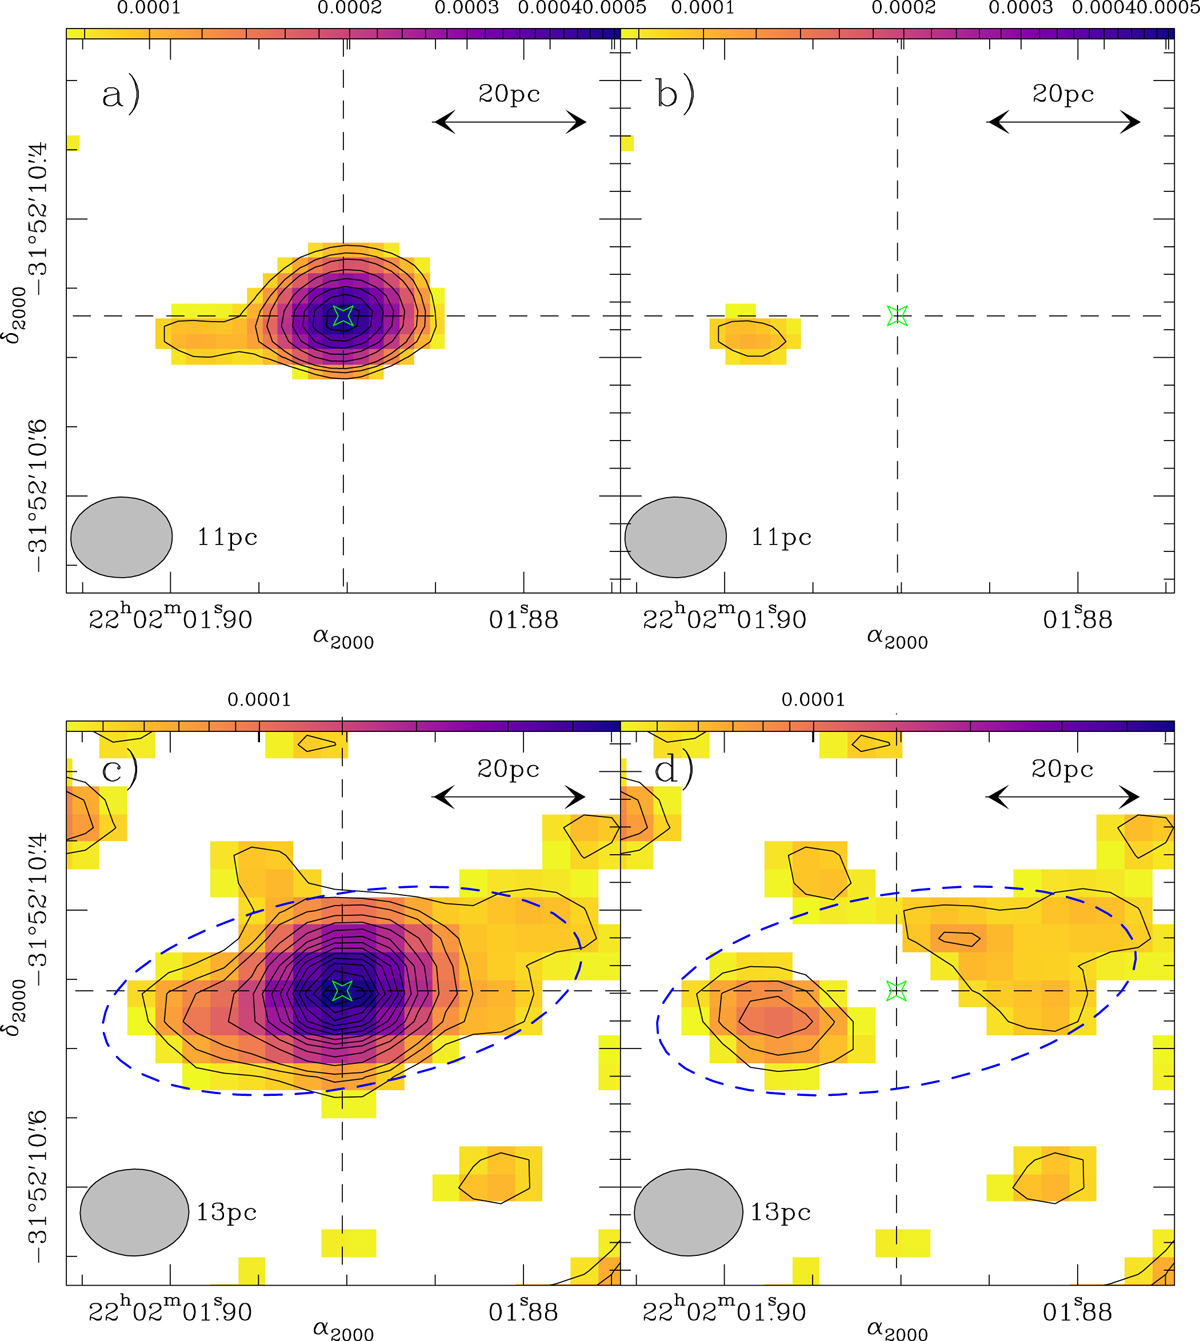
Fig. 12.
Download original image
Central 0.4″ × 0.4″ region showing the ALMA 854 μm emission. Top panels: observed (left panel) and point-source subtracted (right panel) images from the extended configuration data set. Lower panels: same as the upper panels, but for the merged configuration. The dashed blue ellipse marks the approximate extent of the torus. In all the panels, the first contour is at 3 × rms. The gray ellipses represent the corresponding observation beams.
Current usage metrics show cumulative count of Article Views (full-text article views including HTML views, PDF and ePub downloads, according to the available data) and Abstracts Views on Vision4Press platform.
Data correspond to usage on the plateform after 2015. The current usage metrics is available 48-96 hours after online publication and is updated daily on week days.
Initial download of the metrics may take a while.