Open Access
Fig. A.3.
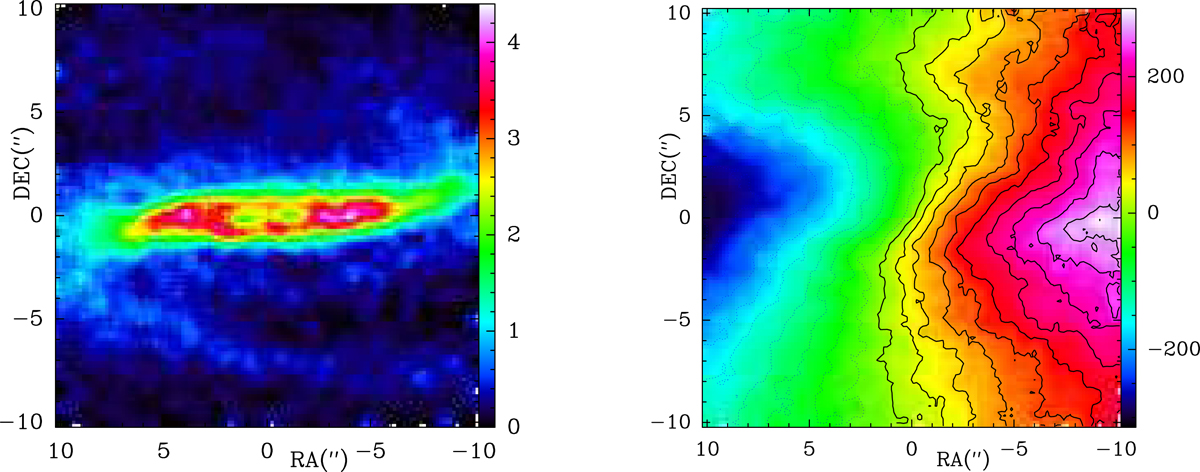
Download original image
Moment maps of the gas model for the central regions of NGC 7172. Left panel. Moment 0. The color scale is linear, in arbitrary units. Right panel. Isovelocities of the gas model for the central regions of NGC 7172. Negative velocity contours are traced by dotted lines. The spacing between isovelocities is 30 km s−1.
Current usage metrics show cumulative count of Article Views (full-text article views including HTML views, PDF and ePub downloads, according to the available data) and Abstracts Views on Vision4Press platform.
Data correspond to usage on the plateform after 2015. The current usage metrics is available 48-96 hours after online publication and is updated daily on week days.
Initial download of the metrics may take a while.