Open Access
Fig. 5.
Download original image
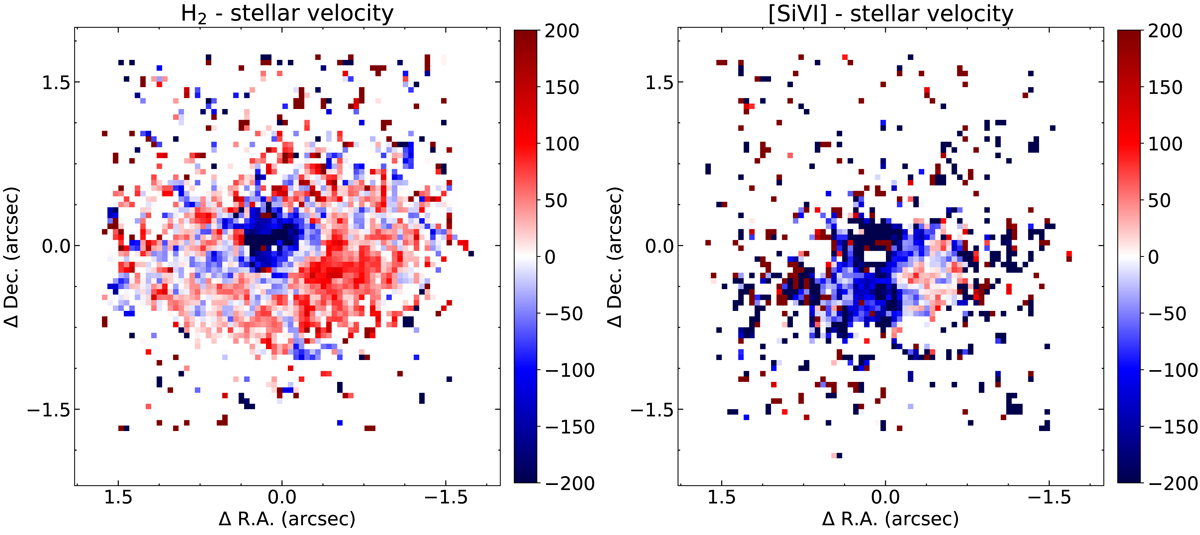
VLT/SINFONI velocity fields of the H2 line at 2.12 μm (left panel) and the [Si VI]λ1.96 μm line (right panel) after subtracting the stellar velocity field fitted with PPXF. The (0, 0) position in all the panels corresponds to the peak of the SINFONI line map. The units of the color bars are km s−1.
Current usage metrics show cumulative count of Article Views (full-text article views including HTML views, PDF and ePub downloads, according to the available data) and Abstracts Views on Vision4Press platform.
Data correspond to usage on the plateform after 2015. The current usage metrics is available 48-96 hours after online publication and is updated daily on week days.
Initial download of the metrics may take a while.