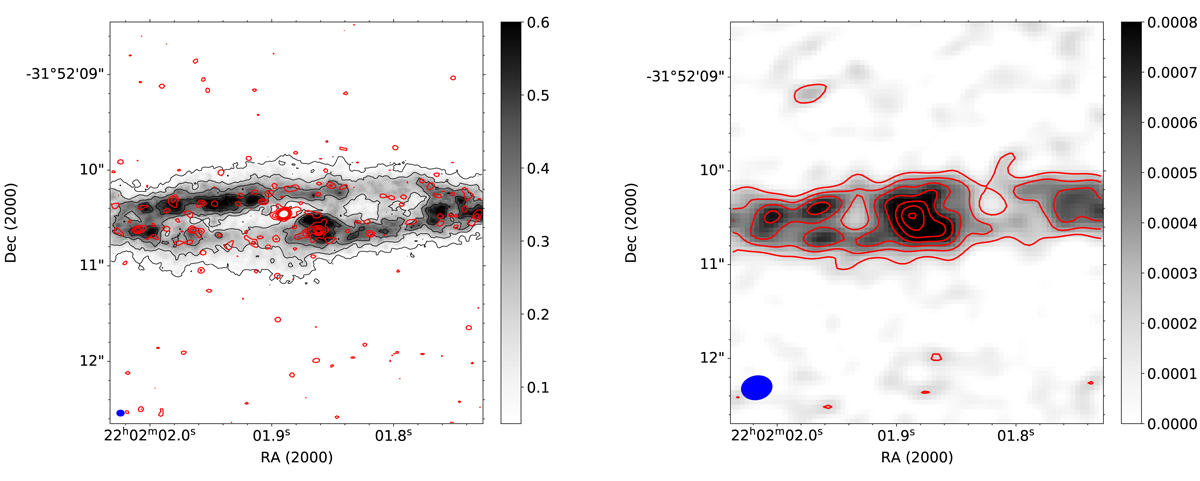
Fig. 2.
Download original image
ALMA band 7 observations. Left panel: in gray scale and contours is a zoom-in on the ALMA CO(3−2) intensity map of Fig. 1 (second panel from the top) showing the inner part of the cold molecular gas ring. The FoV matches that of the SINFONI observations (see Fig. 4). The gray bar shows the CO(3−2) intensity scale in Jy km s−1 beam−1. The red contours are the band 7 continuum map at 854 μm from the merged configuration, shown on a linear scale. The first contour is at three times the measured continuum rms of 17 μJy. The continuum beam (0.08″ × 0.06″ at PAbeam = 90.6°) is the blue filled ellipse in the bottom-left corner. Right panel: the gray scale map and the red contours are the compact configuration 854 μm continuum map, with the same FoV as in the left panel. The contours are on a linear scale. The continuum beam (0.34″ × 0.27″ at PAbeam = −78°) is the blue filled ellipse in the bottom-left corner.
Current usage metrics show cumulative count of Article Views (full-text article views including HTML views, PDF and ePub downloads, according to the available data) and Abstracts Views on Vision4Press platform.
Data correspond to usage on the plateform after 2015. The current usage metrics is available 48-96 hours after online publication and is updated daily on week days.
Initial download of the metrics may take a while.