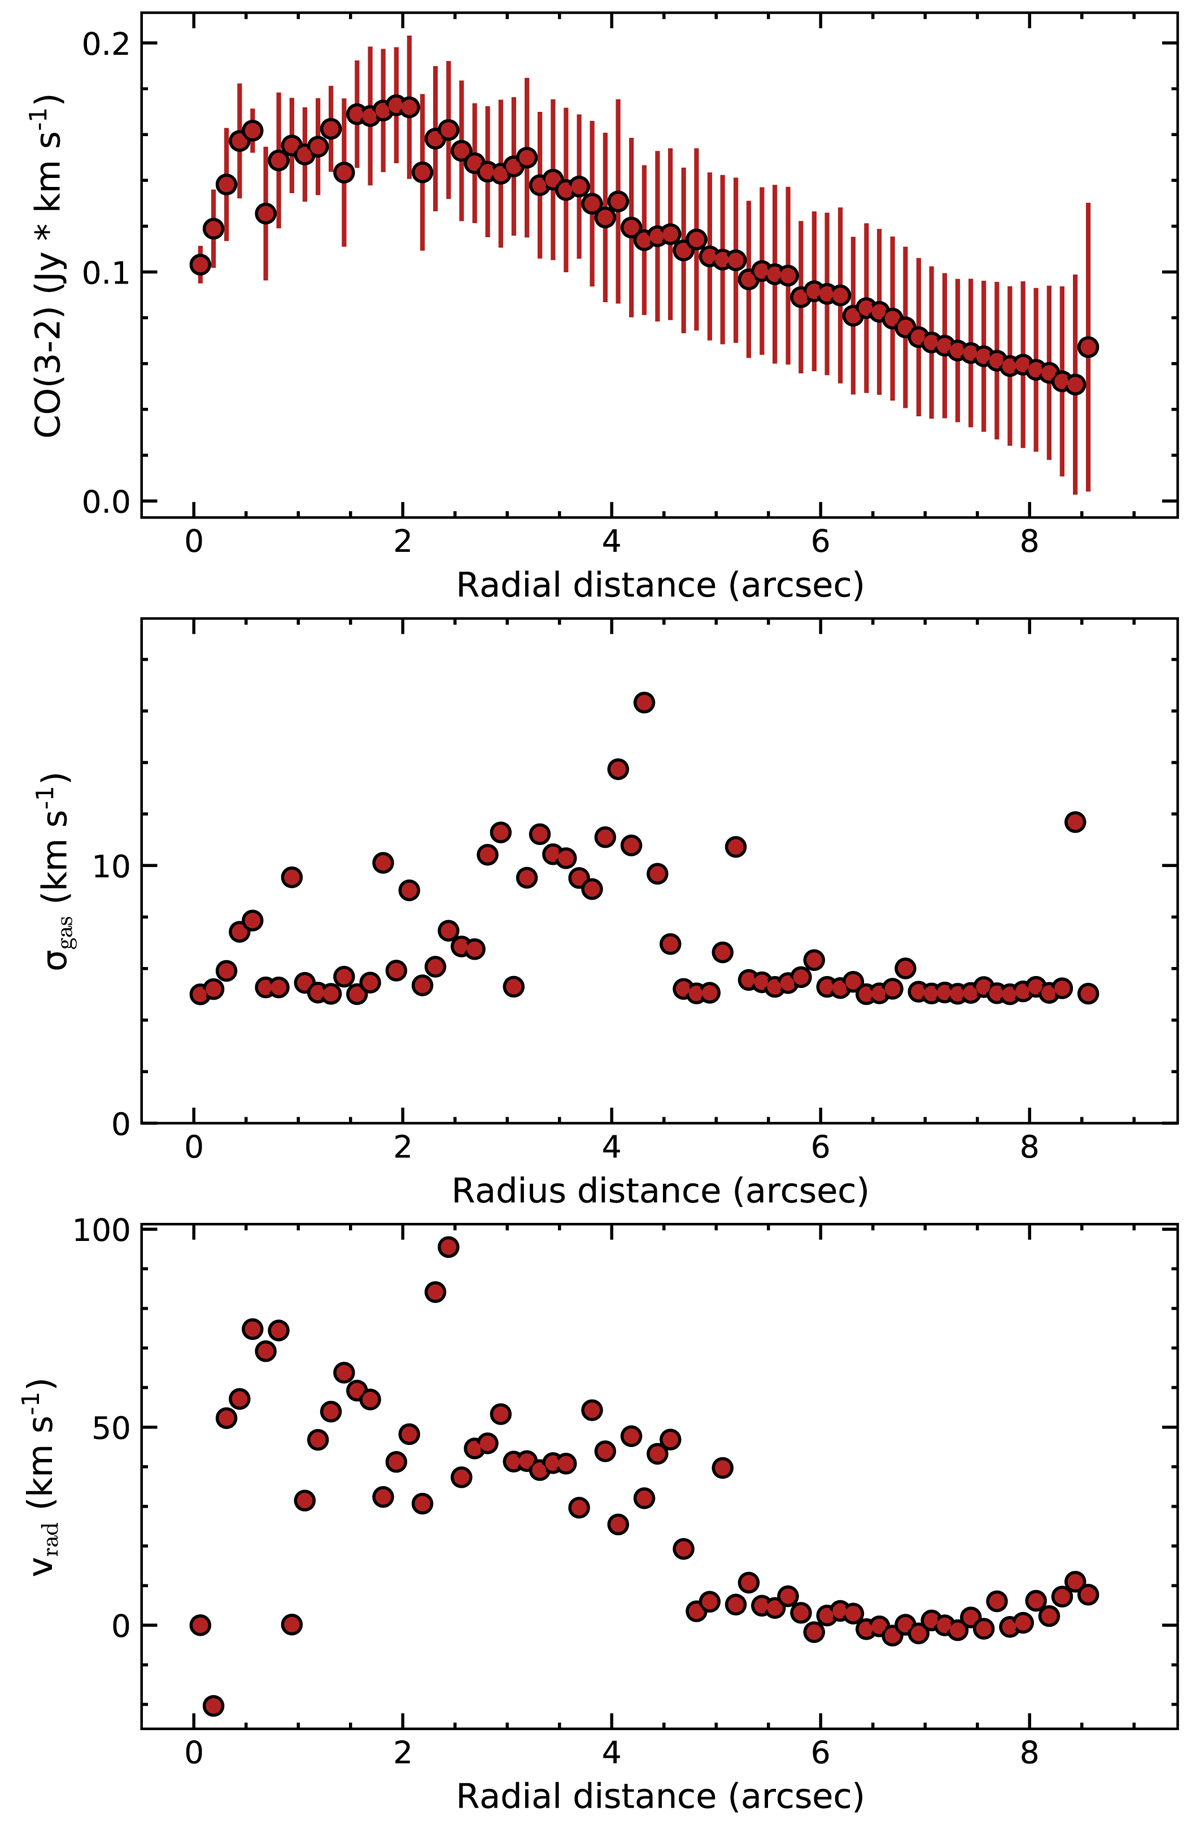
Fig. 11.
Download original image
Radial profiles of the ALMA CO(3−2) median intensity (top panel), gas velocity dispersion (middle panel), and radial velocity (bottom panel) fitted with the 3DBAROLO model in Sect. 4.2. As explained by García-Burillo et al. (2019), the vertical error bars in the integrated CO(3−2) emission reflect the deviations from symmetry in the gas distribution.
Current usage metrics show cumulative count of Article Views (full-text article views including HTML views, PDF and ePub downloads, according to the available data) and Abstracts Views on Vision4Press platform.
Data correspond to usage on the plateform after 2015. The current usage metrics is available 48-96 hours after online publication and is updated daily on week days.
Initial download of the metrics may take a while.