Fig. 5.
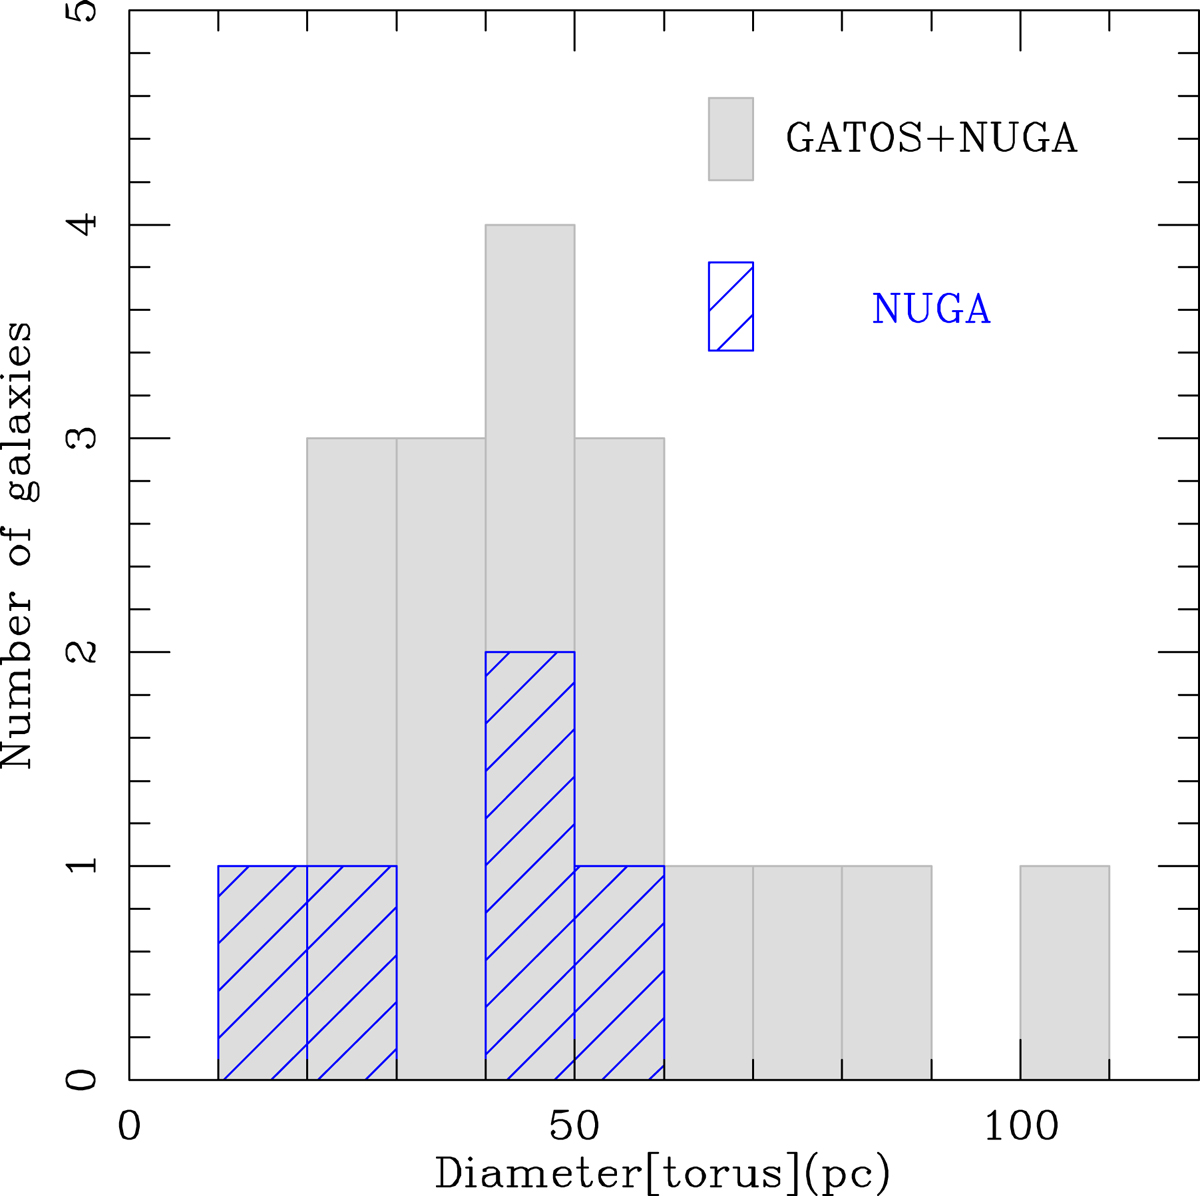
Histograms showing the distribution of the deconvolved diameters of the dusty molecular tori (or polar components) derived from the combined sample of NUGA and GATOS (gray-filled histograms). We adopt for GATOS the average sizes estimated from the MSR and HSR datasets. The blue-filled histogram identifies the distribution of sizes of the tori derived for NUGA galaxies (Combes et al. 2019).
Current usage metrics show cumulative count of Article Views (full-text article views including HTML views, PDF and ePub downloads, according to the available data) and Abstracts Views on Vision4Press platform.
Data correspond to usage on the plateform after 2015. The current usage metrics is available 48-96 hours after online publication and is updated daily on week days.
Initial download of the metrics may take a while.