| Issue |
A&A
Volume 689, September 2024
|
|
|---|---|---|
| Article Number | A347 | |
| Number of page(s) | 29 | |
| Section | Extragalactic astronomy | |
| DOI | https://doi.org/10.1051/0004-6361/202450268 | |
| Published online | 24 September 2024 | |
Deciphering the imprint of active galactic nucleus feedback in Seyfert galaxies
Nuclear-scale molecular gas deficits
1
Observatorio Astronómico Nacional (OAN-IGN)-Observatorio de Madrid, Alfonso XII, 3, 28014 Madrid, Spain
2
Department of Physics & Astronomy, University of Alaska Anchorage, Anchorage, AK 99508-4664, USA
3
Department of Physics, University of Alaska, Fairbanks, AK 99775-5920, USA
4
Centro de Astrobiología (CAB), CSIC-INTA, Camino Bajo del Castillo s/n, 28692 Villanueva de la Cañada, Madrid, Spain
5
Instituto de Física Fundamental (IFF), CSIC, Serrano 123, 28006 Madrid, Spain
6
Instituto de Radioastronomía y Astrofísica (IRyA-UNAM), 3-72(Xangari), 8701 Morelia, Mexico
7
Instituto de Astrofísica de Canarias, Calle Vía Láctea, s/n, E-38205 La Laguna, Tenerife, Spain
8
Departamento de Astrofísica, Universidad de La Laguna, E-38205 La Laguna, Tenerife, Spain
9
LERMA, Observatoire de Paris, Collège de France, PSL University, CNRS, Sorbonne University, Paris, France
10
Department of Physics, University of Connecticut, 196 Auditorium Road, U-3046, Storrs, CT 06269-3046, USA
11
Center for Computational Astrophysics, Flatiron Institute, 162 Fifth Avenue, New York, NY 10010, USA
12
Departmento de Física de la Tierra y Astrofísica, Fac. de CC Físicas, Universidad Complutense de Madrid, E-28040 Madrid, Spain
13
Instituto de Física de Partículas y del Cosmos IPARCOS, Fac. de CC Físicas, Universidad Complutense de Madrid, E-28040 Madrid, Spain
14
Max-Planck-Institut für Extraterrestrische Physik, Garching, Germany
15
Cardiff Hub for Astrophysics Research & Technology, School of Physics & Astronomy, Cardiff University, Queens Buildings, The Parade, Cardiff CF24 3AA, UK
16
Department of Physics, University of Oxford, Keble Road, Oxford OX1 3RH, UK
17
School of Physics & Astronomy, University of Southampton, Hampshire, SO17 1BJ Southampton, UK
18
Telespazio UK for the European Space Agency (ESA), ESAC, Camino Bajo del Castillo s/n, 28692 Villanueva de la Cañada, Spain
19
The University of Texas at San Antonio, One UTSA Circle, San Antonio, TX 78249, USA
20
Space Telescope Science Institute, 3700 San Martin Drive, Baltimore, MD 21218, USA
21
Kavli Institute for Particle Astrophysics & Cosmology (KIPAC), Stanford University, Stanford, CA 94305, USA
22
National Astronomical Observatory of Japan, National Institutes of Natural Sciences (NINS), 2-21-1 Osawa, Mitaka, Tokyo 181-8588, Japan
23
Instituto de Estudios Astrofísicos, Facultad de Ingeniería y Ciencias, Universidad Diego Portales, Av. Ejército Libertador 441, Santiago, Chile
24
Kavli Institute for Astronomy and Astrophysics, Peking University, Beijing 100871, PR China
25
School of Mathematics, Statistics and Physics, Newcastle University, Newcastle upon Tyne NE1 7RU, UK
26
Astronomical Observatory, Volgina 7, 11060 Belgrade, Serbia
27
Sterrenkundig Observatorium, Universiteit Ghent, Krijgslaan 281-S9, Ghent B-9000, Belgium
Received:
5
April
2024
Accepted:
14
June
2024
Abstract
We study the distribution of cold molecular gas in the circumunuclear disks (CND; r ≤ 200 pc) of a sample of 64 nearby (DL = 7 − 45 Mpc) disk galaxies – including 45 active galactic nuclei (AGN) and 19 nonAGN – for which high-spatial-resolution (median value ≃36 pc) multiline CO interferometer observations have been obtained at millimeter wavelengths with the Atacama Large Millimeter Array (ALMA) and/or Plateau de Bure Interferometer (PdBI). We decipher whether or not the concentration and normalized radial distribution of cold molecular gas change as a function of X-ray luminosity in the 2–10 keV range (LX) in order to analyze the imprint left by AGN feedback. We also look for similar trends in the concentration and normalized radial distribution of the hot molecular gas and in the hot-to-cold-molecular gas mass ratio in a subset of 35 galaxies using near-infrared (NIR) integral field spectroscopy data obtained for the H2 1-0 S(1) line. We find a significant turnover in the distribution of the cold molecular gas concentration as a function of X-ray luminosity with a breakpoint that divides the sample into two branches: (1) the “AGN build-up branch” (LX ≤ 1041.5 ± 0.3 erg s−1) and (2) the “AGN feedback branch” (LX ≥ 1041.5 ± 0.3 erg s−1). Lower-luminosity AGN and nonAGN of the AGN build-up branch show high cold molecular gas concentrations and centrally peaked radial profiles on nuclear (r ≤ 50 pc) scales. Higher-luminosity AGN of the AGN feedback branch show a sharp decrease in the concentration of molecular gas and flat or inverted radial profiles. The cold molecular gas concentration index (CCI) – defined as the ratio of surface densities at r ≤ 50 pc (Σ50gaz) and r ≤ 200 pc Σ200gaz), namely CCI ≡ log10(Σ50gaz/Σ200gaz)) – spans a 0.63 dex range, equivalent to a factor ≃4–5, between the galaxies lying at the high end of the AGN build-up branch and the galaxies showing the most extreme nuclear-scale molecular gas deficits in the AGN feedback branch. The concentration and radial distributions of the hot molecular gas in our sample follow qualitatively similar but less extreme trends as a function of X-ray luminosity. As a result, we find higher values of hot-to-cold molecular gas mass ratios on nuclear scales in the highest luminosity AGN sources of the AGN feedback branch. These observations confirm – with a three times larger sample – previous evidence found in the context of the Galaxy Activity Torus and Outflow Survey (GATOS) that the imprint of AGN feedback on the CND-scale distribution of molecular gas is more extreme in higher luminosity Seyfert galaxies of the local Universe.
Key words: galaxies: active / galaxies: evolution / galaxies: ISM / galaxies: nuclei / galaxies: Seyfert
Corresponding author; This email address is being protected from spambots. You need JavaScript enabled to view it. .
© The Authors 2024
 Open Access article, published by EDP Sciences, under the terms of the Creative Commons Attribution License (https://creativecommons.org/licenses/by/4.0), which permits unrestricted use, distribution, and reproduction in any medium, provided the original work is properly cited.
This article is published in open access under the Subscribe to Open model. This email address is being protected from spambots. You need JavaScript enabled to view it. to support open access publication.
1. Introduction
The optical spectral properties of active galactic nuclei (AGN) are used to classify them into two categories: type 1 AGN show both broad and narrow line regions (BLRs and NLRs, respectively), while type 2 AGN only show NLRs. In the AGN unifying theories, the central engines of type 2 objects are thought to be hidden behind large amounts of obscuring material located in a “torus” or disk of a few parsecs (pc) in size (e.g., Antonucci & Miller 1985; Antonucci 1993; Krolik & Begelman 1988; Urry & Padovani 1995). Being a key player in the last steps of the AGN fueling process, observations of tori and their surrounding regions can therefore add detail to our understanding of the feeding and feedback cycle of the gas in AGN (e.g., Ramos Almeida & Ricci 2017; Storchi-Bergmann & Schnorr-Müller 2019; Combes 2021a; Harrison & Ramos Almeida 2024).
Molecular tori are the expected launching sites of multiscale and multiphase outflows, a manifestation of the AGN feedback process. There is increasing multiwavelength observational evidence for the existence of outflows that can extend from tens of pc to several kiloparsecs (kpc) in different AGN samples (e.g., Morganti et al. 2005, 2015; Alatalo et al. 2011; Aalto et al. 2012, 2020; Combes et al. 2013; García-Burillo et al. 2014, 2019; Querejeta et al. 2016; Fiore et al. 2017; Alonso-Herrero et al. 2018, 2019, 2023; Audibert et al. 2019; Fluetsch et al. 2019, 2021; Mingozzi et al. 2019; Lutz et al. 2020; Domínguez-Fernández et al. 2020; Veilleux et al. 2020; García-Bernete et al. 2021; Venturi et al. 2021; Ramos Almeida et al. 2022; Ulivi et al. 2024). Galaxy formation models and numerical simulations predict that AGN feedback is a necessary ingredient in our explanation of the observable properties of massive galaxies (e.g., Schaye et al. 2015; Anglés-Alcázar et al. 2017; Weinberger et al. 2017; Pillepich et al. 2018; Davé et al. 2019). However, quantitatively establishing the potential impact of the feedback of nuclear activity in their host galaxies remains a matter of debate even in high-luminosity AGN (e.g., Harrison et al. 2023; Harrison & Ramos Almeida 2024). The impact predicted by numerical simulations is likely cumulative over the multiple short-lived episodes that are expected during the lifetime of the AGN (Piotrowska et al. 2022). The recent study published by Ellison et al. (2021) based on kpc-scale observations of the Extragalactic Database for Galaxy Evolution-Calar Alto Legacy Integral Field Area (EDGE-CALIFA) sample (Sánchez et al. 2012; Bolatto et al. 2017) found that the molecular gas fractions (Σgas/Σ*) of central AGN regions are a factor of ≃2 lower than those in nonAGN star-forming regions. However, AGN variability, which is linked to the chaotic nature of the black hole feeding process, tends naturally to eliminate any significant correlation between the global (kpc-scale) molecular gas content and the AGN luminosity (Izumi et al. 2016; Rosario et al. 2018; Anglés-Alcázar et al. 2021; García-Burillo et al. 2021; Ramos Almeida et al. 2022). The search for a clear observational “smoking gun” signature of AGN feedback on the distribution and kinematics of molecular gas should be conducted on spatial scales closer to the central engine (tens to hundreds of parsecs) considering the short flickering timescales (< 105 yr) associated with individual nuclear activity episodes (Martini 2020; Hickox et al. 2014; Schawinski et al. 2015; King & Nixon 2015).
Observations of the circumnuclear disk (CND) of the Seyfert 2 galaxy NGC 1068 obtained with the Atacama Large Millimeter Array (ALMA) unveiled the dust continuum and molecular line emission in the CO(6–5) line from a disk or torus of  and 10 pc in diameter (García-Burillo et al. 2016). This result was confirmed by further ALMA images revealing the many “faces” of the torus obtained in a set of different molecular lines showing the different layers of the disk extending from 7 to up to 30 pc scales (Gallimore et al. 2016; Imanishi et al. 2018, 2020; Impellizzeri et al. 2019; García-Burillo et al. 2019). These new high-resolution images showed that the launching of the molecular outflow is shaping not only the morphology of the torus but also its kinematics. The wide-angle AGN wind launched from the accretion disk of NGC 1068 is impacting a sizeable fraction of the gas inside the torus, driving a dusty molecular outflow identified by vertical X-shape gas protrusions. The picture of an outflowing torus, also invoked to explain the ALMA observations of NGC 1377 (Aalto et al. 2017, 2020) and NGC 5643 (Alonso-Herrero et al. 2018), fits the scenarios predicted by radiation-driven wind models and numerical simulations (e.g., Elitzur & Shlosman 2006; Wada 2012, 2015; Wada et al. 2016; Chan & Krolik 2016, 2017; Hönig & Kishimoto 2017; Williamson et al. 2019, 2020; Venanzi et al. 2020). In this scenario, inflowing and outflowing components can coexist in different regions of the torus, a manifestation of the complex nature of the obscuring material around AGN (Ramos Almeida & Ricci 2017; Hönig 2019; García-Bernete et al. 2024). On larger spatial scales, the ALMA images of NGC 1068 published by García-Burillo et al. (2014, 2019) resolved its CND as a ringed disk of D ≃ 400 pc in size with a marked deficit of molecular gas in its central ≃130 pc region. This highly contrasted ring morphology, reminiscent of a cavity, reflects the accumulation of molecular gas on the working surface of the AGN-driven ionized gas wind of NGC 1068. In agreement with this picture, the kinematics of molecular gas show strong deviations from circular motions modeled as a three-dimensional outflow that reflects the effects of AGN feedback.
The case of NGC 1068 is by no means unique. The existence of a cavity or lacuna in the inner 500 pc of the cold molecular gas distribution of the Seyfert 2 galaxy NGC 2110 was described by Rosario et al. (2019). The cavity, oriented in the direction of the radio jet and filled with warm molecular gas and an ionized gas wind, was also recently analyzed by Peralta de Arriba et al. (2023), pointing to a causal relationship similar to that invoked to account for the nuclear-scale molecular gas deficit in NGC 1068. A deficit of molecular gas attributed to gas removal by the AGN wind was also identified in the CND of the Seyfert 2 galaxies NGC 5728 (Shimizu et al. 2019), ESO428-G014 (Feruglio et al. 2020), and NGC 7172 (Alonso-Herrero et al. 2023).
Significantly large (diameters ≥20–50 pc) and massive (∼105 − 107 M⊙) tori have been detected in cold molecular gas and dust in other local Seyferts, low-luminosity AGN, and compact obscured nuclei (Aalto et al. 2017, 2019; Alonso-Herrero et al. 2018, 2019, 2020, 2023; Izumi et al. 2018, 2023; Audibert et al. 2019, 2021; Combes et al. 2019; García-Burillo et al. 2021; Tristram et al. 2022). In particular, García-Burillo et al. (2021) used ALMA observations of the molecular gas obtained in the CO(3–2) and HCO+(4–3) lines with spatial resolutions of ≃0.1″ (7 − 13 pc) in the CND of 19 nearby AGN, which belong to the core sample of the Galaxy Activity Torus and Outflow Survey (GATOS) and the southern hemisphere low-luminosity AGN of the Nuclei of Galaxies (NUGA) sample (Combes et al. 2019). The GATOS core sample was selected from the Swift/BAT catalog of AGN (Baumgartner et al. 2013) with distances of < 28 Mpc and luminosities of LAGN(14–150 keV) ≥1042 erg s−1 to purposely complement the lower-luminosity range covered by the NUGA survey (Combes et al. 2019). The galaxies analyzed by García-Burillo et al. (2021) all exhibit AGN-ionized outflows and/or radio jets launched from the vicinity of dusty molecular disks, which have median diameters and molecular gas masses of ∼42 pc and ∼6 × 10⁵ M⊙, respectively. These compact disks tend to show an orientation perpendicular to the AGN outflow axes, as would be expected from an equatorial torus geometry.
García-Burillo et al. (2021) analyzed the concentration of cold molecular gas (index-I in the notation used in their paper). These authors defined the concentration index as the ratio of gas surface densities derived at r < 50 pc (a region characteristic of the tori and their surroundings) and r < 200 pc (a region where molecular gas reservoirs are expected to build up and potentially reveal the smoking gun signature of AGN feedback), namely index-I ≡ log(ΣH250 pc/ΣH2200 pc). Their findings indicate that there is a statistically significant trend pointing to a decrease in molecular gas concentration indices in the higher-luminosity and higher-Eddington-ratio sources of their sample beyond a turnover X-ray luminosity of L2 − 10 keV ≃ 1042 erg s−1, suggesting the existence of two “branches” in the parameter space defined by the concentration index and the AGN luminosity. AGN with luminosities below the turnover point show higher molecular gas concentration indices. This result would agree with the theoretical prediction that outflows in the highest luminosity AGN could partially clear the material around the black hole on the scales of the tori and their surrounding regions. The existence of a qualitatively similar trend was first found by Ricci et al. (2017a), recently confirmed by Ricci et al. (2022, 2023a), who found that the covering factor measured at X-ray wavelengths decreases with the Eddington ratio based on a survey of AGN in the local Universe, an indication that radiative feedback is an efficient mechanism capable of regulating the distribution of the gas and dust within the torus and its surrounding region preferentially in the most extreme AGN (see also Ezhikode et al. 2017; González-Martín et al. 2017; Zhuang et al. 2018; Toba et al. 2019, 2021; García-Bernete et al. 2022). The latter is consistent with evidence from analytical models suggesting that IR-driven dusty winds can develop most favorably within a certain range of gas column densities and Eddington ratios (e.g., Venanzi et al. 2020; Alonso-Herrero et al. 2021; García-Bernete et al. 2022).
More recently, Elford et al. (2024) studied how the concentration of molecular gas as defined by García-Burillo et al. (2021) changes as a function of LX for 16 objects in the millimeter(mm)-Wave Interferometric Survey of Dark Object Masses project (WISDOM) sample. In their analysis, Elford et al. (2024) included a sizeable fraction (≃63%) of early-type galaxies (ETGs: 6 E and 4 SO Hubble types) that have X-ray luminosities well below the turnover identified in the distribution of concentration indices derived for the spiral galaxy sample studied by García-Burillo et al. (2021). Six of the ten ETGs analyzed by Elford et al. (2024) showed concentration indices slightly below the range found by García-Burillo et al. (2021) for very low-luminosity objects expected to be ruled by secular evolution processes rather than by AGN feedback. As we argue in Sect. 9, this discrepancy is not surprising, as we do not expect to find a direct evolutionary link that could connect bulge-dominated ETGs to disk-dominated spiral galaxies in the scenario described by García-Burillo et al. (2021) and this paper. In contrast, the few spiral galaxies in Elford et al. (2024) with X-ray luminosities higher than 1042 erg s−1 closely follow the relation found by García-Burillo et al. (2021).
2. Aims of this paper
To verify the results of García-Burillo et al. (2021) on a more robust statistical basis, we have selected for this paper a larger sample of nearby (DL = 7 − 45 Mpc) 45 AGN and 19 nonAGN galaxies that have high-resolution multiline CO observations obtained at millimeter wavelengths by the ALMA and/or Plateau de Bure Interferometer (PdBI) arrays to study the distribution of cold molecular gas at CND scales (r ≤ 200 pc) in our sample. We explore whether the concentration and normalized radial distribution of cold molecular gas change as function of the X-ray luminosity to quantify the imprint left by AGN feedback on our sources. We purposely include in our analysis the data from a subset of 19 nonAGN galaxies used as a comparison sample. Unlike the analysis of García-Burillo et al. (2021), restricted to the use of data obtained from a single CO line (the 3–2 transition), in this work we use the available data from three different CO transitions (the 1–0, 2–1, and 3–2 rotational lines) to investigate the dependence of molecular gas concentration on the CO line. We also use in our analysis near Infrared (NIR) integral field spectroscopy data obtained for the H2 1-0 S(1) line available for a subset of 35 targets of the CO-based sample. These observations allow us to complete using a larger sample the pioneering work of Hicks et al. (2013), who studied the differences in H2 surface brightness profiles between quiescent and Seyfert galaxies and found evidence of higher central concentration in H2 surface brightness profiles in AGN. The new data are used to derive the concentration and normalized radial distribution of the hot molecular gas phase as well as the hot-to-cold-molecular gas mass ratio as a function of the X-ray luminosity. Taken together, these observations provide the basis for an evolutionary scenario describing the feeding and feedback cycle of the gas in AGN that can be compared with the predictions of state-of-the-art numerical simulations.
The paper is organized as follows. We present in Sect. 3 the galaxy sample. Section 4 describes the ALMA and NIR observations used in this work. Section 5 studies the distribution of cold molecular gas derived from CO performed by analyzing how the concentration and the radial distribution of this component changes as function of the X-ray luminosity in our sample, as detailed in Sects. 5.1, 5.2, 5.3, and 5.4. Section 6 presents a similar analysis for the hot molecular gas component probed by the NIR observations of our sample, as detailed in Sects. 6.1 and 6.2. Section 7 describes how the hot-to-cold molecular gas mass ratio changes as a function of the X-ray luminosity in our sample. A tentative scenario describing an evolutionary link connecting the galaxies analyzed in this work is presented in Sect. 8. The main conclusions of the paper are summarized in Sect. 9.
3. The sample
Table A.1 lists the main observational parameters of the sample used in this work. We selected a sample of AGN and nonAGN spiral galaxies1 that have high-resolution CO(3-2), CO(2-1), and/or CO(1-0) observations obtained with ALMA and/or the PdBI arrays from different surveys. We consider a galaxy to be an AGN if it is well detected in hard X-rays and have a corresponding Seyfert/LINER classification according to NED. However, six of the galaxies detected in hard X-rays have LX ≤ 1040 erg s−1 but no optical identification of an AGN (see Table A.1 for details). For these sources a non-negligible contamination by X-ray binaries cannot be excluded. The combined sample includes the GATOS survey (García-Burillo et al. 2021; Alonso-Herrero et al. 2021) the NUGA survey (García-Burillo et al. 2003; García-Burillo & Combes 2012; Combes et al. 2019), a selection of targets of the Physics at High Angular resolution in Nearby GalaxieS survey (PHANGS; Leroy et al. 2021), the WISDOM sample (Onishi et al. 2017; Elford et al. 2024) 2, the Luminous Local AGN with Matched Analogs survey (LLAMA; Rosario et al. 2018), as well as case studies of individual galaxies like M51 (Schinnerer et al. 2013), NGC1068 (García-Burillo et al. 2019), and NGC7172 (Alonso-Herrero et al. 2023). We also used the CO(1–0) images obtained in a sample of 12 AGN observed with ALMA by Ricci et al. (2023b). The AGN targets are selected to lie at a range of distances DL = 7 − 45 Mpc. We set the upper limit to the distance to image with enough spatial resolution the distribution of molecular gas in the circumnuclear disks of our targets. In particular, the median value of the spatial resolutions of the CO observations used in this work is 36 pc and the corresponding value of the maximum recoverable scales of the images is ≃400 pc. We also used a comparison sample of nonAGN drawn from the LLAMA and PHANGS surveys, with a range of distances similar to the AGN sources: DL = 7 − 41 Mpc. The CO sample comprises 57 different images of 45 AGN as well as maps of 19 nonAGN galaxies. In our AGN sample 7 of the galaxies have images obtained in more than one CO transition. The latter includes NGC 6300, NGC 5643, NGC 7314, NGC 4388, and NGC 3227, which have data available from the 3–2 and 1–0 CO transitions, as well as NGC7172 and NGC 5728, which have data from the 3–2, 2–1, and 1–0 CO transitions. The availability of these data allows us to study the dependence of the trends analyzed in this paper on the particular CO transition used to image the distribution of molecular gas in these sources.
Near-IR K-band (or H+K-band) integral field spectroscopy data are available for 46 of the galaxies of our sample, seven of which are nonAGN. Of these galaxies 35 have well detected H2 1–0 S(1) 2.12 μm (S/N > 3) out to a radius of 200 pc. Two AGN (NGC 1365 and NGC 628) and four nonAGN (IC 5332, NGC 1079, NGC 3621, and NGC 5845) were found to have no detectable H2 emission within this region and thus no concentration index was calculated for these targets. While NGC 4579, NGC 4501, and NGC 7465 have well detected H2 emission out to a radius of 50 pc, available data only cover 65%, 62%, and 38%, respectively, of the deprojected 200 pc radius aperture and thus only upper limits on the concentration index are obtained. In the majority of the 35 galaxies with well detected H2 emission (24 galaxies) the data provide full coverage of the 200 pc radius deprojected aperture and in all other cases at least 70% of the aperture is measured and an aperture correction was applied assuming an azimuthally symmetric flux distribution.
Hard X-ray luminosities in the 2 − 10 keV band (hereafter LX) are adopted as a proxy for the AGN luminosity. For the majority of our sources we take LX from Ricci et al. (2017b) rescaled to the assumed distances, except for five sources where we used archival observations to compute X-ray luminosities (see details in Table A.1 and Appendix B).
Figure 1 shows the distribution of independent data sets of AGN and nonAGN galaxies of our combined CO and NIR sample as a function of LX. AGN targets are evenly distributed as a function of LX below the turnover luminosity (LX ≃ 1042.0 erg s−1), a regime for which García-Burillo et al. (2021) found evidence of systematically high values of the concentration of molecular gas derived from CO(3-2). In this luminosity range (1037.5 erg s−1 ≤ LX ≤ 1042.0 erg s−1) the CO sample includes 27 galaxy images and NIR data from 15 targets. Beyond the turnover luminosity our CO sample includes a similar number of galaxy images: 30 CO and 17 NIR maps. Galaxies beyond the turnover are concentrated in a comparatively smaller luminosity range: 1042.0 erg s−1 ≤ LX ≤ 1043.5 erg s−1. This uneven distribution of the sources as a function LX ensures that the abrupt transition to lower molecular gas concentration indices, which appears beyond the turnover luminosity (García-Burillo et al. 2021), can be sufficiently sampled.
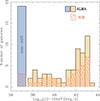 |
Fig. 1. Histograms showing the distribution of independent data sets obtained from the targets of the combined ALMA+PdBI and NIR data samples as a function of the AGN luminosities measured at X-ray wavelengths (LX) in the 2–10 keV band (in log units). For the sake of comparison, galaxies classified as nonAGN populate the histogram arbitrarily located at log(LX) = 37 erg s−1. |
4. Observations
4.1. CO observations
Details on the reduction, imaging and post-processing of the CO data sets of the different surveys used in this work are included in the references listed in Sect. 3. The CO-based ‘cold’ molecular gas masses were derived from the following expression, which includes the mass of Helium ( ):
):
 (1)
(1)
In Eq. 1, νij and SCOij are the frequency and the flux of the CO(i-j) transition (in Jy km s−1-units), Rij is the assumed CO(i-j)-to-CO(1-0) line ratio (in Tmb-units), αCO is the assumed CO(1-0)-to-H2 conversion factor in units of mol cm−2 (K km s−1)−1, and D is the distance in Mpc. Mass surface densities for the two representative regions used in this work (r ≤ 50 pc and r ≤ 200 pc) are derived by deprojecting the CO images using the PA and i values listed in Table A.1.
The estimates of the molecular gas masses derived from the different CO lines used in this work are subject to uncertainties related to the assumed Rij ratio and to the adopted CO–to–H2 conversion factor3. In line with the values typically assumed in the literature (e.g., Genzel et al. 2010; García-Burillo et al. 2021) we estimate that the latter may contribute up to ∼0.12–0.13 dex each if we allow them to explore the typical range of values seen in the observations of different populations of galaxies on nuclear spatial scales and, also, if we assume that these uncertainties are uncorrelated. Under these extreme hypotheses the total uncertainty would amount to ±0.20 dex. However, we emphasize that the analysis of the concentration indices and normalized radial distributions of molecular gas in the galaxies of the sample defined in Sect. 5 would be insensitive to any galaxy-to-galaxy changes in the global conversion factors. Furthermore, any potential change of these conversion factors, which are here assumed to be the same for the two spatial scales analyzed in this work (r ≤ 50 pc and r ≤ 200 pc), would likely reinforce the trends found in Sect. 5 (see discussion in Sect. 5.2 and also related discussion in Sect. 8 of García-Burillo et al. 2021).
4.2. NIR observations
All NIR Integral Field Unit (IFU) observations were obtained with ESO SINFONI (Eisenhauer et al. 2003; Bonnet et al. 2004) with the exception of NGC 7465, which was observed with OSIRIS at the W. M. Keck Observatory (Larkin et al. 2006). Adaptive optics (AO) was employed in the acquisition of the vast majority of the data sets (31 in natural guide and 2 in laser guide star mode), and of those data sets without AO all were AGN and only one lacked a H2 2.12 μm detection (see Table A.2 for details). Reduction of the SINFONI data was performed using the SINFONI Data Reduction Software or a custom package SPRED developed at MPE (Abuter et al. 2006). The OSIRIS data reduction pipeline was used for the single OSIRIS data set. In all cases reduction of the data followed standard reduction steps needed for near-IR spectra as well as additional routines necessary to reconstruct the data cube. For improved subtraction of OH sky emission lines the routines mxcor and skysub (Davies 2007) were used, which correlate reconstructed object and sky cubes spectrally and shift them such that their OH line wavelengths match before subtracting the scaled sky frame. Nearby standard stars (A- or B-type) were observed close in time to the science frames and used for telluric correction and flux calibration. The typical flux calibration uncertainty is accurate to at least 10% in all data sets.
The emission-line flux distribution was extracted by fitting the H2 2.12 μm line profile using our custom code LINEFIT (Davies et al. 2011). This code fits the emission line in the spectrum of each spatial element, or spaxel, with an unresolved line profile (a sky line) convolved with a Gaussian, as well as a linear function to the line-free continuum. The point spread function (PSF) and the galaxy center, assumed to be coincident with the AGN location, are determined through fitting of the CO 2.29 μm bandhead. The CO bandhead was fit at each spaxel with a broadened late-type stellar template found to be well matched with our galaxy spectra. The intrinsic K-band CO equivalent width is assumed to be constant to within 20% at 12 Å, and a deviation from this value therefore represents dilution from the nonstellar continuum (e.g., Davies 2007; Hicks et al. 2013; Burtscher et al. 2015). This nonstellar continuum is assumed to represent the unresolved AGN-associated dust emission which we then utilize to establish the galaxy center and characterize the PSF.
Under the assumptions of local thermal equilibrium and an excitation temperature of 2000 K, the mass of ‘hot’ molecular gas component is obtained from (e.g., Scoville et al. 1982; Riffel et al. 2014):
 (2)
(2)
As for the cold molecular gas component when we derive the hot molecular gas surface densities for r ≤ 50 pc and r ≤ 200 pc we adopt the same conversion factors for the two spatial scales and also correct for the mass of Helium using the expression  . As argued in Sect. 6.1, we note that assuming common conversion factors for both spatial scales would underestimate the trends found in Sect. 6.
5. Distribution of cold molecular gas
5.1. Concentration indices
Following the methodology adopted by García-Burillo et al. (2021) we explore below if a simple parameterization of the radial distribution of molecular gas can reveal the imprint of AGN feedback in the galaxies of the sample. To accomplish this, we first derived the average molecular gas surface densities measured from the different CO lines using two spatial scales representative of the nuclear (r ≤ 50 pc) and CND environments (r ≤ 200 pc). In our derivation we used the position angles (PA) and inclination angles listed in Table A.1. With this definition, nuclear scales probe the region typically occupied by the molecular tori and their immediate surroundings (García-Burillo et al. 2021; Alonso-Herrero et al. 2021). We normalize the nuclear scale gas surface densities ( ) by the corresponding densities measured on CND scales (
 ). In our estimate of
  and
and  we adopted the same values of the conversion factors (R31, R21, and αCO) for the two spatial scales. This normalization counterbalances any potential bias associated with the different overall molecular gas content of the galaxies of the sample and it therefore serves as a measurement of the concentration of molecular gas, which is the physical parameter relevant to the present analysis. Furthermore, the normalized radial distribution is by definition insensitive to any potential galaxy-to-galaxy change in the global conversion factors.
The left panel of Figure 2 illustrates how the concentration index of cold molecular gas, defined as the ratio (in logarithmic units) of the average H2 surface densities derived from CO line emission at the two spatial scales representative of the nuclear and CND scales changes as a function of LX in the galaxies of the sample. The concentration index (hereafter referred to as CCI) is therefore defined as:
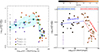 |
Fig. 2. Distribution of cold molecular gas. Left panel: Concentration of “cold” molecular gas measured for the central regions of galaxies of the sample derived from the ratio (in log units) of the average H2 surface densities estimated from CO line emission at two spatial scales: r ≤ 50 pc ( |


 (3)
(3)
Table C.1 lists the values of CCI for the sample. A visual inspection of Fig. 2 indicates that the distribution of median values of the concentration index for the seven luminosity bins listed in Table 14 shows evidence of a turnover at LX ≃ 1041.5 erg s−1. AGN with LX ≤ 1041.5 erg s−1 and nonAGN galaxies are located along a moderately ascending sequence, hereafter referred to as the “AGN build-up branch”, which is characterized by median values of CCI that monotonically increase with LX from ≃ + 0.27 ± 0.13 to ≃ + 0.58 ± 0.23. However, we note that given the associated error bars, the reported increase in CCI among the galaxies of the “AGN build-up branch” is not statistically significant. AGN of higher luminosities lie at a descending sequence, hereafter referred to as the “AGN feedback branch”, which is characterized by median values of CCI that sharply decrease from ≃ + 0.56 ± 0.13 down to ≃ − 0.05 ± 0.07. The concentration of molecular gas in the sample expands a statistically significant 0.63 dex range between the galaxies lying at the high end of the “AGN build-up branch” and the galaxies showing the most extreme nuclear-scale molecular gas deficits in the “AGN feedback branch”. As illustrated in Fig. D.1, if we adopt the region defined by the outer corona of the CND (50 pc ≤ r ≤ 200 pc) to normalize the molecular surface density of the nuclear region, the values of this alternative definition of the concentration of cold molecular gas expand a larger 0.72 dex range in our sample, equivalent to an overall factor ≥5 difference. We note that although galaxies along the AGN feedback branch tend to have higher Eddington ratios compared to the galaxies in the AGN build-up branch (as shown in the right panel of Fig. 2), the corresponding trend of CCI as a function of the Eddington ratio, which is available for fewer sources in our sample, is less statistically significant than as a function of LX (see Fig. D.2).
Median values of the concentration indices for the cold and hot molecular gas and hot-to-cold ratios.
To further confirm statistically the existence of two branches grouping the galaxies of the sample in the parameter space of Fig. 2, we used the multivariate adaptive regression splines (MARS) fit routine available from the Rstudio package (R Core Team 2021). The MARS algorithm gives the position of the breaking points (cut points) for a linear regression using multiple slopes. To this aim we derived the MARS fit on 100 Monte Carlo realisations of the CCI versus LX relation taking into account the data uncertainties in both axes due to the assumed conversion factors (±0.2 dex), and on the AGN luminosities (±0.15 dex). The result of the fit is displayed in the right panel of Fig. 2. From this simulation we find a turnover for the distribution at log10LX = 41.51 ± 0.31 erg s−1 with a fit value of CCI = 0.53 ± 0.09, which similarly splits the sample into the two branches identified above based on the trend shown by the median values of CCI as a function of LX. The power-law index found for the AGN buildup branch, N = +0.03 ± 0.05, is consistent with a flat trend for LX ≤ 1041.5 erg s−1, confirming that the differences in CCI values are not statistically significant in this luminosity regime. In contrast, the power-law index found for the AGN feedback branch, N = −0.36 ± 0.08, shows a statistically significant evidence (≃4.5σ) of a descending trend of the concentration of molecular gas for galaxies lying beyond the turnover X-ray luminosity.
The fit of MARS for the distribution of CCI values shown in the lower panel of Fig. D.1, which uses the outer corona region of the CND to normalize the molecular surface densities, finds similar values for the turnover at log10LX = 41.54 ± 0.25 erg s−1 with a fit value of CCI = 0.64 ± 0.10, as well as power-law indices N = +0.04 ± 0.06 and N = −0.43 ± 0.09, for the AGN build-up and feedback branches respectively. The latter implies that the power-law index along the AGN feedback branch differs from zero by a statistically significant factor ≃4.8σ.
5.2. Dependence of trends on CO transitions and conversion factors
The picture drawn from the different CO lines is overall consistent within the uncertainties regarding the existence of the two branches described above. In particular, along the AGN feedback branch, where the number of independent data sets (N) from the three transitions is comparable (N = 13, 11, and 11 for the CO(3–2), CO(2–1), and CO(1–0) lines, respectively) the derived CCI values concur to show a similar monotonic decline with LX beyond the turnover (see discussion in Appendix E). We can therefore conclude that for the typical range of physical conditions probed by the different CO transitions (nH2 ≃ a few 102 − 5 cm−3, TK ≃ 10–100 K) the decreasing trend of CCI along the AGN feedback branch reported in Fig. 2 shows a weak dependence on the particular line selected.
While a sizeable fraction of the data along the AGN build-up branch has been obtained only in the CO(2–1) line (N = 6, 13, and 3 for the CO(3–2), CO(2–1), and CO(1–0) lines, respectively), the range of CCI values derived from the different transitions is comparable within the errors. However, confirmation of whether the trend of CCI with LX along the AGN build-up branch is either moderately increasing or flat would require obtaining more data in the CO(3–2) and CO(2–1) lines.
While the values of R31, R21 for the galaxies in our sample are not constrained, we nevertheless expect that molecular gas will be comparatively less excited on nuclear scales at low AGN luminosities. Significant changes in the value αCO have only been described within galaxies on kpc-scales between their central kpc-region and their outer (r > 0.2R25) disks (e.g., Sandstrom et al. 2013; Yasuda et al. 2023). In any case, this is well beyond the spatial scales relevant to this work. The recent work of Teng et al. (2023) found that the value of αCO in galaxy centers decreases with CO opacity and shows a strong anticorrelation with the gas velocity dispersion. Moreover, if anything, αCO values would probably have to be lowered on the nuclear (r ≤ 50 pc) as opposed to the CND-scales (r ≤ 200 pc) of the highest luminosity AGN galaxies in our sample where gas is expected to be more strongly irradiated and live in a dynamically perturbed environment characterized by an enhanced turbulence. Overall, our adopted choice of common values of the conversion factors for the nuclear and CND scales would be therefore conservative, underestimating the differences between the concentration of molecular gas measured for AGN build-up and AGN feedback branch galaxies shown in Fig. 2.
5.3. Radial distributions
We show in Sect. 5.1 that the distribution of CCI values for the galaxies of the sample shows a turnover at log10LX ≃ 41.5 ± 0.3 erg s−1. We explore below in more detail how the shape of the radial profiles of cold molecular gas changes as a function of LX in the sample. To this aim, we derived the radial profiles of cold molecular gas out to r = 210 pc for each target using a radial binning Δr = 20 pc, which corresponds to about half of the median value of the spatial resolutions of the CO observations used in this work. Individual profiles are further normalized by the CO flux integrated out to r = 210 pc for each target (Inorm(r)). Finally, we derived the median values of Inorm(r) and their associated median absolute deviations for the 7 LX bins defined in Sect. 5.1.
Figure 3 shows the Inorm(r) profiles derived from CO in the sample. As expected, the profiles show remarkable differences that fairly reflect the trends shown by the CCI values as function of LX. Profiles appear as flat or inverted (i.e., with lower Inorm(r) values at small radii) for the highest X-ray luminosities of the galaxies of the AGN feedback branch grouped in LX bins 1, 2, and 3. In contrast, galaxies in the peak phase of the AGN build-up branch, grouped in LX bins 5, and 6, show highly concentrated molecular gas distributions. Furthermore, the lowest luminosity AGN and the nonAGN targets, grouped in bin 7 and the nonAGN bin respectively, show comparatively less concentrated radial profiles of molecular gas.
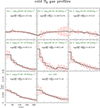 |
Fig. 3. Average normalized radial distributions (Inorm(r)) of “cold” molecular gas derived from CO out to r = 210 pc for the seven LX bins defined in Sect. 4.1. We also show the Inorm(r) profile representative of the nonAGN galaxy subset. Bins 1–4 and 5–7 correspond to the AGN feedback and build-up branches, respectively. Histograms and error bars for each bin represent the median and the median absolute deviation values derived from the distribution of normalized individual galaxy profiles sampled with a radial binning Δr = 20 pc. The red-shaded areas illustrate the uncertainties around the median values. The median value of the concentration index of molecular gas and its associated uncertainty are shown in each panel. The common scales adopted for all bins in the x and y axes are shown in the lower left panel. |
Figure 4 shows that these differences are statistically significant when we compare the profiles of the highest luminosity AGN feedback branch targets (bin 1) with those of the highest luminosity AGN build-up phase targets (bin 5). A similar conclusion can be drawn when we compare the radial profiles of the galaxies belonging to the two extreme LX classes, namely bins 1 and 7. In particular, Kolmogorov-Smirnov (KS) tests performed to reject the null hypothesis that the two pairs of radial profiles corresponding to bins 1 and 5, as well as to bins 1 and 7, are drawn from the same distribution yield consistently low p-values in either case (p-values ≤ 0.001).
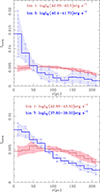 |
Fig. 4. Comparison of radial profiles. Upper panel: Comparison between the average radial distributions of molecular gas for bins 1 and 5, which correspond to the subsets of galaxies showing the lowest and the highest concentration indices of molecular gas in the sample respectively. Lower panel: Same as the upper panel but comparing the average radial distributions of molecular gas for bins 1 and 7, which represent the highest and the lowest ends of the LX distribution in the sample, respectively. |
Figures 5, 6, and 7 show the 2-dimensional and normalized radial distributions of the cold molecular gas in the inner r ≤ 200 pc central regions of eight galaxies representative of the different AGN and nonAGN bin categories. The CO images help visualize directly the noticeable progression in the morphology of the distribution of the gas as a function of LX. The latter is characterized by a marked nuclear-scale (r ≤ 50 pc) deficit in the AGN feedback branch targets belonging to bins 1, 2, and 3 (NGC 7582, NGC 1068, and NGC 4388, respectively), which is reminiscent of a ring-like distribution. This is in stark contrast with the highly concentrated nuclear-scale distribution of the gas in the targets of bins 4, 5 and 6 (NGC 6300, NGC 613, and NGC1808, respectively). The presence of a contrasted two-arm CO trailing nuclear spiral structure in NGC 613 and NGC 1808 has been interpreted as smoking gun evidence of ongoing AGN feeding in these targets (Audibert et al. 2019, 2021). This particular morphology would appear at an evolutionary stage where the gas is piling up on nuclear scales under the influence of negative gravity torques inside the inner Lindblad resonance (ILR) regions of the stellar bars (Wada 1994; Buta & Combes 1996; Peeples & Martini 2006; Combes et al. 2014). The distribution of cold molecular gas in the lower luminosity and nonAGN targets, shown in Fig. 7 (NGC 4826 and NGC 7727, respectively) is less centrally concentrated on average.
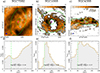 |
Fig. 5. Maps and radial profiles. Upper panels: CO velocity-integrated intensity maps derived for three representative targets selected from the galaxies of LX bin 1 (NGC 7582; (a)), bin 2 (NGC 1068; (b)), and bin 3 (NGC 4388; (c)), as defined in Sect. 5.1. Contour levels have a logarithmic spacing from 2.5σ to 90% of the peak CO intensity inside the displayed field of view, which corresponds to 400 pc × 400 pc. The (green) ellipses identify the circular regions in the deprojected planes of the galaxies extending out to r ≤ 50 pc and r ≤ 200 pc. The (blue) filled ellipses in the bottom left corners represent the beam sizes of the observations. Lower panels: Normalized radial distributions of molecular gas derived out to r = 210 pc for the galaxies shown in the upper panels. The inner r ≤ 50 pc region is delimited by the dashed line. The estimated molecular gas concentration indices are displayed in panels (d)-to-(f). |
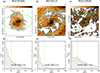 |
Fig. 6. Same as the upper and lower panels of Fig. 5 but for three representative targets selected from the galaxies of LX bin 4 (NGC 6300; (a)), bin 5 (NGC 613; (b)), and bin 6 (NGC 1808; (c)). Symbols as in Fig. 5. |
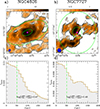 |
Fig. 7. Same as the upper and lower panels of Fig. 5 but for two representative targets selected from the galaxies of LX bin 7 (NGC 4826; (a)) and from the subset of nonAGN (NGC 7727; (b)). Symbols as in Fig. 5. |
5.4. Nonparametric analysis of the radial profiles
We confirm these results with an alternative, nonparametric method that builds on the Gini coefficient, G. This statistic, originally an econometric tool to measure income or wealth (in)equality, has been adopted in astronomy to for example quantify the (in)equality of the flux/brightness distribution in pixel sets (Abraham et al. 2003; Lotz et al. 2004; Davis et al. 2022). Here, we use G in a different manner to assess the shape of our CO radial profiles. In short, CO flux and radius in our case respectively play the roles of people and income in the original application of G. More precisely, we measure the inequality in the distribution of radius2, so that a flat radial profile corresponds to G ≈ 1/3, as expected for a uniform distribution. This is basically a normalization prescription that does not affect the results.
We calculate G for each galaxy in our sample over the r = 0–200 pc range with the DescTools R package. Associated 99% confidence intervals are derived from bootstrap percentiles. Fig. 8 (upper panel) shows G as a function of LX for the X-ray detected AGN galaxies. To first order, the overall distribution resembles that of CCI in Fig. 2: a virtually flat trend up to LX ≈ 1041.5 erg s−1, at which point a noticeable drop sets in. This brings X-ray brightest galaxies close to the G ≈ 1/3 value that, as indicated above, corresponds to a flat CO radial profile. The excellent agreement between the G and CCI trends stems from the tight correlation between the two statistics (Spearman coefficient, Rs of ∼0.85), which we show in Fig. 8 (middle panel). Fig. 8 (lower panel) displays an even tighter anticorrelation between G and the flux-weighted mean radius (Rs ∼ −0.94), which help us visualize the meaning of G in this context. I.e., high G values are linked with the build-up of nuclear concentrations of gas, whereas G decreases as the mean radius of the CO light shifts outwards. In Fig. 8 (lower panel), G ≈ 1/3 corresponds to mean radii of ≲140 pc, which is close to the expectation for a radial profile flat over the r = 0 − 200 pc range (2/3 × 200 ≈ 133 pc).
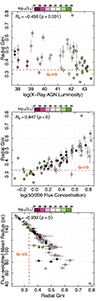 |
Fig. 8. Gini coefficients derived for the radial profiles obtained from the CO distributions in the galaxies of the sample as a function of LX (upper panel) and the concentration index of cold molecular gas (middle panel). Flux-weighted mean radii of the normalized distribution of cold molecular gas as a function of the Gini coefficients of the radial profiles derived for the galaxies of our sample (lower panel). Error bars account for the estimated uncertainties on the Gini coefficients. We indicate the estimated correlation coefficients (Rs) and their associated p-values for the three distributions. Gini coefficient values are color-coded as a function of LX (black indicates nonAGN galaxies). |
6. Distribution of hot molecular gas
More than half of the targets of the CO sample have available data from the H2 1–0 S(1) 2.12 μm line emission, a tracer of ‘hot’ molecular gas (TK ≃ a few 103 K). Using a similar methodology adopted in Sects. 5.1 and 5.3 to study the cold molecular gas, we use the NIR data to derive the concentration indices and the normalized radial distributions of hot molecular gas in the galaxies of our sample and investigate their potential trends with LX in Sects. 6.1 and 6.2.
6.1. Concentration indices
Figure 9 shows the change with LX of the concentration of hot molecular gas measured for the central regions of the galaxies of the sample as derived from the ratio of the average H2 surface densities estimated from the 2.1 μm line emission at the two spatial scales used in this work: nuclear (r ≤ 50 pc;  ) and CND scales (r ≤ 200 pc;
  ). The concentration index of hot molecular gas (hereafter referred to as HCI) is therefore defined as:
 (4)
(4)
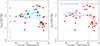 |
Fig. 9. Distribution of “hot” molecular gas. Left panel: Same as the left panel of Fig. 2 but showing the change with LX of the concentration of “hot” molecular gas measured for the central regions of the galaxies in our sample derived from the ratio (in log units) of the average H2 surface densities estimated from the 2.1 μm line emission at two spatial scales: r ≤ 50 pc ( |


By definition, the values of HCI are insensitive to any potential galaxy-to-galaxy variation of the conversion factors implicitly assumed in Eq. (2). Table C.1 lists the values of HCI for the sample.
Figure 9 shows that the trend of HCI with LX, while qualitatively similar, is significantly much less pronounced than the trend shown by the CCI index in Fig. 2. The distribution of median values of HCI for the five luminosity bins listed in Table 15 shows only tentative evidence of a turnover at LX ≃ 1042.0 erg s−1. The position of this break point is close to the turnover identified in the distribution of galaxies of the sample in the CCI-LX parameter space of Fig. 2. AGN below LX ≤ 1042.0 erg s−1 in bins 3, 4, and 5 lie at a sequence characterized by median values of HCI that monotonically increase with LX from ≃ + 0.46 ± 0.07 to ≃ + 0.62 ± 0.25. However, we note that given the associated error bars, the reported increase in HCI is not statistically significant. Beyond the turnover luminosity, AGN in bins 1 and 2 lie at a descending sequence qualitatively similar to the “AGN feedback branch” of Fig. 2, which is characterized by median values of HCI that decrease from ≃ + 0.24 ± 0.05 down to ≃ + 0.16 ± 0.18. These values are marginally different to the ones characterizing the peak phase of the “AGN build-up branch”. In particular, the concentration of hot molecular gas in the sample spans a 0.46 dex range between the galaxies lying in the peak phase of the AGN build-up branch and the most extreme targets of the AGN feedback branch (see Fig. 9), namely a factor of two smaller range than shown by the CCI index.
Our working hypothesis in deriving HCI for the galaxies in our sample is that the conversion factor used in Eq. 2 does not change between the nuclear and CND scales. Moreover, if anything, this conversion factor would probably have to be reduced on the nuclear (r < 50 pc) scales where gas is expected to be hotter in the highest luminosity AGN sources. In this scenario we would be underestimating the differences between the concentration of hot molecular gas measured for AGN build-up and AGN feedback branch galaxies (see also a similar discussion regarding the trend of CCI as a function of LX in Sect. 5.2).
Following the same approach of Sect. 5.1 we used the MARS algorithm to find the position of the breaking point and the slopes of the two AGN branches. The result of the fit is displayed in the right panel of Fig. 9. From this simulation we find a turnover for the distribution at log10LX = 42.04 ± 0.27 erg s−1 with a fit value of HCI = 0.51 ± 0.04, which similarly splits the sample into the two branches identified above based on the trend shown by the median values of HCI as a function of LX. The power-law index found for the AGN build-up branch, N = +0.00 ± 0.05, is compatible with a flat trend for LX ≤ 1042.04 erg s−1. The power-law index found for the AGN feedback branch, N = −0.29 ± 0.11, shows only a very marginal statistical evidence (≃2.6σ) of a decreasing trend of the concentration of hot molecular gas for galaxies lying beyond the turnover X-ray luminosity. This confirms the visual impression that the decrease in molecular gas concentration identified in galaxies belonging to the AGN feedback branch most severely affects the cold phase of the gas probed by CO.
6.2. Radial distributions
Figure 10 shows the average normalized radial distributions (Inorm(r)) of hot molecular gas derived out to r = 210 pc from the 2.1 μm line emission for the 5 LX bins defined in Sect. 6.1. The profiles show differences that reflect the trends displayed by the HCI values as function of LX in Fig. 9. Profiles appear to be nearly flat or with a moderate degree of central concentration for the higher X-ray luminosities characteristic of AGN feedback branch galaxies, grouped in LX bins 1 and 2. Galaxies in the peak phase of the AGN build-up branch, grouped in LX bins 3, 4, and 5, tend to show higher concentrations of hot molecular gas.
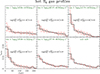 |
Fig. 10. Same as Fig. 3 but showing the average normalized radial distributions (Inorm(r)) of “hot” molecular gas derived out to r = 210 pc from the 2.1 μm line emission for the five LX bins defined in Sect. 6.1 and for the nonAGN galaxy subset. Symbols for histograms and error bars for the median and the median absolute deviation values for the “hot” molecular gas profiles are defined and shown as in Fig. 3. The median value of the concentration index of “hot” molecular gas and its associated uncertainty are shown in each panel. The common scales adopted for all bins in the x and y axes are shown in the lower left panel. |
Figure 11 shows that these differences are marginally statistically significant when we compare the profiles of the highest luminosity AGN feedback branch targets (bin 1) with those of the highest luminosity AGN build-up phase targets (bin 3). However, the differences in the profiles between galaxies belonging to the two extreme LX classes are not statistically significant (bins 1 and 5).
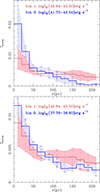 |
Fig. 11. Comparison of radial profiles of “hot” molecular gas. Upper panel: Comparison between the average radial distributions of “hot” molecular gas for bins 1 and 3, which correspond to the subsets of galaxies showing the lowest and the highest concentration indices of ‘hot’ molecular gas in the sample respectively, as defined in Sect. 6.1. Lower panel: Same as the upper panel but comparing the average radial distributions of “hot” molecular gas for bins 1 and 5 defined in Sect.6.1, which represent the highest and the lowest ends of the LX distribution in our sample respectively. |
Figures 12 and 13 show the 2-dimensional and normalized radial distributions of the hot molecular gas in the inner r ≤ 200 pc central regions of six galaxies representative of the different AGN and nonAGN bin categories. These images help visualize the differences in the morphology of the distribution of the hot gas as a function of LX. The latter is characterized by a low nuclear-scale (r ≤ 50 pc) concentration of hot molecular gas in the AGN feedback branch targets, belonging to bins 1, 2 (NGC 7582 and NGC 1068, respectively). This is in contrast with the more concentrated nuclear-scale distribution of the gas in the targets in the peak phase of the AGN build-up branch of bins 3, 4, and 5 (NGC6300, NGC 613, and NGC1672, respectively). The nonAGN target NGC7727 shows a concentration similar to that of NGC 1672.
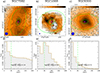 |
Fig. 12. Maps and radial profiles. Upper panels: Velocity-integrated intensity maps derived from the 2.1 μm line for three representative targets selected from the galaxies of LX bin 1 (NGC 7582; (a)), bin 2 (NGC 1068; (b)), and bin 3 (NGC 6300; (c)), as defined in Sect. 6.1. Contour levels have a logarithmic spacing from 2.5σ to 90% of the peak 2.1 μm intensity inside the displayed field of view, which corresponds to 400 pc × 400 pc. Lower panels: Normalized radial distributions of ‘hot’ molecular gas derived out to r = 210 pc for the galaxies shown in the upper panels. The estimated ‘hot’ molecular gas concentration indices are displayed in panels (d)-to-(f). All symbols as in Fig. 5. |
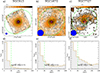 |
Fig. 13. Same as the upper and lower panels of Fig. 12 but showing the maps and radial distributions of three representative targets selected from the galaxies of LX bin 4 (NGC 613; (a) and (d)), bin 5 (NGC 1672; (b) and (e)), and the nonAGN subset (NGC 7727; (c) and (f)), as defined in Sect. 6.1. Symbols as in Fig. 12. |
7. Hot-to-cold molecular gas ratios
Taking advantage of the significant overlap between the CO and NIR samples, which span 42 independent map pairs, we also investigate the changes in the hot-to-cold molecular gas ratio as a function of LX.
The upper panel of Fig. 14 shows how the hot-to-cold molecular gas mass surface density ratios changes between the nuclear and CND scales as a function of LX in the sample. We estimated the ratio from the CO and 2.1 μm line emissions on the nuclear (r ≤ 50 pc) ( /
/ [50 pc]) and CND scales r ≤ 200 pc (
 /
/ [200 pc]). By definition, this ratio is insensitive to any galaxy-to-galaxy variation of conversion factors for the cold and hot molecular gas. The ratios, listed in Table 1 for six LX luminosity bins6 indicate a trend suggestive of higher values of the hot-to-cold mass ratios on nuclear scales in the highest luminosity AGN sources. In particular, AGN below the turnover luminosity identified in Sect. 6.1 (LX ≤ 1042.0 erg s−1) in bins 4, 5, and 6 show median values approximately compatible with unity within the errors, indicating that for these range of luminosities there are no significant changes in the mass ratios between the two spatial scales. In contrast, beyond the turnover luminosity, AGN in bins 1, 2, and 3 show indications of a ≃1.5 − 2 increase in the hot-to-cold molecular gas ratio on the nuclear scales compared to CND scales. The increase in the hot-cold-ratio reflects the factor of ≃1.5 − 2 corresponding to the ratio 10(|Δ[CCI]| − |Δ[HCI]|), where Δ[CCI] and Δ[HCI] represent the range of variation of CCI and HCI measured along the AGN feedback branch.
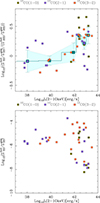 |
Fig. 14. Hot-to-cold gas mass ratios. Upper panel: Change of the ratio (in log units) of the hot-to-cold molecular gas mass surface density ratios with LX estimated from the CO and 2.1 μm line emissions at the two spatial scales analyzed in this work: r ≤ 50 pc ( |


However, the suggested twofold increase of the nuclear-scale fraction of hot molecular gas mass would not compensate for the nuclear-scale deficit of cold molecular gas mass identified in the highest-luminosity AGN sources of our sample. As illustrated in the lower panel of Fig. 14, the hot-to-cold molecular gas mass fraction measured on nuclear scales is ≤10−4 in all galaxies of the sample.
8. An evolutionary scenario for the cycle of molecular gas at CND scales
The results obtained from the analysis of how the concentration and normalized radial distribution of cold and hot molecular gas change as function of X-ray luminosity in our sample confirm on a more robust statistical basis the previous findings of García-Burillo et al. (2021). García-Burillo et al. (2021) suggested the existence of two distinct categories of Local Universe spiral galaxies classified as AGN grouping them into two branches connected by an evolutionary sequence: the AGN build-up branch and the AGN feedback branch.
8.1. AGN build-up phase
Local Universe disk galaxies are expected to spend most of their lives either in a nonactive phase or transitioning from a quiescent phase to a nascent AGN phase, moving along the AGN build-up branch. A low-luminosity AGN (log LX < 41.5–42 erg s−1) during its build-up phase could start its activity cycle with a massive dusty molecular torus, which could have assembled following a fueling episode driven by the gas instabilities created by a stellar bar. In particular, the presence of a trailing nuclear spiral structure has been identified inside the ILR of some of the barred galaxies observed with ALMA at the highest spatial resolution (≃4 − 9 pc) in the sample: NGC 613, NGC 1566, NGC 1672, and NGC 1808 (Combes et al. 2014, 2019; Audibert et al. 2019, 2021). These galaxies lie at the peak phase of the AGN build-up branch, which is characterized by a high nuclear-scale concentration of molecular gas (CCI ≥ [+0.5,+0.8]). The existence of a contrasting two-arm CO trailing nuclear spiral structure in which the gas loses angular momentum has been interpreted as a smoking gun evidence of ongoing AGN feeding. Bars that are able to pile up gas close to the sphere of influence of the supermassive black hole, where the precessing frequency Ω − κ/2 decreases with radius, can develop trailing nuclear spirals and fuel the AGN (Wada 1994; Buta & Combes 1996; Peeples & Martini 2006; Combes et al. 2014; Combes 2021b,c). In this scenario, the gas can build up the gas reservoir of the molecular torus and its surroundings, which naturally explains the high nuclear-scale concentration index measured in these objects.
Figure 15 shows how the fraction of large-scale stellar bars, identified in the Hubble SB or SAB types, is related to the CCI values measured in the galaxies of our sample. Within the limits of our admittedly small statistics (eight galaxies for each of the eight LX bins of AGN galaxies and 19 nonAGN galaxies; see Table 1), Fig. 15 shows a nearly monotonic increase in both the fraction of large-scale bars and the CCI values along the AGN build-up branch. The fraction of large-scale bars goes from ≃0.5 − 0.6 for the nonAGN galaxies in our sample up to ≃0.9 at luminosities just below the turnover. For galaxies belonging to the AGN feedback branch, the total fraction of large-scale bars decreases down to ≃0.6–0.7, namely similar to the overall bar fraction derived from optical studies in spiral galaxies, regardless of their AGN or nonAGN classification (de Vaucouleurs et al. 1991; Hunt & Malkan 1999). Taken at face value, this result might suggest that while bar-driven secular evolutionary processes regulate the CND-scale distribution of molecular gas along the AGN build-up branch, the role of large-scale bars, while still present to a significant extent, does not appear to outweigh processes specifically related to AGN feedback in redistributing molecular gas beyond a certain value of LX. However, the fact that large-scale bars are seen to be present in all galaxies in the sample at levels ≥2/3, suggests that the link between CCI and the fraction of large-scale bars is weak.
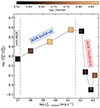 |
Fig. 15. Median values of the concentration indices for the seven LX bins defined in Sect. 5.1 and for the nonAGN galaxies. Symbols are color-coded (in linear scale) to reflect the average fraction of large-scale bars present in the galaxies belonging to each luminosity bin. The ranges of LX corresponding to the AGN build-up and AGN feedback branches are indicated. |
Primary large-scale bars have timescales of ≃1 Gyr and can eventually develop an ILR, and under certain circumstances a decoupled nuclear bar instability, a two-arm trailing spiral structure or a lopsided (m = 1) mode can develop within this resonance. These smaller scale instabilities, with shorter associated timescales ≃10 − 100 Myr, can help to drain the angular momentum of the gas and fuel the AGN. Numerical simulations predict that large-scale bars can become rounder and eventually get destroyed after the cumulative effect of several massive gas inflow episodes (e.g., Combes 2000; Bournaud & Combes 2002; Hopkins & Quataert 2010). The timescales associated with the destruction of primary bars are ≃10–100 longer than the corresponding timescales associated with the transit along the AGN feedback branch or with the black hole starvation phase, as estimated in Sect. 8.3. Therefore, given this significant timescale mismatch, CCI and the fraction of large-scale bars are not expected to be strongly linked. However, the existence of a potentially tighter correlation between the CCI trends and the presence of nuclear bars or nuclear spirals should be further investigated with a larger sample.
8.2. AGN feedback phase
During the peak phase of the activity cycle the action of radiation pressure and/or jets could sweep away a significant fraction of the gas and dust ‘locally’ in the torus. These local (dusty) outflows could help regulate the feeding of the supermassive black hole and the growth of the molecular torus.
Figure 16 shows the nuclear hydrogen column densities measured towards the AGN as a function of the Eddington ratio for the galaxies in our sample. Using semi-analytical models Venanzi et al. (2020) found that the launch of polar IR-driven dusty outflows would be more favorable under certain conditions, which can be ascribed to a well defined region in the  -λEdd parameter space of Fig. 16. We also plot in Fig. 16 the predicted location of the blowout region described by Fabian et al. (2008), where the gas and dust are expected to be cleared by radiation-driven winds on nuclear scales. In particular, dusty winds can be launched from the torus when the acceleration due to the AGN radiation pressure and the acceleration due to the gravitational force from the central black hole (BH) are balanced (Venanzi et al. 2020). For a fixed value of λEdd column densities below the value associated with the balance between the expected pressures acting on dust are conducive to the launch of dusty outflows. This mechanism is expected to be effective above column densities
  cm−2 which corresponds to an opacity equal to unity in the near-IR. Alonso-Herrero et al. (2021) analyzed the position of a sample of 13 nearby AGN including the ten galaxies of the GATOS core sample (García-Burillo et al. 2021), Circinus, NGC1365, and NGC 1068, and found that six galaxies have Eddington ratios and nuclear column densities favorable to the launching of IR-driven polar dusty winds. The extended MIR polar components detected by Alonso-Herrero et al. (2021) in these candidate galaxies seemed to confirm the first predictions of Venanzi et al. (2020). Furthermore, the analysis of the nuclear IR SED of a sample of Seyfert galaxies published by García-Bernete et al. (2022), found that galaxies close to the region favorable for the launch of dusty winds are best fit by torus models that include a wind component, while galaxies far from the IR-driven dusty wind region are best fit by classical torus models.
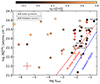 |
Fig. 16. Diagram showing the hydrogen column densities measured towards the AGN ( |

Figure 16 shows a clear dichotomy in the location of the galaxies belonging to the AGN build-up and feedback branches of our enlarged sample in the  -λEdd parameter space, where
  is the line-of-sight hydrogen column density derived from CO toward the AGN. In particular, galaxies in the AGN feedback branch with the lowest nuclear-scale molecular gas concentrations tend to be close to the region where IR-driven polar dusty outflows would be more favorably launched. In contrast, the galaxies of the AGN build-up branch with the highest nuclear scale molecular gas concentrations are located far from the region conducive to the launch of dusty outflows. Although the spatial and temporal scales associated with the launch of local dusty outflows in the torus (by the action of IR radiation pressure) and with the propagation of nuclear outflows (by the action AGN outflows and/or radio jets) are different, the distribution of the galaxies of our sample in Fig. 16 suggests that there is a causal connection between the two outflow phenomena.
The vast majority of the sources belonging to the AGN feedback branch in our sample have ionized outflows and some have radio jets. At a later stage the propagation of AGN outflows and/or radio jets, which can be strongly coupled with the ISM of the host disk, can launch molecular outflows, entrain and in some cases clear a large fraction of the gas on larger spatial scales (∼tens to hundreds of pc) as the nuclear activity cycle reaches its maximum. However, other factors beside the AGN luminosity can play a critical role in shaping the distribution, kinematics and excitation of molecular gas: the presence of an AGN wind and/or radio jet does not necessarily lead to a nuclear-scale molecular gas deficit in the disk of the host galaxy, since the latter requires that the coupling between the wind and/or jet and the ISM in the disk is strong enough to affect the redistribution of molecular gas. The impact of geometry on the coupling efficiency of AGN winds and the ISM has been shown by numerical simulations (Gabor & Bournaud 2014; Torrey et al. 2020; Mercedes-Feliz et al. 2023). For a fixed AGN luminosity, we therefore expect the distribution of concentration indices to show a scatter reflecting the intrinsic variance of the geometrical factors we may encounter (see also discussion in Ramos Almeida et al. 2022).
The cases of NGC 613 and NGC 1068 are a good illustration of the importance of geometry. Audibert et al. (2019) imaged a fast (vout ≥ 300 kms−1) molecular outflow of ≃50 pc in size in the central region of NGC 613, detected in several molecular species (CO, HCN, HCO+, and CS). Audibert et al. (2019) favored a scenario where the outflow is triggered by the 200 pc radio jet imaged by the VLA (Hummel & Jorsater 1992). Although the radio jet has triggered a small molecular outflow at its base, it has left the nuclear-scale in-plane distribution of the molecular gas virtually intact: NGC 613 exhibits high values of the molecular gas concentration indices. However, the low coupling efficiency of the jet with the ISM can be explained in a scenario where the jet is at a large angle relative to the disk of NGC 613, in stark contrast to the strong coupling efficiency of the radio jet and AGN wind of NGC 1068, which are at a small angle relative to the galaxy disk.
8.3. Estimate of timescales
The sharp decline of the cold molecular gas concentration indices beyond the turnover luminosity (LX ≃ 1041.5 erg s−1) shown by the distribution of CCI values of Fig. 2, suggests that the transition from the initial stage to the late-phase of the AGN feedback branch may occur on relatively short timescales. We can make a rough estimate of these typical transition timescales for four of the galaxies belonging to the late-phase AGN feedback branch, which are characterized firstly, by showing very low (negative) CCI values and, secondly, which are known to harbor nuclear molecular outflows with Ṁout ≃ 1 to a few tens of M⊙ yr−1 in the inner r < 50 pc region (García-Burillo et al. 2014, 2019, 2021; Alonso-Herrero et al. 2023): NGC 1068 (CCI = −0.25), NGC 4388 (CCI = −0.17), NGC 7172 (CCI = −0.16), and NGC 7582 (CCI = −0.16). Under the hypothesis that these Seyferts had initial CCI values typical of that of the late-phase AGN build-up branch sources, such as NGC 613 (CCI = +0.82), the transit timescale (ttransit) can be estimated as:
![Mathematical equation: $$ \begin{aligned} t_{\rm transit}\simeq \pi \times r^{2}\times \Delta [\mathrm{concentration}] \times \Sigma ^\mathrm{gas}_{\rm 200}\times \dot{M}_{\rm out}^{-1}. \end{aligned} $$](/articles/aa/full_html/2024/09/aa50268-24/aa50268-24-eq35.gif) (5)
(5)
In Eq. (5), Δ[concentration] = 10CCI(initial) − 10CCI(final) represents the concentration change for a particular galaxy, r = 50 pc, and we assume that  and
and  do not undergo a significant change during the transition. We derive for these sources: ttransit ≃ 1-to a few 10 Myr, an estimate that confirms our expectation that the transition timescales are likely short.
AGN fueling is expected to be hindered on intermediate spatial scales during the late phase of the activity cycle, represented by the sources of our sample that show the most extreme nuclear-scale deficits of the AGN feedback branch and also harbour molecular outflows in the inner r < 50 pc region. The gas reservoir in the torus of these AGN would be therefore eventually exhausted. An exhaustion timescale (texhaustion) can be approximately estimated for the molecular tori of NGC 1068, NGC 4388, NGC 7172, and NGC 7582, using the masses of the tori (Mtorus) derived by García-Burillo et al. (2021) and Alonso-Herrero et al. (2023) for these sources, assuming a canonical accretion efficiency ϵ ≃ 0.1, and a bolometric correction kbol ≃ 10 in the expression:
 (6)
(6)
We derive from Eq. (6) for these sources: texhaustion ≃ 1-to a few 10 Myr. There is both observational and theoretical evidence that AGN can have much shorter flickering timescales ranging from a few years up to ≃105 yr (Schawinski et al. 2015; King & Nixon 2015). With the values of texhaustion estimated above, AGN activity could still continue in these Seyfert galaxies for a time span ≃10 − 100 longer than the expected flickering timescale.
Once the gas reservoir in the torus is exhausted, a “BH starvation” or “build-down” phase should follow. During this phase we might first expect that the CND-scale distribution of molecular gas does not change significantly (namely the CCI index remains approximately constant) as AGN feedback is progressively turned off, and second that the AGN luminosity decreases on short timescales. Thus, in the LX − CCI parameter space, galaxies would move along quasi-horizontal trajectories during the BH starvation phase as they leave the feedback branch. The described evolutionary cycle could be restarted after the completion of another AGN fueling phase leading to a secular increase in the CCI index and LX along the AGN build-up phase. The fact that we see only one galaxy (ESO-093-G003, classified as nonAGN) in our sample with a low cold molecular gas concentration (negative CCI; ∼–0.02 in ESO-093-G003) and a very low AGN luminosity (LX ≪ 1041.5 erg s−1) suggests that the BH starvation phase should be very short. Alternatively, the striking lack of targets in the lower left region of the LX − CCI diagram could be explained if galaxies did not necessarily leave the AGN build-up branch during the build-down phase; in this scenario, half of the targets in the AGN build-up branch would actually be in the build-down evolutionary phase.
A proper dating of the transition timescales relevant to the parameter space of Fig. 2 would require self-consistent numerical simulations of the gas cycle capable of following the evolution of the CND-scale distribution of cold molecular gas in realistic AGN environments similar to those characterizing the Seyfert galaxies in our sample. These simulations could be used to verify/falsify the validity of the different evolutionary scenarios.
8.4. Hot molecular gas cycle
That the hot molecular gas follows a qualitatively similar trend to that seen in the central concentration index of cold molecular gas can be explained in a scenario in which the hot molecular gas is entrained in the outflow as is suggested to be the case in NGC 5728 (Shimizu et al. 2019). In some galaxies, rather than AGN feedback removing all molecular gas within the central region, the cold molecular gas ‘hole” has been observed to be filled with hot molecular and/or highly ionized gas (e.g., Rosario et al. 2019; Feruglio et al. 2020; Davies et al. 2024). However, as noted in Sect. 7, the hot molecular gas within this CO “hole” does not account for the deficit of gas and thus to some extent the AGN feedback has successfully cleared a significant portion of the gas. Shimizu et al. (2019) found in NGC 5728 that within the cold molecular gas “holes” in the outflow region there is a highly stratified structure of highly ionized gas surrounded by an outer layer of hot molecular gas. This stratified outflow is interpreted as an outflow which has successfully cleared the central region of molecular gas but is oriented such that this outflow disrupts the circumnuclear disk. The hot molecular gas within the disk rotates into the outflow region and becomes entrained in it along the outer extent of the outflow. This emphasizes the importance of the geometry of the disk and outflow orientations in that a coupling of the outflow with the ISM is necessary to effectively redistribute molecular gas. In such a case both the cold and hot molecular gas will be cleared, although to varying degrees depending on the disk and outflow geometries. Whether the nuclear-scale deficit shared by the “cold” and “hot” phases of H2 can be partly compensated by the “warm” phase (Tk ≃ a few 100 K) of the molecular gas remains to be confirmed by future observations of the sample with facilities such as the James Webb Space Telescope.
9. Summary and conclusions
We studied the distribution of cold molecular gas on CND scales (r ≤ 200 pc) in a sample of nearby (DL = 7 − 45 Mpc) disk galaxies – including 45 AGN and 19 nonAGN – for which high-resolution multiline CO observations have been obtained at millimeter wavelengths by the ALMA and/or PdBI arrays. We studied these galaxies to decipher whether or not the concentration and normalized radial distribution of cold molecular gas change as function of X-ray luminosity in order to analyze the imprint potentially left by AGN feedback. We also incorporated NIR integral field spectroscopy data obtained for the H2 1-0 S(1) line available for a subset of 35 targets of the CO-based sample used in this work. These data allowed us to study the concentration and normalized radial distribution of the hot molecular gas phase as well as the hot-to-cold-molecular gas mass ratio as a function of the X-ray luminosity in this subsample. The main results of this paper are summarized as follows:
-
The cold molecular gas concentration, defined by the ratio
 ), shows a statistically significant turnover at a luminosity breakpoint of LX ≃ 1041.5 erg s−1, which divides the sample into two branches in the CCI–LX parameter space. AGN and nonAGN below the luminosity breakpoint and located along the “AGN build-up branch” have CCI values that increase with LX from ≃ + 0.27 ± 0.13 to ≃ + 0.58 ± 0.23. Higher luminosity AGN beyond the luminosity breakpoint and located along the “AGN feedback branch” show a sharp decrease in the concentration of molecular gas from ≃ + 0.56 ± 0.12 down to ≃ − 0.05 ± 0.07. The cold molecular gas concentration spans a factor ≃4–5 between the galaxies lying at the high end of the AGN build-up branch and the galaxies showing the most extreme nuclear-scale molecular gas deficits in the AGN feedback branch. These trends confirm – with a three times larger sample – previous evidence found in the context of the GATOS survey by García-Burillo et al. (2021).
 -
The normalized radial profiles (Inorm(r)) of the cold molecular gas in the galaxies of our sample reflect the trends shown by the CCI values as a function of LX. The profiles appear as flat or inverted in the AGN feedback branch galaxies. In contrast, galaxies in the peak phase of the AGN build-up branch show highly concentrated molecular gas distributions. In addition, lower luminosity AGN galaxies and nonAGN targets show comparatively less concentrated molecular gas radial profiles.
-
We performed an independent nonparametric analysis of the CND-scale distribution of the cold molecular gas in our sample by deriving the Gini coefficients associated with their radial profiles. The radial Gini coefficients are shown to be strongly correlated with the molecular gas concentration. On the other hand, the radial Gini coefficients are shown to be strongly anticorrelated with the flux-weighted mean radius of the distribution of the gas. The distribution of the radial Gini coefficients with LX shows a similar turnover at a luminosity breakpoint of LX ≃ 1041.5 − 42.0 erg s−1.
-
The hot molecular gas concentration, defined by the ratio
 ), shows a qualitatively similar but less pronounced turnover compared to the trend shown by the CCI index. We identify a luminosity breakpoint at LX ≃ 1042.0 erg s−1, which divides the sample into the AGN build-up and feedback branches. The concentration of hot molecular gas in the sample spans a factor ≃2.9 range between the galaxies lying in the peak phase of the AGN build-up branch and the most extreme AGN feedback branch targets. The normalized radial profiles (Inorm(r)) of the hot molecular gas reflect the HCI–LX trends.
 -
We find higher values of the hot-to-cold molecular gas mass ratios on nuclear scales in the highest luminosity AGN sources of the AGN feedback branch. In particular, beyond the turnover luminosity, AGN show indications of a twofold increase in the hot-to-cold molecular gas ratio on the nuclear scales compared to CND scales. However, this twofold increase does not compensate for the nuclear-scale deficit of cold molecular gas mass identified in the highest luminosity AGN.
-
We present a tentative scenario describing an evolutionary link connecting the galaxies analyzed in this work. While most of galaxies are expected to spend most of their lives transitioning from a quiescent phase to a nascent AGN phase, moving along the AGN build-up branch, the sharp decline of the cold molecular gas concentration indices beyond the turnover luminosity (LX ≃ 1041.5 erg s−1) suggests that the transition from the initial stage to the late-phase of the AGN feedback branch occurs on short timescales (≃1 Myr to a few tens of Myr). At the end of the AGN feedback phase, the gas reservoir in the torus would be eventually exhausted. Similarly, the timescales associated with the ensuing BH starvation phase are estimated to be very short.
The evolutionary scenario described in this paper would outline the cycle of molecular gas at CND scales in spiral disk galaxies undergoing an AGN episode. However, the secular evolution processes in active galaxies classified as ETGs (E and S0) are expected to be very different from those governing the redistribution of molecular gas in later-type spiral galaxies, which are in all likelihood related to the action of stellar bars or spiral density waves, that are absent in E galaxies in particular. Furthermore, the CND-scale distribution of molecular gas in ETGs may rather reflect the evolutionary stage of the gas settling process, which in E and S0 objects is often associated with an external accretion event during an interaction (see also discussion in Davies et al. 2014, 2017). Therefore, we do not expect to find a direct evolutionary link that could connect bulge-dominated ETGs to disk-dominated spiral galaxies in the scenario described in this paper. Taken together, this could explain the fact that, while the spiral galaxies in Elford et al. (2024) with X-ray luminosities higher than 1042 erg s−1 closely follow the relation found by García-Burillo et al. (2021) and this work, the fraction (≃60%) of the low-luminosity ETGs analyzed by Elford et al. (2024) would deviate from the general trend followed by spiral galaxies in the AGN build-up branch.
During the low-luminosity and low-Eddington-ratio phases, the kinetic feedback mode associated with radio jets can compete with, or even overtake, the radiative feedback mode that dominates at higher luminosities. Jets can sweep away interstellar gas provided that the coupling with the ISM in the disk of the host is sufficient. In some cases, the jet ejected from the central engine can impact a significant fraction of the plane of the galaxy due to the random orientation of the accretion disk and the tori, which are generally decoupled from the orientation of the large-scale disk (e.g., Morganti et al. 2013, 2015; García-Burillo et al. 2014; Dasyra et al. 2015; Alonso-Herrero et al. 2018; Anglés-Alcázar et al. 2021; García-Bernete et al. 2021; Ramos Almeida et al. 2022; Ruffa et al. 2022; Rao et al. 2023; Audibert et al. 2023). The potential role of jets in AGN feedback for different radio power regimes has been demonstrated by numerical simulations (e.g., Wagner & Bicknell 2011; Wagner et al. 2012; Mukherjee et al. 2018a,b; Meenakshi et al. 2022). Unfortunately, the influence that radio jets can have on the distribution of molecular gas cannot be studied to the same extent as the influence of LX in most of the galaxies in our sample, because high-spatial-resolution and high-sensitivity radio images are only available for a small fraction of our targets.
With the exception of one elliptical galaxy classified as nonAGN, NGC 5845, our sample only includes disk galaxies; the median value of the Hubble stage T parameter for our sample is 2.2, which corresponds to a Sab spiral galaxy type; see Table A.1.
We do not expect to find a direct evolutionary link that could connect ETGs to spiral (disk) galaxies, as argued in Sect. 9, and therefore we have only included in our combined sample the WISDOM sources that are not classified as ETGs.
We assume common values of Rij and αCO for the two spatial scales used in this work: R31 = 2.9 and R21 = 2.5 measured by Viti et al. (2014) in NGC 1068, and a Milky-Way value of αCO = 2 × 10²⁰ mol cm−2 (K km s−1)−1 (Bolatto et al. 2013).
The binning used along the LX axis is designed to have a similar number of eight or nine independent CO data sets per luminosity bin.
The binning used along the LX axis is chosen to have a similar number of six or eight independent NIR data sets per luminosity bin.
The binning used along the LX axis is chosen to have seven independent data sets per luminosity bin.
Acknowledgments
We thank the referee for his thorough and constructive report. This paper makes use of the following ALMA data, which have been processed as part of 1) the GATOS survey: ADS/JAO.ALMA #2016.1.00232.S, #2016.1.00254.S., #2017.1.00082.S, #2018.1.00113.S, and # 2019.1.00618.S 2)the NUGA survey: #2015.1.00404.S and #2016.1.00296.S 3) the LLAMA survey: #2019.1.01742.S 4)the WISDOM survey: #2017.1.00517.S, #2018.1.00572.S, and #2019.1.00363.S 4)the survey PI-ed by Claudio Ricci #2019.1.01230.S and #2021.1.00812.S 5) the PHANGS-ALMA CO(2-1) survey: ADS/JAO.ALMA#2012.1.00650.S, ADS/JAO.ALMA#2 013.1.00803.S, ADS/JAO.ALMA#2013.1.01161.S, ADS/ JAO.ALMA#2015.1.00121.S, ADS/JAO.ALMA#2015.1.00 782.S, ADS/JAO.ALMA#2015.1.00925.S, ADS/JAO. ALMA#2015.1.00956.S, ADS/JAO.ALMA#2016.1. 00386.S, ADS/JAO.ALMA#2017.1.00392.S, ADS/JAO. ALMA#2017.1.00766.S, ADS/JAO.ALMA#2017.1.00886. L, ADS/JAO.ALMA#2018.1.00484.S, ADS/JAO. ALMA#2018.1.01321.S, ADS/JAO.ALMA#2018.1.01 651.S, ADS/JAO.ALMA#2018.A.00062.S, ADS/JAO. ALMA#2019.1.01235.S, ADS/JAO.ALMA#2019.2.00129.S ALMA is a partnership of ESO (representing its member states), NSF (USA), and NINS (Japan), together with NRC (Canada) and NSC and ASIAA (Taiwan), in cooperation with the Republic of Chile. The Joint ALMA Observatory is operated by ESO, AUI/NRAO, and NAOJ. The National Radio Astronomy Observatory is a facility of the National Science Foundation operated under cooperative agreement by Associated Universities, Inc. This work is also based on observations carried out with the IRAM PdBI Interferometer in the context of the NUGA (PIs: S. García-Burillo & and F. Combes) and PAWS (PI: E. Schinnerer) projects. IRAM is supported by INSU/CNRS (France), MPG (Germany) and IGN (Spain). We acknowledge the IRAM staff from the Plateau de Bure and from Grenoble for carrying out the observations and help provided during the data reduction. We acknowledge the use of the following data reduction and software packages: CASA (McMullin et al. 2007), astropy (Astropy Collaboration 2013, 2018), and Rstudio package (R Core Team 2021) SGB, AU, and MQ acknowledge support from the Spanish grant PID2022-138560NB-I00, funded by MCIN/AEI/10.13039/501100011033/FEDER, EU. MPS acknowledges support from grant RYC2021-033094-I funded by MICIU/AEI/10.13039/501100011033 and the European Union NextGenerationEU/PRTR. IGB acknowledges support from STFC through grants ST/S000488/1 and ST/W000903/1. MTL acknowledges grant support from the Space Telescope Science Institute (ID: JWST-GO-01670.007-A). MS acknowledges support by the Ministry of Science, Technological Development and Innovation of the Republic of Serbia (MSTDIRS) through contract no. 451-03-66/2024-03/200002 with the Astronomical Observatory (Belgrade). AAH acknowledges support from grant PID2021-124665NB-I00 funded by MCIN/AEI/10.13039/501100011033 and by ERDF A way of making Europe. EB acknowledges the María Zambrano program of the Spanish Ministerio de Universidades funded by the Next Generation European Union and is also partly supported by grant RTI2018-096188-B-I00 funded by the Spanish Ministry of Science and Innovation/State Agency of Research MCIN/AEI/10.13039/501100011033. CRA acknowledges support from project “Tracking active galactic nuclei feedback from parsec to kiloparsec scales”, with reference PID2022-141105NB-I00. DJR acknowledges support from the UK STFC through grant ST/X001105/1. CR acknowledges support from Fondecyt Regular grant 1230345 and ANID BASAL project FB210003. OGM acknowledges financial support from UNAM through the project PAPIIT IN109123 and CONAHCyT through the project “Ciencia de Frontera 2023” CF-2023-G-100. 013.1.00803.S, ADS/JAO.ALMA#2013.1.01161.S, ADS/ JAO.ALMA#2015.1.00121.S, ADS/JAO.ALMA#2015.1.00 782.S, ADS/JAO.ALMA#2015.1.00925.S, ADS/JAO. ALMA#2015.1.00956.S, ADS/JAO.ALMA#2016.1. 00386.S, ADS/JAO.ALMA#2017.1.00392.S, ADS/JAO. ALMA#2017.1.00766.S, ADS/JAO.ALMA#2017.1.00886. L, ADS/JAO.ALMA#2018.1.00484.S, ADS/JAO. ALMA#2018.1.01321.S, ADS/JAO.ALMA#2018.1.01 651.S, ADS/JAO.ALMA#2018.A.00062.S, ADS/JAO. ALMA#2019.1.01235.S, ADS/JAO.ALMA#2019.2.00129.S ALMA is a partnership of ESO (representing its member states), NSF (USA), and NINS (Japan), together with NRC (Canada) and NSC and ASIAA (Taiwan), in cooperation with the Republic of Chile. The Joint ALMA Observatory is operated by ESO, AUI/NRAO, and NAOJ. The National Radio Astronomy Observatory is a facility of the National Science Foundation operated under cooperative agreement by Associated Universities, Inc. This work is also based on observations carried out with the IRAM PdBI Interferometer in the context of the NUGA (PIs: S. García-Burillo & and F. Combes) and PAWS (PI: E. Schinnerer) projects. IRAM is supported by INSU/CNRS (France), MPG (Germany) and IGN (Spain). We acknowledge the IRAM staff from the Plateau de Bure and from Grenoble for carrying out the observations and help provided during the data reduction. We acknowledge the use of the following data reduction and software packages: CASA (McMullin et al. 2007), astropy (Astropy Collaboration 2013, 2018), and Rstudio package (R Core Team 2021) SGB, AU, and MQ acknowledge support from the Spanish grant PID2022-138560NB-I00, funded by MCIN/AEI/10.13039/501100011033/FEDER, EU. MPS acknowledges support from grant RYC2021-033094-I funded by MICIU/AEI/10.13039/501100011033 and the European Union NextGenerationEU/PRTR. IGB acknowledges support from STFC through grants ST/S000488/1 and ST/W000903/1. MTL acknowledges grant support from the Space Telescope Science Institute (ID: JWST-GO-01670.007-A). MS acknowledges support by the Ministry of Science, Technological Development and Innovation of the Republic of Serbia (MSTDIRS) through contract no. 451-03-66/2024-03/200002 with the Astronomical Observatory (Belgrade). AAH acknowledges support from grant PID2021-124665NB-I00 funded by MCIN/AEI/10.13039/501100011033 and by ERDF A way of making Europe. EB acknowledges the María Zambrano program of the Spanish Ministerio de Universidades funded by the Next Generation European Union and is also partly supported by grant RTI2018-096188-B-I00 funded by the Spanish Ministry of Science and Innovation/State Agency of Research MCIN/AEI/10.13039/501100011033. CRA acknowledges support from project “Tracking active galactic nuclei feedback from parsec to kiloparsec scales”, with reference PID2022-141105NB-I00. DJR acknowledges support from the UK STFC through grant ST/X001105/1. CR acknowledges support from Fondecyt Regular grant 1230345 and ANID BASAL project FB210003. OGM acknowledges financial support from UNAM through the project PAPIIT IN109123 and CONAHCyT through the project “Ciencia de Frontera 2023” CF-2023-G-100.
References
- Aalto, S., Garcia-Burillo, S., Muller, S., et al. 2012, A&A, 537, A44 [NASA ADS] [CrossRef] [EDP Sciences] [Google Scholar]
- Aalto, S., Muller, S., Costagliola, F., et al. 2017, A&A, 608, A22 [NASA ADS] [CrossRef] [EDP Sciences] [Google Scholar]
- Aalto, S., Muller, S., König, S., et al. 2019, A&A, 627, A147 [NASA ADS] [CrossRef] [EDP Sciences] [Google Scholar]
- Aalto, S., Falstad, N., Muller, S., et al. 2020, A&A, 640, A104 [EDP Sciences] [Google Scholar]
- Abraham, R. G., van den Bergh, S., & Nair, P. 2003, ApJ, 588, 218 [NASA ADS] [CrossRef] [Google Scholar]
- Abuter, R., Schreiber, J., Eisenhauer, F., et al. 2006, New Astron Rev., 50, 398 [NASA ADS] [CrossRef] [Google Scholar]
- Alatalo, K., Blitz, L., Young, L. M., et al. 2011, ApJ, 735, 88 [NASA ADS] [CrossRef] [Google Scholar]
- Alonso-Herrero, A., Pereira-Santaella, M., García-Burillo, S., et al. 2018, ApJ, 859, 144 [Google Scholar]
- Alonso-Herrero, A., García-Burillo, S., Pereira-Santaella, M., et al. 2019, A&A, 628, A65 [NASA ADS] [CrossRef] [EDP Sciences] [Google Scholar]
- Alonso-Herrero, A., Pereira-Santaella, M., Rigopoulou, D., et al. 2020, A&A, 639, A43 [NASA ADS] [CrossRef] [EDP Sciences] [Google Scholar]
- Alonso-Herrero, A., García-Burillo, S., Hönig, S. F., et al. 2021, A&A, 652, A99 [NASA ADS] [CrossRef] [EDP Sciences] [Google Scholar]
- Alonso-Herrero, A., García-Burillo, S., Pereira-Santaella, M., et al. 2023, A&A, 675, A88 [NASA ADS] [CrossRef] [EDP Sciences] [Google Scholar]
- Anglés-Alcázar, D., Davé, R., Faucher-Giguère, C.-A., Özel, F., & Hopkins, P. F. 2017, MNRAS, 464, 2840 [Google Scholar]
- Anglés-Alcázar, D., Quataert, E., Hopkins, P. F., et al. 2021, ApJ, 917, 53 [CrossRef] [Google Scholar]
- Antonucci, R. 1993, ARA&A, 31, 473 [Google Scholar]
- Antonucci, R. R. J., & Miller, J. S. 1985, ApJ, 297, 621 [NASA ADS] [CrossRef] [Google Scholar]
- Astropy Collaboration (Robitaille, T. P., et al.) 2013, A&A, 558, A33 [NASA ADS] [CrossRef] [EDP Sciences] [Google Scholar]
- Astropy Collaboration (Price-Whelan, A. M., et al.) 2018, AJ, 156, 123 [Google Scholar]
- Audibert, A., Combes, F., García-Burillo, S., et al. 2019, A&A, 632, A33 [NASA ADS] [CrossRef] [EDP Sciences] [Google Scholar]
- Audibert, A., Combes, F., García-Burillo, S., et al. 2021, A&A, 656, A60 [NASA ADS] [CrossRef] [EDP Sciences] [Google Scholar]
- Audibert, A., Ramos Almeida, C., García-Burillo, S., et al. 2023, A&A, 671, L12 [NASA ADS] [CrossRef] [EDP Sciences] [Google Scholar]
- Baumgartner, W. H., Tueller, J., Markwardt, C. B., et al. 2013, ApJS, 207, 19 [Google Scholar]
- Bolatto, A. D., Wolfire, M., & Leroy, A. K. 2013, ARA&A, 51, 207 [CrossRef] [Google Scholar]
- Bolatto, A. D., Wong, T., Utomo, D., et al. 2017, ApJ, 846, 159 [Google Scholar]
- Bonnet, H., Abuter, R., Baker, A., et al. 2004, Messenger, 117, 17 [Google Scholar]
- Bournaud, F., & Combes, F. 2002, A&A, 392, 83 [NASA ADS] [CrossRef] [EDP Sciences] [Google Scholar]
- Burtscher, L., Orban de Xivry, G., Davies, R. I., et al. 2015, A&A, 578, A47 [NASA ADS] [CrossRef] [EDP Sciences] [Google Scholar]
- Busch, G., Eckart, A., Valencia-S., M., et al. 2017, A&A, 598, A55 [NASA ADS] [CrossRef] [EDP Sciences] [Google Scholar]
- Buta, R., & Combes, F. 1996, Fund. Cosmic Phys., 17, 95 [Google Scholar]
- Caglar, T., Burtscher, L., Brandl, B., et al. 2020, A&A, 634, A114 [NASA ADS] [CrossRef] [EDP Sciences] [Google Scholar]
- Chan, C.-H., & Krolik, J. H. 2016, ApJ, 825, 67 [NASA ADS] [CrossRef] [Google Scholar]
- Chan, C.-H., & Krolik, J. H. 2017, ApJ, 843, 58 [NASA ADS] [CrossRef] [Google Scholar]
- Combes, F. 2000, ASP Conf. Ser., 197, 15 [NASA ADS] [Google Scholar]
- Combes, F. 2021a, Active Galactic Nuclei: Fueling and Feedback (Bristol: IOP Publishing) [CrossRef] [Google Scholar]
- Combes, F. 2021b, in Nuclear Activity in Galaxies Across Cosmic Time, eds. M. Pović, P. Marziani, J. Masegosa, et al., 356, 177 [NASA ADS] [Google Scholar]
- Combes, F. 2021c, IAU Symp., 359, 312 [NASA ADS] [Google Scholar]
- Combes, F., García-Burillo, S., Casasola, V., et al. 2013, A&A, 558, A124 [NASA ADS] [CrossRef] [EDP Sciences] [Google Scholar]
- Combes, F., García-Burillo, S., Casasola, V., et al. 2014, A&A, 565, A97 [NASA ADS] [CrossRef] [EDP Sciences] [Google Scholar]
- Combes, F., García-Burillo, S., Audibert, A., et al. 2019, A&A, 623, A79 [NASA ADS] [CrossRef] [EDP Sciences] [Google Scholar]
- Dasyra, K. M., Bostrom, A. C., Combes, F., & Vlahakis, N. 2015, ApJ, 815, 34 [Google Scholar]
- Davé, R., Anglés-Alcázar, D., Narayanan, D., et al. 2019, MNRAS, 486, 2827 [Google Scholar]
- Davies, R. I. 2007, MNRAS, 375, 1099 [Google Scholar]
- Davies, R. I., Müller Sánchez, F., Genzel, R., et al. 2007, ApJ, 671, 1388 [Google Scholar]
- Davies, R., Förster Schreiber, N. M., Cresci, G., et al. 2011, ApJ, 741, 69 [NASA ADS] [CrossRef] [Google Scholar]
- Davies, R. I., Maciejewski, W., Hicks, E. K. S., et al. 2014, ApJ, 792, 101 [Google Scholar]
- Davies, R. I., Hicks, E. K. S., Erwin, P., et al. 2017, MNRAS, 466, 4917 [Google Scholar]
- Davis, T. A., Gensior, J., Bureau, M., et al. 2022, MNRAS, 512, 1522 [CrossRef] [Google Scholar]
- Davies, R., Shimizu, T., Pereira-Santaella, M., et al. 2024, A&A, 689, A263 [NASA ADS] [CrossRef] [EDP Sciences] [Google Scholar]
- de Vaucouleurs, G., de Vaucouleurs, A., Corwin, H. G., Jr., et al. 1991, Third Reference Catalogue of Bright Galaxies, 2091 [Google Scholar]
- Domínguez-Fernández, A. J., Alonso-Herrero, A., García-Burillo, S., et al. 2020, A&A, 643, A127 [NASA ADS] [CrossRef] [EDP Sciences] [Google Scholar]
- Eisenhauer, F., Abuter, R., Bickert, K., et al. 2003, SPIE Conf. Ser., 4841, 1548 [Google Scholar]
- Elford, J. S., Davis, T. A., Ruffa, I., et al. 2024, MNRAS, 528, 319 [NASA ADS] [CrossRef] [Google Scholar]
- Elitzur, M., & Shlosman, I. 2006, ApJ, 648, L101 [Google Scholar]
- Ellison, S. L., Wong, T., Sánchez, S. F., et al. 2021, MNRAS, 505, L46 [NASA ADS] [CrossRef] [Google Scholar]
- Ezhikode, S. H., Gandhi, P., Done, C., et al. 2017, MNRAS, 472, 3492 [NASA ADS] [CrossRef] [Google Scholar]
- Fabian, A. C., Vasudevan, R. V., & Gandhi, P. 2008, MNRAS, 385, L43 [NASA ADS] [CrossRef] [Google Scholar]
- Fazeli, N., Busch, G., Eckart, A., et al. 2020a, A&A, 638, A53 [NASA ADS] [CrossRef] [EDP Sciences] [Google Scholar]
- Fazeli, N., Eckart, A., Busch, G., et al. 2020b, A&A, 638, A36 [NASA ADS] [CrossRef] [EDP Sciences] [Google Scholar]
- Feruglio, C., Fabbiano, G., Bischetti, M., et al. 2020, ApJ, 890, 29 [Google Scholar]
- Fiore, F., Feruglio, C., Shankar, F., et al. 2017, A&A, 601, A143 [NASA ADS] [CrossRef] [EDP Sciences] [Google Scholar]
- Fluetsch, A., Maiolino, R., Carniani, S., et al. 2019, MNRAS, 483, 4586 [NASA ADS] [Google Scholar]
- Fluetsch, A., Maiolino, R., Carniani, S., et al. 2021, MNRAS, 505, 5753 [NASA ADS] [CrossRef] [Google Scholar]
- Gabor, J. M., & Bournaud, F. 2014, MNRAS, 441, 1615 [CrossRef] [Google Scholar]
- Gallimore, J. F., & Impellizzeri, C. M. V. 2023, ApJ, 951, 109 [NASA ADS] [CrossRef] [Google Scholar]
- Gallimore, J. F., Elitzur, M., Maiolino, R., et al. 2016, ApJ, 829, L7 [Google Scholar]
- García-Bernete, I., Alonso-Herrero, A., García-Burillo, S., et al. 2021, A&A, 645, A21 [EDP Sciences] [Google Scholar]
- García-Bernete, I., González-Martín, O., Ramos Almeida, C., et al. 2022, A&A, 667, A140 [NASA ADS] [CrossRef] [EDP Sciences] [Google Scholar]
- García-Bernete, I., Pereira-Santaella, M., González-Alfonso, E., et al. 2024, A&A, 682, L5 [NASA ADS] [CrossRef] [EDP Sciences] [Google Scholar]
- García-Burillo, S., & Combes, F. 2012, J. Phys. Conf. Ser., 372, 012050 [CrossRef] [Google Scholar]
- García-Burillo, S., Combes, F., Hunt, L. K., et al. 2003, A&A, 407, 485 [NASA ADS] [CrossRef] [EDP Sciences] [Google Scholar]
- García-Burillo, S., Combes, F., Usero, A., et al. 2014, A&A, 567, A125 [Google Scholar]
- García-Burillo, S., Combes, F., Ramos Almeida, C., et al. 2016, ApJ, 823, L12 [Google Scholar]
- García-Burillo, S., Combes, F., Ramos Almeida, C., et al. 2019, A&A, 632, A61 [Google Scholar]
- García-Burillo, S., Alonso-Herrero, A., Ramos Almeida, C., et al. 2021, A&A, 652, A98 [NASA ADS] [CrossRef] [Google Scholar]
- Genzel, R., Tacconi, L. J., Gracia-Carpio, J., et al. 2010, MNRAS, 407, 2091 [NASA ADS] [CrossRef] [Google Scholar]
- González-Martín, O., Masegosa, J., Márquez, I., Guainazzi, M., & Jiménez-Bailón, E. 2009, A&A, 506, 1107 [NASA ADS] [CrossRef] [EDP Sciences] [Google Scholar]
- González-Martín, O., Masegosa, J., Hernán-Caballero, A., et al. 2017, ApJ, 841, 37 [Google Scholar]
- Harrison, C. M., & Ramos Almeida, C. 2024, Galaxies, 12, 17 [NASA ADS] [CrossRef] [Google Scholar]
- Harrison, C. M., Girdhar, A., & Ward, S. R. 2023, arXiv e-prints [arXiv:2307.03770] [Google Scholar]
- Hickox, R. C., Mullaney, J. R., Alexander, D. M., et al. 2014, ApJ, 782, 9 [NASA ADS] [CrossRef] [Google Scholar]
- Hicks, E. K. S., Davies, R. I., Maciejewski, W., et al. 2013, ApJ, 768, 107 [NASA ADS] [CrossRef] [Google Scholar]
- Hönig, S. F. 2019, ApJ, 884, 171 [Google Scholar]
- Hönig, S. F., & Kishimoto, M. 2017, ApJ, 838, L20 [Google Scholar]
- Hopkins, P. F., & Quataert, E. 2010, MNRAS, 407, 1529 [Google Scholar]
- Hummel, E., & Jorsater, S. 1992, A&A, 261, 85 [NASA ADS] [Google Scholar]
- Hunt, L. K., & Malkan, M. A. 1999, ApJ, 516, 660 [NASA ADS] [CrossRef] [Google Scholar]
- Imanishi, M., Nakanishi, K., Izumi, T., & Wada, K. 2018, ApJ, 853, L25 [NASA ADS] [CrossRef] [Google Scholar]
- Imanishi, M., Nguyen, D. D., Wada, K., et al. 2020, ApJ, 902, 99 [CrossRef] [Google Scholar]
- Impellizzeri, C. M. V., Gallimore, J. F., Baum, S. A., et al. 2019, ApJ, 884, L28 [NASA ADS] [CrossRef] [Google Scholar]
- Izumi, T., Kawakatu, N., & Kohno, K. 2016, ApJ, 827, 81 [NASA ADS] [CrossRef] [Google Scholar]
- Izumi, T., Wada, K., Fukushige, R., Hamamura, S., & Kohno, K. 2018, ApJ, 867, 48 [NASA ADS] [CrossRef] [Google Scholar]
- Izumi, T., Wada, K., Imanishi, M., et al. 2023, Science, 382, 554 [NASA ADS] [CrossRef] [Google Scholar]
- King, A., & Nixon, C. 2015, MNRAS, 453, L46 [NASA ADS] [CrossRef] [Google Scholar]
- Krajnović, D., Cappellari, M., de Zeeuw, P. T., & Copin, Y. 2006, MNRAS, 366, 787 [Google Scholar]
- Krolik, J. H., & Begelman, M. C. 1988, ApJ, 329, 702 [Google Scholar]
- Larkin, J., Barczys, M., Krabbe, A., et al. 2006, New Astron Rev., 50, 362 [NASA ADS] [CrossRef] [Google Scholar]
- Leroy, A. K., Schinnerer, E., Hughes, A., et al. 2021, ApJS, 257, 43 [NASA ADS] [CrossRef] [Google Scholar]
- Lotz, J. M., Primack, J., & Madau, P. 2004, AJ, 128, 163 [NASA ADS] [CrossRef] [Google Scholar]
- Lutz, D., Sturm, E., Janssen, A., et al. 2020, A&A, 633, A134 [NASA ADS] [CrossRef] [EDP Sciences] [Google Scholar]
- Martini, P. in The Interplay Among Black Holes, Stars and ISM in Galactic Nuclei, eds. T. Storchi-Bergmann, L. C. Ho, & H. R. Schmitt (Cambridge, UK: Cambridge University Press), 222, 235 [Google Scholar]
- Mazzalay, X., Saglia, R. P., Erwin, P., et al. 2013, MNRAS, 428, 2389 [NASA ADS] [CrossRef] [Google Scholar]
- McMullin, J. P., Waters, B., Schiebel, D., Young, W., & Golap, K. 2007, ASP Conf. Ser., 376, 127 [Google Scholar]
- Meenakshi, M., Mukherjee, D., Wagner, A. Y., et al. 2022, MNRAS, 516, 766 [NASA ADS] [CrossRef] [Google Scholar]
- Mercedes-Feliz, J., Anglés-Alcázar, D., Hayward, C. C., et al. 2023, MNRAS, 524, 3446 [NASA ADS] [CrossRef] [Google Scholar]
- Mingozzi, M., Cresci, G., Venturi, G., et al. 2019, A&A, 622, A146 [NASA ADS] [CrossRef] [EDP Sciences] [Google Scholar]
- Morganti, R., Tadhunter, C. N., & Oosterloo, T. A. 2005, A&A, 444, L9 [NASA ADS] [CrossRef] [EDP Sciences] [Google Scholar]
- Morganti, R., Frieswijk, W., Oonk, R. J. B., Oosterloo, T., & Tadhunter, C. 2013, A&A, 552, L4 [NASA ADS] [CrossRef] [EDP Sciences] [Google Scholar]
- Morganti, R., Oosterloo, T., Oonk, J. B. R., Frieswijk, W., & Tadhunter, C. 2015, A&A, 580, A1 [NASA ADS] [CrossRef] [EDP Sciences] [Google Scholar]
- Mukherjee, D., Bicknell, G. V., Wagner, A. Y., Sutherland, R. S., & Silk, J. 2018a, MNRAS, 479, 5544 [NASA ADS] [CrossRef] [Google Scholar]
- Mukherjee, D., Wagner, A. Y., Bicknell, G. V., et al. 2018b, MNRAS, 476, 80 [NASA ADS] [CrossRef] [Google Scholar]
- Müller Sánchez, F., Davies, R. I., Genzel, R., et al. 2009, ApJ, 691, 749 [Google Scholar]
- Müller-Sánchez, F., Hicks, E. K. S., Malkan, M., et al. 2018, ApJ, 858, 48 [CrossRef] [Google Scholar]
- Nowak, N., Thomas, J., Erwin, P., et al. 2010, MNRAS, 403, 646 [NASA ADS] [CrossRef] [Google Scholar]
- Onishi, K., Iguchi, S., Davis, T. A., et al. 2017, MNRAS, 468, 4663 [NASA ADS] [CrossRef] [Google Scholar]
- Peeples, M. S., & Martini, P. 2006, ApJ, 652, 1097 [NASA ADS] [CrossRef] [Google Scholar]
- Peralta de Arriba, L., Alonso-Herrero, A., García-Burillo, S., et al. 2023, A&A, 675, A58 [NASA ADS] [CrossRef] [EDP Sciences] [Google Scholar]
- Pillepich, A., Springel, V., Nelson, D., et al. 2018, MNRAS, 473, 4077 [Google Scholar]
- Piotrowska, J. M., Bluck, A. F. L., Maiolino, R., & Peng, Y. 2022, MNRAS, 512, 1052 [NASA ADS] [CrossRef] [Google Scholar]
- Querejeta, M., Schinnerer, E., García-Burillo, S., et al. 2016, A&A, 593, A118 [NASA ADS] [CrossRef] [EDP Sciences] [Google Scholar]
- R Core Team 2021, R: A Language and Environment for Statistical Computing (Vienna, Austria: R Foundation for Statistical Computing) [Google Scholar]
- Ramos Almeida, C., & Ricci, C. 2017, Nat. Astron., 1, 679 [Google Scholar]
- Ramos Almeida, C., Bischetti, M., García-Burillo, S., et al. 2022, A&A, 658, A155 [NASA ADS] [CrossRef] [EDP Sciences] [Google Scholar]
- Rao, V. V., Kharb, P., Rubinur, K., et al. 2023, MNRAS, 524, 1615 [NASA ADS] [CrossRef] [Google Scholar]
- Ricci, C., Trakhtenbrot, B., Koss, M. J., et al. 2017a, Nature, 549, 488 [NASA ADS] [CrossRef] [Google Scholar]
- Ricci, C., Trakhtenbrot, B., Koss, M. J., et al. 2017b, ApJS, 233, 17 [Google Scholar]
- Ricci, C., Ananna, T. T., Temple, M. J., et al. 2022, ApJ, 938, 67 [NASA ADS] [CrossRef] [Google Scholar]
- Ricci, C., Ichikawa, K., Stalevski, M., et al. 2023a, ApJ, 959, 27 [NASA ADS] [CrossRef] [Google Scholar]
- Ricci, C., Chang, C.-S., Kawamuro, T., et al. 2023b, ApJ, 952, L28 [NASA ADS] [CrossRef] [Google Scholar]
- Riffel, R. A., Vale, T. B., Storchi-Bergmann, T., & McGregor, P. J. 2014, MNRAS, 442, 656 [NASA ADS] [CrossRef] [Google Scholar]
- Rosario, D. J., Burtscher, L., Davies, R. I., et al. 2018, MNRAS, 473, 5658 [NASA ADS] [CrossRef] [Google Scholar]
- Rosario, D. J., Togi, A., Burtscher, L., et al. 2019, ApJ, 875, L8 [NASA ADS] [CrossRef] [Google Scholar]
- Ruffa, I., Prandoni, I., Davis, T. A., et al. 2022, MNRAS, 510, 4485 [NASA ADS] [CrossRef] [Google Scholar]
- Sánchez, S. F., Kennicutt, R. C., Gil de Paz, A., et al. 2012, A&A, 538, A8 [Google Scholar]
- Sandstrom, K. M., Leroy, A. K., Walter, F., et al. 2013, ApJ, 777, 5 [Google Scholar]
- Schawinski, K., Koss, M., Berney, S., & Sartori, L. F. 2015, MNRAS, 451, 2517 [Google Scholar]
- Schaye, J., Crain, R. A., Bower, R. G., et al. 2015, MNRAS, 446, 521 [Google Scholar]
- Schinnerer, E., Meidt, S. E., Pety, J., et al. 2013, ApJ, 779, 42 [Google Scholar]
- Scoville, N. Z., Hall, D. N. B., Ridgway, S. T., & Kleinmann, S. G. 1982, ApJ, 253, 136 [NASA ADS] [CrossRef] [Google Scholar]
- Shimizu, T. T., Davies, R. I., Lutz, D., et al. 2019, MNRAS, 490, 5860 [Google Scholar]
- Smajić, S., Moser, L., Eckart, A., et al. 2015, A&A, 583, A104 [NASA ADS] [CrossRef] [EDP Sciences] [Google Scholar]
- Storchi-Bergmann, T., & Schnorr-Müller, A. 2019, Nat. Astron., 3, 48 [Google Scholar]
- Teng, Y.-H., Sandstrom, K. M., Sun, J., et al. 2023, ApJ, 950, 119 [NASA ADS] [CrossRef] [Google Scholar]
- Toba, Y., Ueda, Y., Matsuoka, K., et al. 2019, MNRAS, 484, 196 [Google Scholar]
- Toba, Y., Ueda, Y., Gandhi, P., et al. 2021, ApJ, 912, 91 [NASA ADS] [CrossRef] [Google Scholar]
- Torrey, P., Hopkins, P. F., Faucher-Giguère, C.-A., et al. 2020, MNRAS, 497, 5292 [NASA ADS] [CrossRef] [Google Scholar]
- Tristram, K. R. W., Impellizzeri, C. M. V., Zhang, Z.-Y., et al. 2022, A&A, 664, A142 [NASA ADS] [CrossRef] [EDP Sciences] [Google Scholar]
- Ulivi, L., Venturi, G., Cresci, G., et al. 2024, A&A, 685, A122 [NASA ADS] [CrossRef] [EDP Sciences] [Google Scholar]
- Urry, C. M., & Padovani, P. 1995, PASP, 107, 803 [NASA ADS] [CrossRef] [Google Scholar]
- Veilleux, S., Maiolino, R., Bolatto, A. D., & Aalto, S. 2020, A&ARv, 28, 2 [NASA ADS] [CrossRef] [Google Scholar]
- Venanzi, M., Hönig, S., & Williamson, D. 2020, ApJ, 900, 174 [Google Scholar]
- Venturi, G., Cresci, G., Marconi, A., et al. 2021, A&A, 648, A17 [NASA ADS] [CrossRef] [EDP Sciences] [Google Scholar]
- Viti, S., García-Burillo, S., Fuente, A., et al. 2014, A&A, 570, A28 [NASA ADS] [CrossRef] [EDP Sciences] [Google Scholar]
- Wada, K. 1994, PASJ, 46, 165 [NASA ADS] [Google Scholar]
- Wada, K. 2012, ApJ, 758, 66 [Google Scholar]
- Wada, K. 2015, ApJ, 812, 82 [Google Scholar]
- Wada, K., Schartmann, M., & Meijerink, R. 2016, ApJ, 828, L19 [Google Scholar]
- Wagner, A. Y., & Bicknell, G. V. 2011, ApJ, 728, 29 [NASA ADS] [CrossRef] [Google Scholar]
- Wagner, A. Y., Bicknell, G. V., & Umemura, M. 2012, ApJ, 757, 136 [CrossRef] [Google Scholar]
- Weinberger, R., Springel, V., Hernquist, L., et al. 2017, MNRAS, 465, 3291 [Google Scholar]
- Williamson, D., Hönig, S., & Venanzi, M. 2019, ApJ, 876, 137 [NASA ADS] [CrossRef] [Google Scholar]
- Williamson, D., Hönig, S., & Venanzi, M. 2020, ApJ, 897, 26 [NASA ADS] [CrossRef] [Google Scholar]
- Yasuda, A., Kuno, N., Sorai, K., et al. 2023, PASJ, 75, 743 [NASA ADS] [CrossRef] [Google Scholar]
- Zhuang, M.-Y., Ho, L. C., & Shangguan, J. 2018, ApJ, 862, 118 [NASA ADS] [CrossRef] [Google Scholar]
Appendix A: Object tables
For more details, readers can refer to Tables A.1 and A.2
Observational properties of the CO sample.
NIR observations.
Appendix B: Estimate of LX for a fraction of the lower luminosity sample galaxies
In order to complete the X-ray luminosities for the sources in our sample, we checked in the XMM-Newton and Chandra archives for observations when the objects were not included in the BASS sample. We found XMM-Newton observations for five objects (namely NGC 3718, NGC 4321, NGC 4569, NGC 4579 and NGC 6951) and Chandra for six sources (namely NGC 2782, NGC 3718, NGC 4321, NGC 4569, NGC 4579, and NGC 5953). Four targets have been observed with both satellites. Unfortunately, after processing the data, the observations of NGC 5953 and NGC 6951 resulted in less than 5 ksec that were not enough to obtain a spectrum for these two sources. Only one XMM-Newton observations was available for each of the targets. Among Chandra observations, we chose the one with the longest exposure time when more than one observation is available. Table B.1 contains the information of the five sources with available spectra together with the spectral fitting results.
Chandra and XMM-Newton observations were processed using the standard pipelines CIAO and SAS, respectively. We extracted the nuclear spectrum, coincident with the coordinates of the targets using a 0.5 and 20 arcsec radial aperture, respectively. A background region was manually selected in a source-free region close to the target extraction. We grouped the spectra with a minimum of 20 counts per bin using the command line GRPPHA within Heasoft software. We then used the latest version of the XSPEC software to perform spectral fitting.
Our simplest model accounts for partial observed intrinsic emission. This in the nomenclature of the software is written as pcfabs × powerlaw (M1 in Table B.1). Clear contribution from extended host diffuse emission is found for most of the targets when using XMM-Newton observations due to the poorer spatial resolution compared to Chandra. To account for this emission, we added a thermal component to the model when needed. This new baseline model is written in the nomenclature of the software as apec + pcfabs × powerlaw (M2 in Table B.1). In two sources (NGC 2782 and NGC 4579), we found clear signatures of the FeKα emission line. In these two case we added to M2, a reflection component to account for this line. This final baseline model is written in the software nomenclature of the software as pexmon + apec + pcfabs × powerlaw (M3 in Table B.1). When both satellites are available, we link all the parameters between observations except for the normalizations of the intrinsic continuum (to allow plausible changes in flux). No significative variations are found in our analysis. The photon index was poorly constrained in three sources. In these cases, we fixed it to the standard value of Γ = 1.8. Although some objects do show a complex behavior that might require additional components, this analysis is good enough to reproduce the data in order to obtain the X-ray observation corrected luminosity used in this work.
The existence of the FeKα line and/or the reflection component confirm the AGN nature except for NGC 4321 and NGC 4569, where the luminosity and spectral shape could be consistent with a stellar nature. Indeed, NGC 4321 was classified as nonAGN by González-Martín et al. (2009). Therefore, the AGN nature of these two sources is still uncertain.
LX values obtained from X-ray spectral fitting.
Appendix C: Molecular gas surface densities and concentration indices
We list in Table C.1 the cold and hot molecular gas surface densities and concentration indices (CCI and HCI) obtained for the galaxies of the sample used in this paper.
Gas surface densities and concentration indices in the galaxies of our combined sample.
Appendix D: Other trends of the cold molecular gas concentration index
Fig. D.1 shows the trend with LX of an alternative definition of the concentration of cold molecular gas, which adopts the region defined by the outer corona of the CND (50 pc≤r ≤ 200 pc) to normalize the molecular surface density of the nuclear region (r≤50 pc).

Fig. D.2 shows the CCI values as a function of the Eddington ratio for the 27 galaxies in our sample for which an estimate of λEdd is available.
Appendix E: CND-scale distribution of molecular gas from different CO line transitions
Figures E.1 and E.2 show the images of the CND of the AGN feedback branch targets NGC 7172 and NGC 5728 obtained in the 3–2, 2–1, and 1–0 transitions of CO. In spite of the different spatial resolutions used in these observations, the derived 2D distributions, normalized radial profiles, and CCI values show a weak dependence on the CO transition used to image the distribution of molecular gas in these sources.
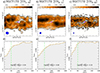 |
Fig. E.1. Distribution of “cold" molecular gas derived from different CO line transitions. Upper panels: Velocity-integrated intensity maps derived from the CO(1–0), CO(2–1), and CO(3–2) lines in the central 400 pc×400 pc region of NGC 7172. Contour levels have a logarithmic spacing from 2.5σ to 90% of the peak CO intensity inside the displayed field of view. The (blue) filled ellipses at the bottom left corners represent the beam sizes of the observations. Lower panels: Normalized radial distributions of molecular gas derived out to r = 200 pc from the 3 CO maps of NGC 7172 shown in the upper panels. The estimated molecular gas concentration indices are displayed in panels d)-to-f). |
All Tables
Median values of the concentration indices for the cold and hot molecular gas and hot-to-cold ratios.
Gas surface densities and concentration indices in the galaxies of our combined sample.
All Figures
|
Fig. 1. Histograms showing the distribution of independent data sets obtained from the targets of the combined ALMA+PdBI and NIR data samples as a function of the AGN luminosities measured at X-ray wavelengths (LX) in the 2–10 keV band (in log units). For the sake of comparison, galaxies classified as nonAGN populate the histogram arbitrarily located at log(LX) = 37 erg s−1. |
| In the text | |
|
Fig. 2. Distribution of cold molecular gas. Left panel: Concentration of “cold” molecular gas measured for the central regions of galaxies of the sample derived from the ratio (in log units) of the average H2 surface densities estimated from CO line emission at two spatial scales: r ≤ 50 pc ( |
| In the text | |
|
Fig. 3. Average normalized radial distributions (Inorm(r)) of “cold” molecular gas derived from CO out to r = 210 pc for the seven LX bins defined in Sect. 4.1. We also show the Inorm(r) profile representative of the nonAGN galaxy subset. Bins 1–4 and 5–7 correspond to the AGN feedback and build-up branches, respectively. Histograms and error bars for each bin represent the median and the median absolute deviation values derived from the distribution of normalized individual galaxy profiles sampled with a radial binning Δr = 20 pc. The red-shaded areas illustrate the uncertainties around the median values. The median value of the concentration index of molecular gas and its associated uncertainty are shown in each panel. The common scales adopted for all bins in the x and y axes are shown in the lower left panel. |
| In the text | |
|
Fig. 4. Comparison of radial profiles. Upper panel: Comparison between the average radial distributions of molecular gas for bins 1 and 5, which correspond to the subsets of galaxies showing the lowest and the highest concentration indices of molecular gas in the sample respectively. Lower panel: Same as the upper panel but comparing the average radial distributions of molecular gas for bins 1 and 7, which represent the highest and the lowest ends of the LX distribution in the sample, respectively. |
| In the text | |
|
Fig. 5. Maps and radial profiles. Upper panels: CO velocity-integrated intensity maps derived for three representative targets selected from the galaxies of LX bin 1 (NGC 7582; (a)), bin 2 (NGC 1068; (b)), and bin 3 (NGC 4388; (c)), as defined in Sect. 5.1. Contour levels have a logarithmic spacing from 2.5σ to 90% of the peak CO intensity inside the displayed field of view, which corresponds to 400 pc × 400 pc. The (green) ellipses identify the circular regions in the deprojected planes of the galaxies extending out to r ≤ 50 pc and r ≤ 200 pc. The (blue) filled ellipses in the bottom left corners represent the beam sizes of the observations. Lower panels: Normalized radial distributions of molecular gas derived out to r = 210 pc for the galaxies shown in the upper panels. The inner r ≤ 50 pc region is delimited by the dashed line. The estimated molecular gas concentration indices are displayed in panels (d)-to-(f). |
| In the text | |
|
Fig. 6. Same as the upper and lower panels of Fig. 5 but for three representative targets selected from the galaxies of LX bin 4 (NGC 6300; (a)), bin 5 (NGC 613; (b)), and bin 6 (NGC 1808; (c)). Symbols as in Fig. 5. |
| In the text | |
|
Fig. 7. Same as the upper and lower panels of Fig. 5 but for two representative targets selected from the galaxies of LX bin 7 (NGC 4826; (a)) and from the subset of nonAGN (NGC 7727; (b)). Symbols as in Fig. 5. |
| In the text | |
|
Fig. 8. Gini coefficients derived for the radial profiles obtained from the CO distributions in the galaxies of the sample as a function of LX (upper panel) and the concentration index of cold molecular gas (middle panel). Flux-weighted mean radii of the normalized distribution of cold molecular gas as a function of the Gini coefficients of the radial profiles derived for the galaxies of our sample (lower panel). Error bars account for the estimated uncertainties on the Gini coefficients. We indicate the estimated correlation coefficients (Rs) and their associated p-values for the three distributions. Gini coefficient values are color-coded as a function of LX (black indicates nonAGN galaxies). |
| In the text | |
|
Fig. 9. Distribution of “hot” molecular gas. Left panel: Same as the left panel of Fig. 2 but showing the change with LX of the concentration of “hot” molecular gas measured for the central regions of the galaxies in our sample derived from the ratio (in log units) of the average H2 surface densities estimated from the 2.1 μm line emission at two spatial scales: r ≤ 50 pc ( |
| In the text | |
|
Fig. 10. Same as Fig. 3 but showing the average normalized radial distributions (Inorm(r)) of “hot” molecular gas derived out to r = 210 pc from the 2.1 μm line emission for the five LX bins defined in Sect. 6.1 and for the nonAGN galaxy subset. Symbols for histograms and error bars for the median and the median absolute deviation values for the “hot” molecular gas profiles are defined and shown as in Fig. 3. The median value of the concentration index of “hot” molecular gas and its associated uncertainty are shown in each panel. The common scales adopted for all bins in the x and y axes are shown in the lower left panel. |
| In the text | |
|
Fig. 11. Comparison of radial profiles of “hot” molecular gas. Upper panel: Comparison between the average radial distributions of “hot” molecular gas for bins 1 and 3, which correspond to the subsets of galaxies showing the lowest and the highest concentration indices of ‘hot’ molecular gas in the sample respectively, as defined in Sect. 6.1. Lower panel: Same as the upper panel but comparing the average radial distributions of “hot” molecular gas for bins 1 and 5 defined in Sect.6.1, which represent the highest and the lowest ends of the LX distribution in our sample respectively. |
| In the text | |
|
Fig. 12. Maps and radial profiles. Upper panels: Velocity-integrated intensity maps derived from the 2.1 μm line for three representative targets selected from the galaxies of LX bin 1 (NGC 7582; (a)), bin 2 (NGC 1068; (b)), and bin 3 (NGC 6300; (c)), as defined in Sect. 6.1. Contour levels have a logarithmic spacing from 2.5σ to 90% of the peak 2.1 μm intensity inside the displayed field of view, which corresponds to 400 pc × 400 pc. Lower panels: Normalized radial distributions of ‘hot’ molecular gas derived out to r = 210 pc for the galaxies shown in the upper panels. The estimated ‘hot’ molecular gas concentration indices are displayed in panels (d)-to-(f). All symbols as in Fig. 5. |
| In the text | |
|
Fig. 13. Same as the upper and lower panels of Fig. 12 but showing the maps and radial distributions of three representative targets selected from the galaxies of LX bin 4 (NGC 613; (a) and (d)), bin 5 (NGC 1672; (b) and (e)), and the nonAGN subset (NGC 7727; (c) and (f)), as defined in Sect. 6.1. Symbols as in Fig. 12. |
| In the text | |
|
Fig. 14. Hot-to-cold gas mass ratios. Upper panel: Change of the ratio (in log units) of the hot-to-cold molecular gas mass surface density ratios with LX estimated from the CO and 2.1 μm line emissions at the two spatial scales analyzed in this work: r ≤ 50 pc ( |
| In the text | |
|
Fig. 15. Median values of the concentration indices for the seven LX bins defined in Sect. 5.1 and for the nonAGN galaxies. Symbols are color-coded (in linear scale) to reflect the average fraction of large-scale bars present in the galaxies belonging to each luminosity bin. The ranges of LX corresponding to the AGN build-up and AGN feedback branches are indicated. |
| In the text | |
|
Fig. 16. Diagram showing the hydrogen column densities measured towards the AGN ( |
| In the text | |
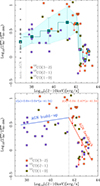 |
Fig. D.1. Same as Fig.2 but defining the circumnuclear scales as the outer corona r ≤ 50 − 200pc ( |
| In the text | |
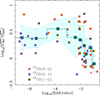 |
Fig. D.2. Same as Fig.2 but as a function of the Eddington ratio. |
| In the text | |
|
Fig. E.1. Distribution of “cold" molecular gas derived from different CO line transitions. Upper panels: Velocity-integrated intensity maps derived from the CO(1–0), CO(2–1), and CO(3–2) lines in the central 400 pc×400 pc region of NGC 7172. Contour levels have a logarithmic spacing from 2.5σ to 90% of the peak CO intensity inside the displayed field of view. The (blue) filled ellipses at the bottom left corners represent the beam sizes of the observations. Lower panels: Normalized radial distributions of molecular gas derived out to r = 200 pc from the 3 CO maps of NGC 7172 shown in the upper panels. The estimated molecular gas concentration indices are displayed in panels d)-to-f). |
| In the text | |
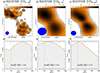 |
Fig. E.2. Same as Fig. E.1 but showing the maps and normalized radial distributions for NGC 5728. |
| In the text | |
Current usage metrics show cumulative count of Article Views (full-text article views including HTML views, PDF and ePub downloads, according to the available data) and Abstracts Views on Vision4Press platform.
Data correspond to usage on the plateform after 2015. The current usage metrics is available 48-96 hours after online publication and is updated daily on week days.
Initial download of the metrics may take a while.