Fig. 12.
Download original image
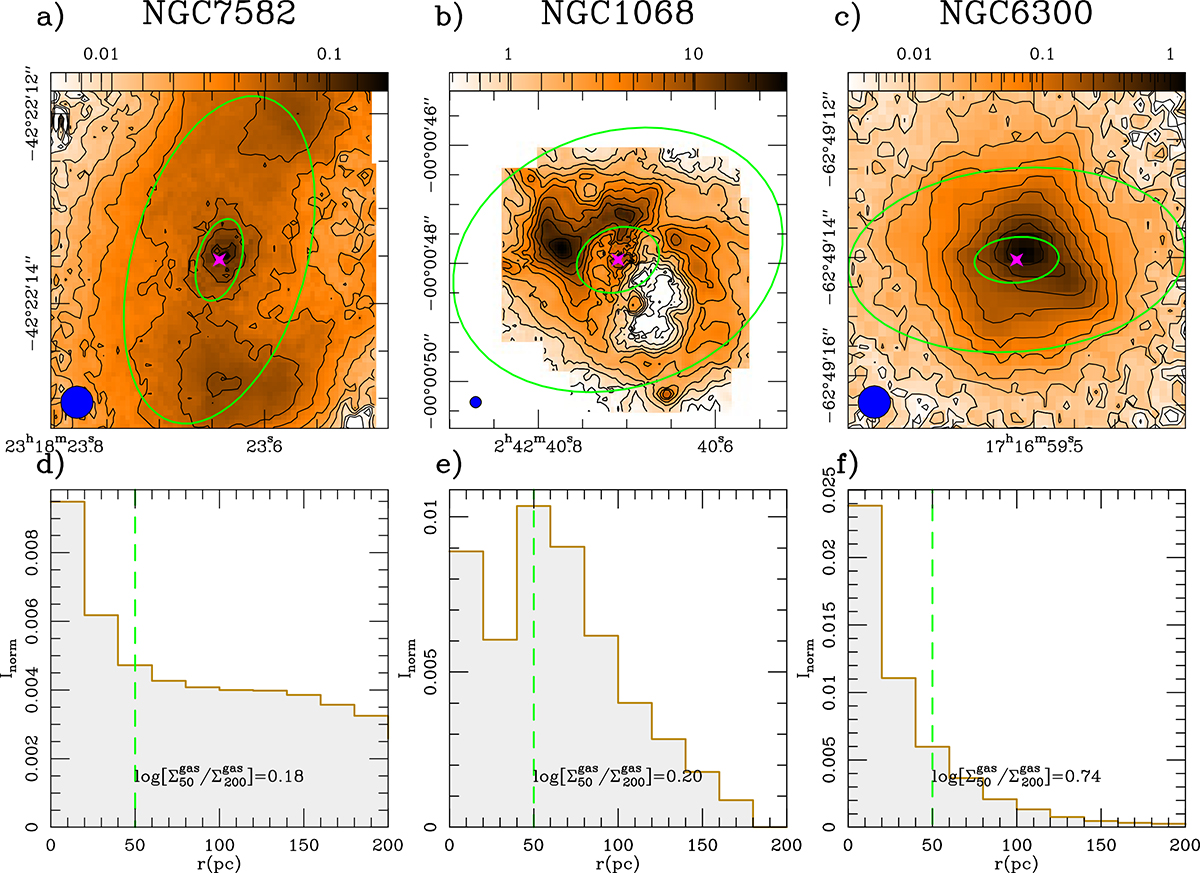
Maps and radial profiles. Upper panels: Velocity-integrated intensity maps derived from the 2.1 μm line for three representative targets selected from the galaxies of LX bin 1 (NGC 7582; (a)), bin 2 (NGC 1068; (b)), and bin 3 (NGC 6300; (c)), as defined in Sect. 6.1. Contour levels have a logarithmic spacing from 2.5σ to 90% of the peak 2.1 μm intensity inside the displayed field of view, which corresponds to 400 pc × 400 pc. Lower panels: Normalized radial distributions of ‘hot’ molecular gas derived out to r = 210 pc for the galaxies shown in the upper panels. The estimated ‘hot’ molecular gas concentration indices are displayed in panels (d)-to-(f). All symbols as in Fig. 5.
Current usage metrics show cumulative count of Article Views (full-text article views including HTML views, PDF and ePub downloads, according to the available data) and Abstracts Views on Vision4Press platform.
Data correspond to usage on the plateform after 2015. The current usage metrics is available 48-96 hours after online publication and is updated daily on week days.
Initial download of the metrics may take a while.