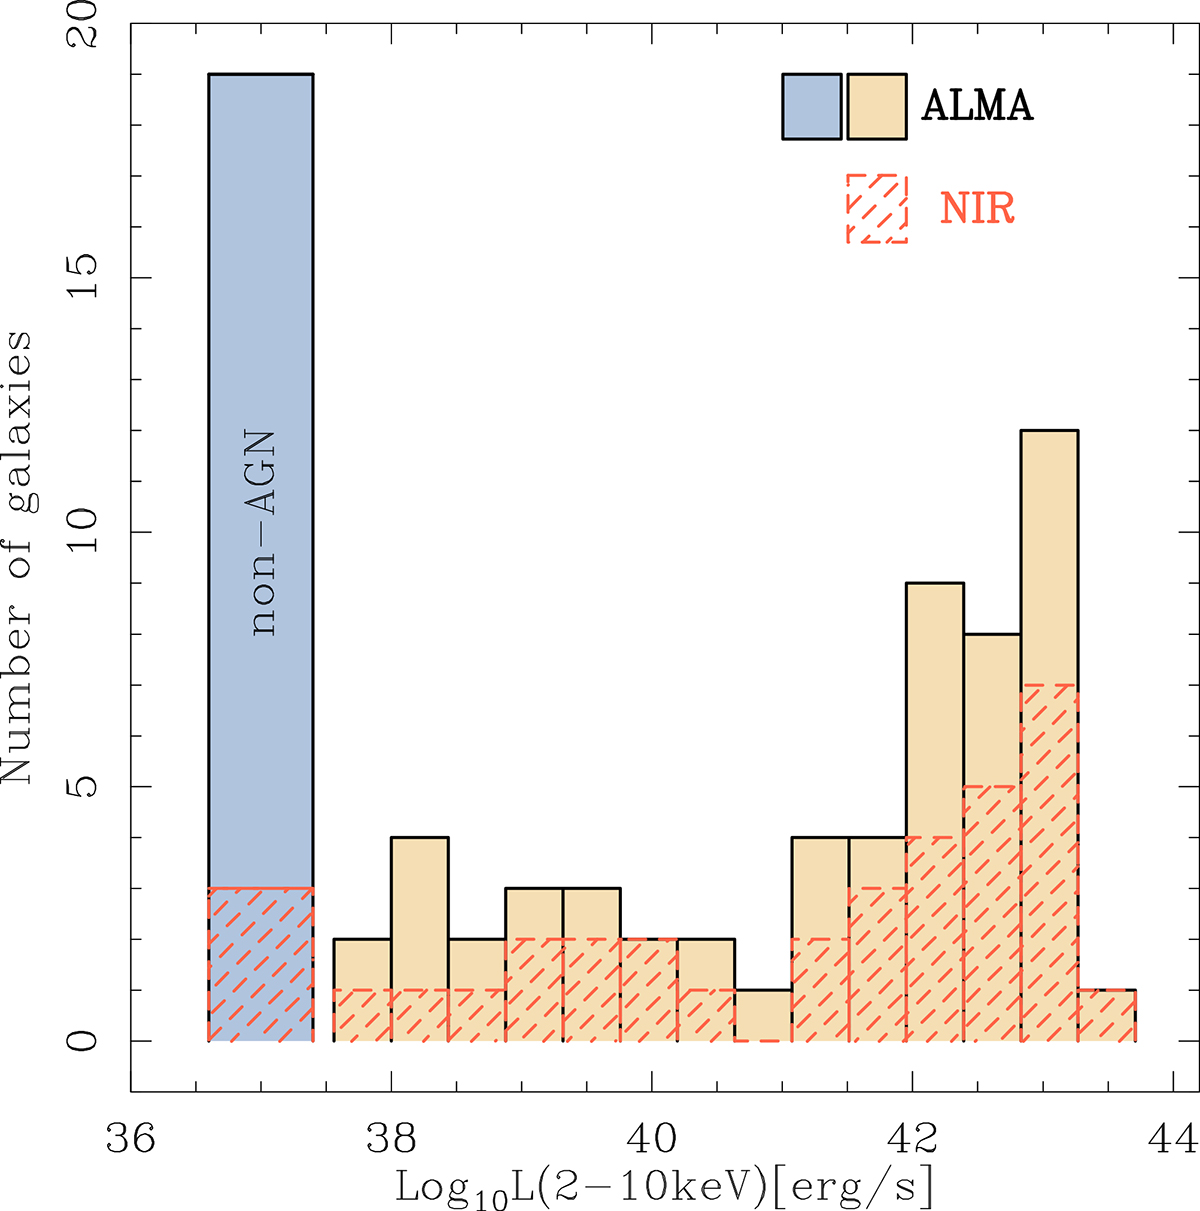
Fig. 1.
Download original image
Histograms showing the distribution of independent data sets obtained from the targets of the combined ALMA+PdBI and NIR data samples as a function of the AGN luminosities measured at X-ray wavelengths (LX) in the 2–10 keV band (in log units). For the sake of comparison, galaxies classified as nonAGN populate the histogram arbitrarily located at log(LX) = 37 erg s−1.
Current usage metrics show cumulative count of Article Views (full-text article views including HTML views, PDF and ePub downloads, according to the available data) and Abstracts Views on Vision4Press platform.
Data correspond to usage on the plateform after 2015. The current usage metrics is available 48-96 hours after online publication and is updated daily on week days.
Initial download of the metrics may take a while.