Fig. 4.
Download original image
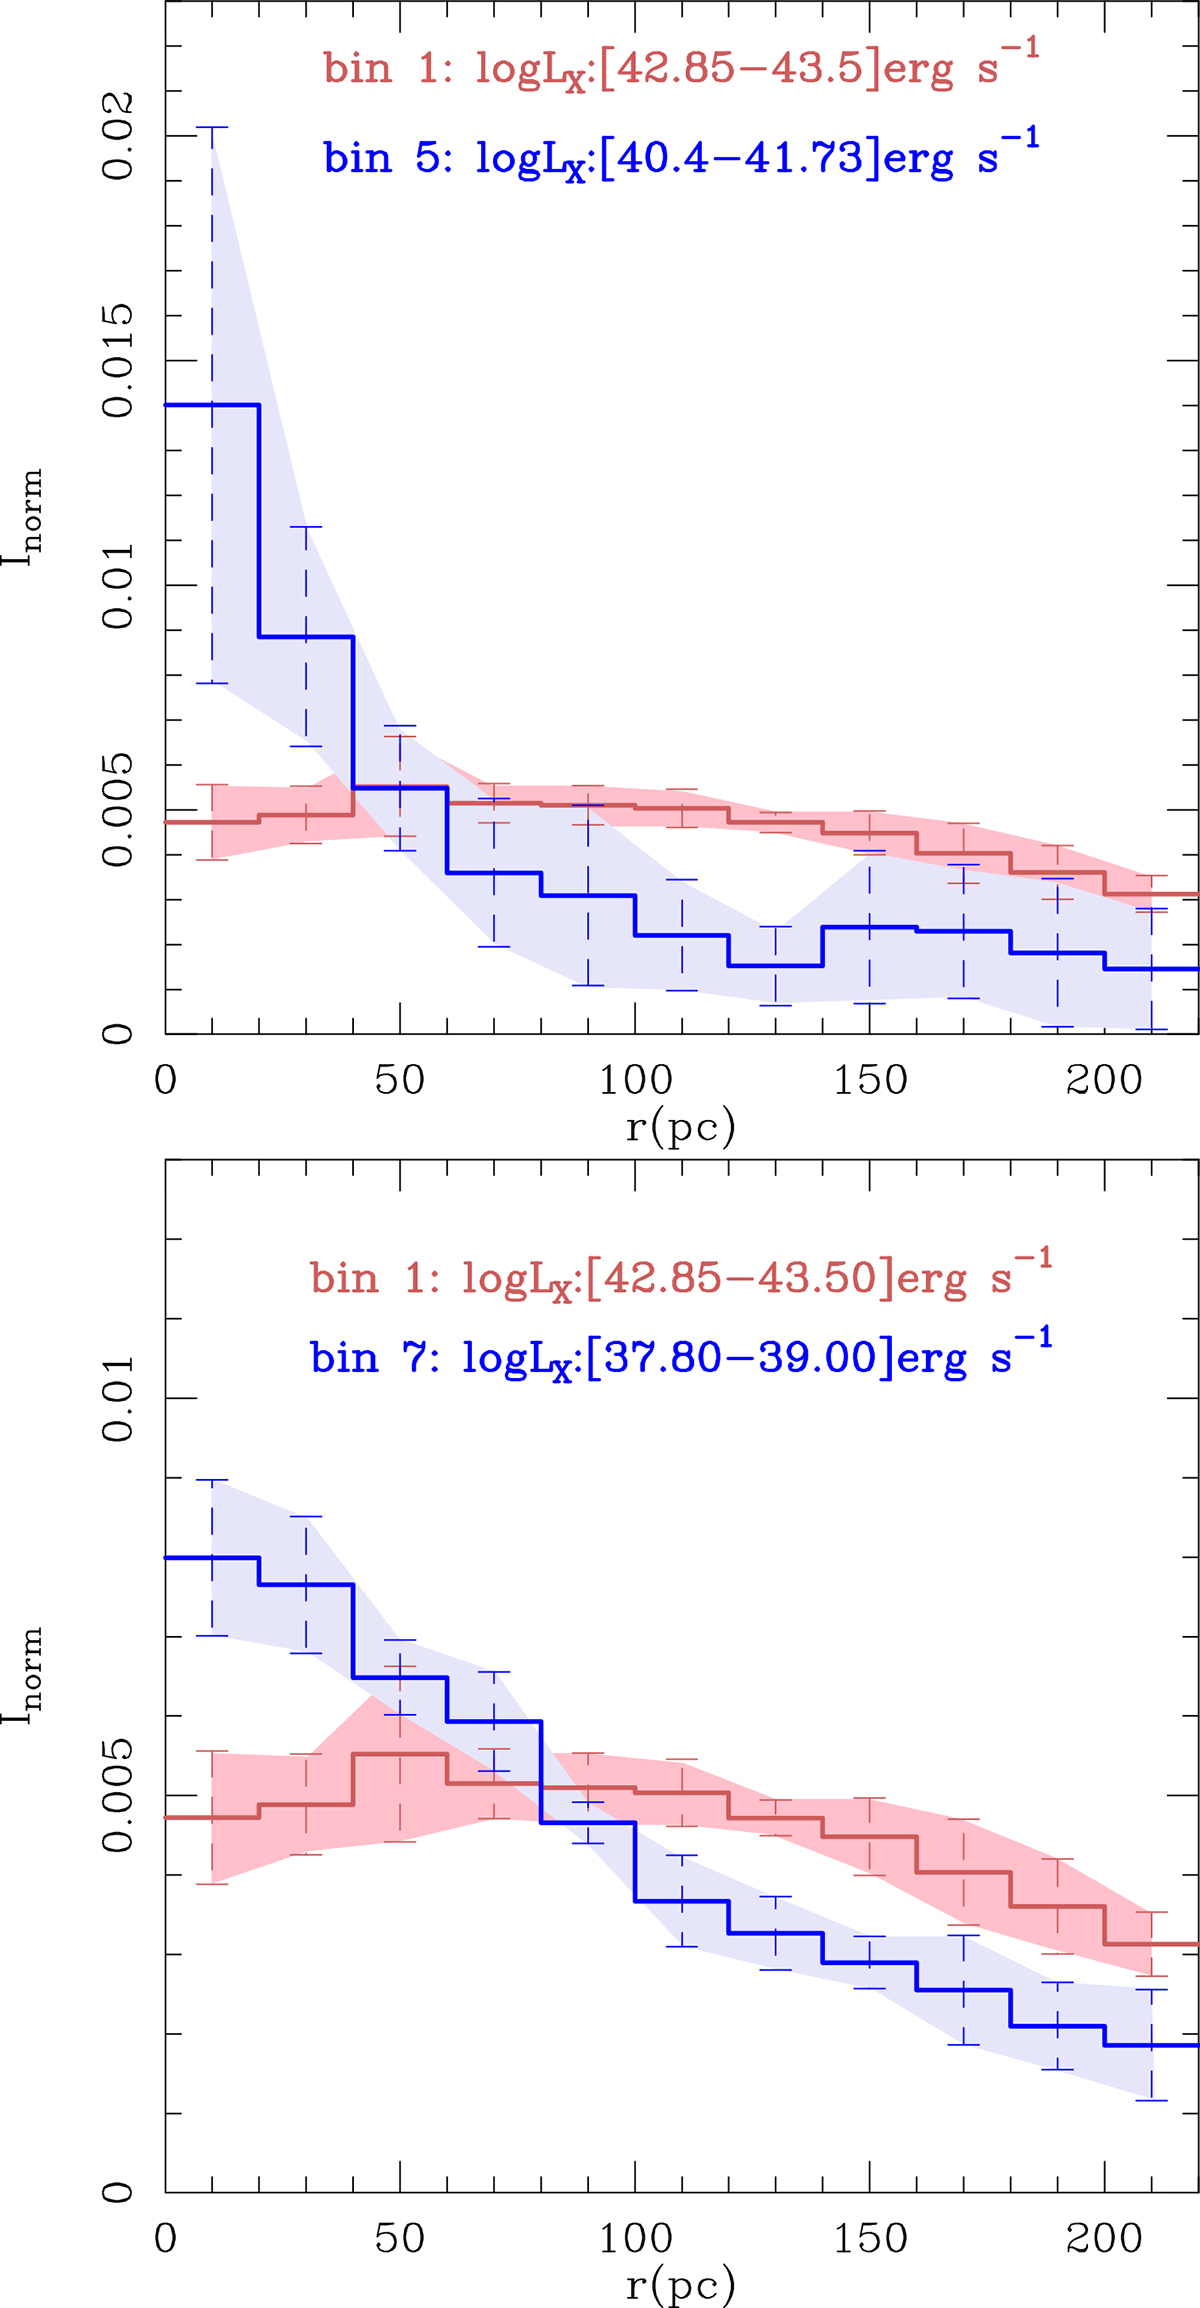
Comparison of radial profiles. Upper panel: Comparison between the average radial distributions of molecular gas for bins 1 and 5, which correspond to the subsets of galaxies showing the lowest and the highest concentration indices of molecular gas in the sample respectively. Lower panel: Same as the upper panel but comparing the average radial distributions of molecular gas for bins 1 and 7, which represent the highest and the lowest ends of the LX distribution in the sample, respectively.
Current usage metrics show cumulative count of Article Views (full-text article views including HTML views, PDF and ePub downloads, according to the available data) and Abstracts Views on Vision4Press platform.
Data correspond to usage on the plateform after 2015. The current usage metrics is available 48-96 hours after online publication and is updated daily on week days.
Initial download of the metrics may take a while.