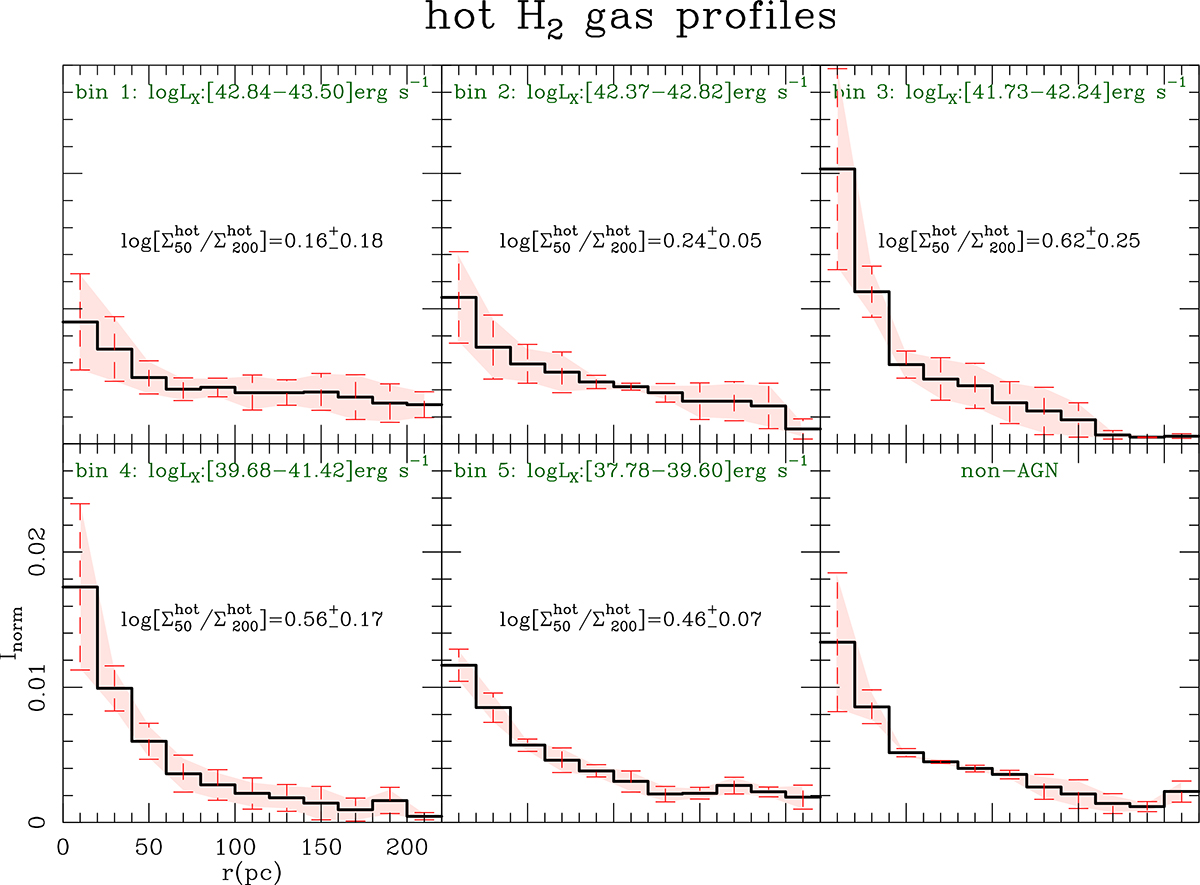
Fig. 10.
Download original image
Same as Fig. 3 but showing the average normalized radial distributions (Inorm(r)) of “hot” molecular gas derived out to r = 210 pc from the 2.1 μm line emission for the five LX bins defined in Sect. 6.1 and for the nonAGN galaxy subset. Symbols for histograms and error bars for the median and the median absolute deviation values for the “hot” molecular gas profiles are defined and shown as in Fig. 3. The median value of the concentration index of “hot” molecular gas and its associated uncertainty are shown in each panel. The common scales adopted for all bins in the x and y axes are shown in the lower left panel.
Current usage metrics show cumulative count of Article Views (full-text article views including HTML views, PDF and ePub downloads, according to the available data) and Abstracts Views on Vision4Press platform.
Data correspond to usage on the plateform after 2015. The current usage metrics is available 48-96 hours after online publication and is updated daily on week days.
Initial download of the metrics may take a while.