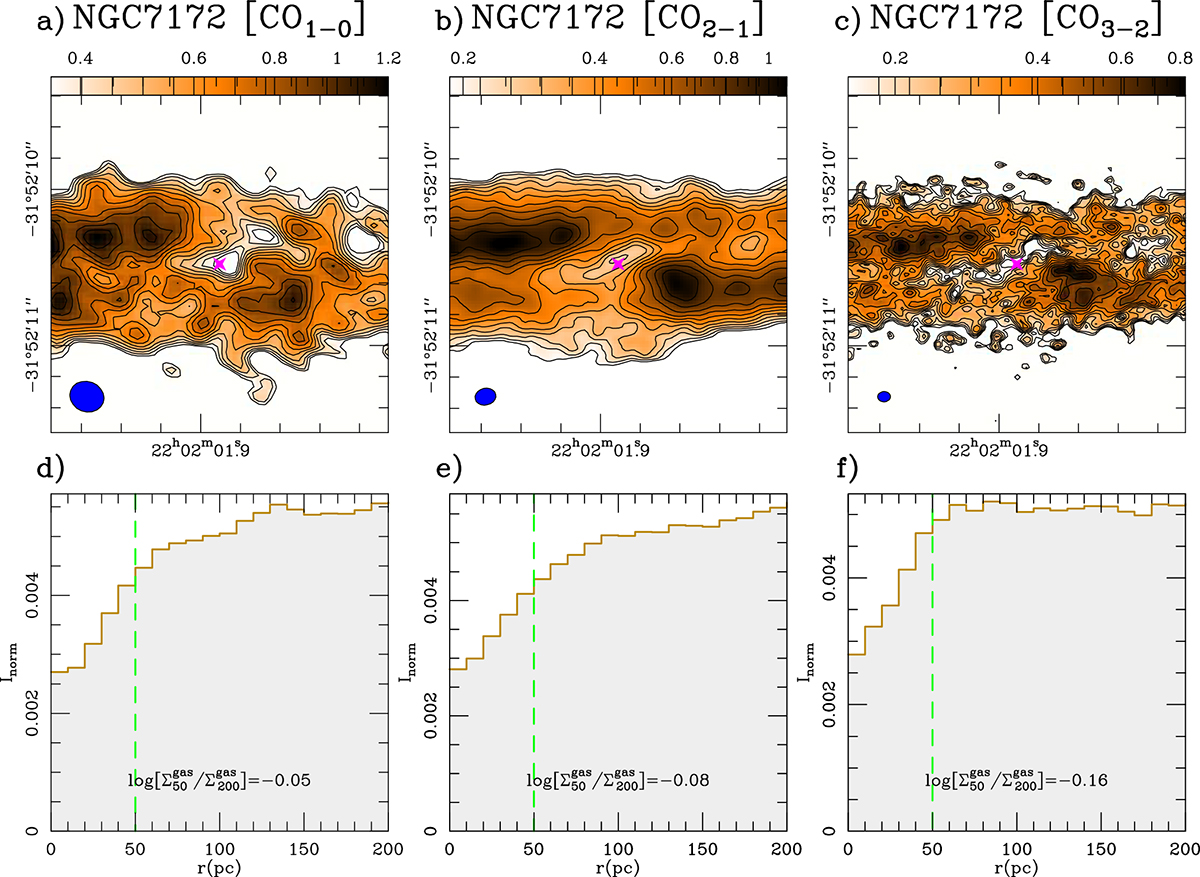
Fig. E.1.
Download original image
Distribution of “cold" molecular gas derived from different CO line transitions. Upper panels: Velocity-integrated intensity maps derived from the CO(1–0), CO(2–1), and CO(3–2) lines in the central 400 pc×400 pc region of NGC 7172. Contour levels have a logarithmic spacing from 2.5σ to 90% of the peak CO intensity inside the displayed field of view. The (blue) filled ellipses at the bottom left corners represent the beam sizes of the observations. Lower panels: Normalized radial distributions of molecular gas derived out to r = 200 pc from the 3 CO maps of NGC 7172 shown in the upper panels. The estimated molecular gas concentration indices are displayed in panels d)-to-f).
Current usage metrics show cumulative count of Article Views (full-text article views including HTML views, PDF and ePub downloads, according to the available data) and Abstracts Views on Vision4Press platform.
Data correspond to usage on the plateform after 2015. The current usage metrics is available 48-96 hours after online publication and is updated daily on week days.
Initial download of the metrics may take a while.