Fig. 2.
Download original image
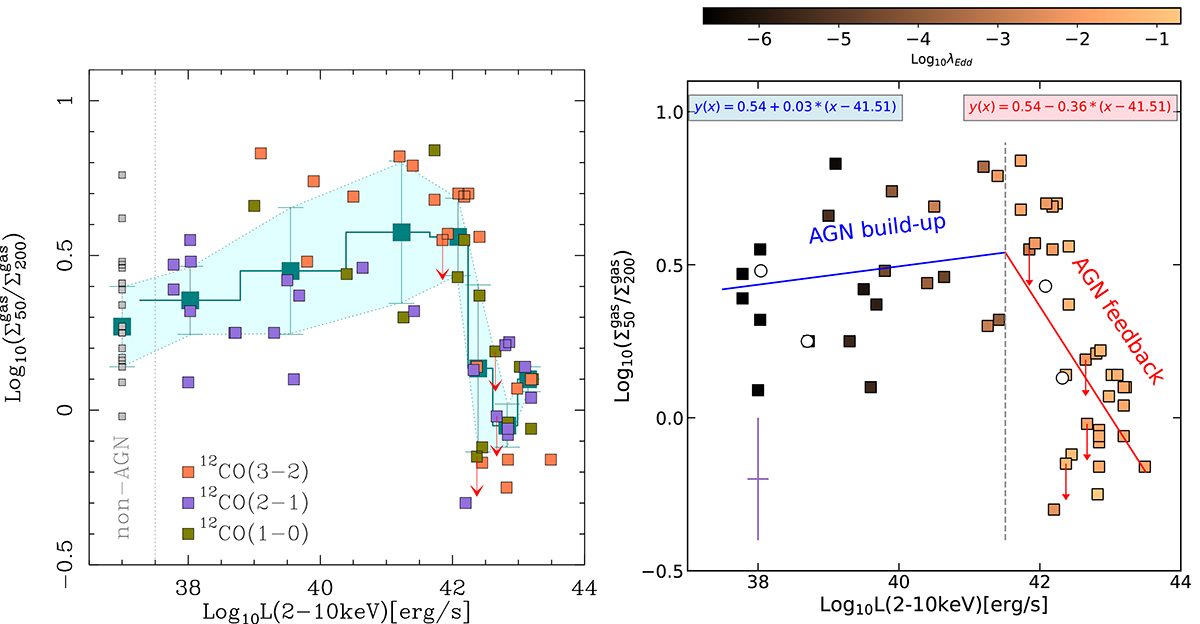
Distribution of cold molecular gas. Left panel: Concentration of “cold” molecular gas measured for the central regions of galaxies of the sample derived from the ratio (in log units) of the average H2 surface densities estimated from CO line emission at two spatial scales: r ≤ 50 pc (![]() ) and r ≤ 200 pc (
) and r ≤ 200 pc (![]() ). These spatial scales are representative of the nuclear and circumnuclear disk regions, respectively, as defined in Sect. 5.1. The concentration of molecular gas is shown as a function of the AGN luminosities measured at X-ray wavelengths (LX) in the 2–10 keV band (in log units). Symbols (small squares) are color-coded to identify the CO line used to estimate the surface densities for each AGN target. Concentration indices for nonAGN targets are displayed as (gray) square symbols located arbitrarily at log(LX) = 37 erg s−1. The large (green) squares stand for the median value of the concentration index estimated for the seven LX bins that cover the range of AGN luminosities spanned by the sample, as defined in Sect. 5.1, as well as for the nonAGN galaxies in the comparison sample. Error bars for each LX bin represent the median absolute deviations around the median values. The green-shaded area illustrates the uncertainties around the median values. Right panel: Same as the left panel but showing the two-branch linear solution found by the MARS algorithm to fit the distribution of concentration indices as a function of LX for the AGN build-up phase (blue straight line) and the AGN feedback phase (red straight line). Symbols are color coded as a function of the Eddington ratio (λEdd) except for the four galaxies for which this information is not available (empty circles). Uncertainties on the molecular gas mass ratios and on the AGN luminosities are ±0.2 dex and ±0.15 dex, respectively. Red arrows identify upper limits.
). These spatial scales are representative of the nuclear and circumnuclear disk regions, respectively, as defined in Sect. 5.1. The concentration of molecular gas is shown as a function of the AGN luminosities measured at X-ray wavelengths (LX) in the 2–10 keV band (in log units). Symbols (small squares) are color-coded to identify the CO line used to estimate the surface densities for each AGN target. Concentration indices for nonAGN targets are displayed as (gray) square symbols located arbitrarily at log(LX) = 37 erg s−1. The large (green) squares stand for the median value of the concentration index estimated for the seven LX bins that cover the range of AGN luminosities spanned by the sample, as defined in Sect. 5.1, as well as for the nonAGN galaxies in the comparison sample. Error bars for each LX bin represent the median absolute deviations around the median values. The green-shaded area illustrates the uncertainties around the median values. Right panel: Same as the left panel but showing the two-branch linear solution found by the MARS algorithm to fit the distribution of concentration indices as a function of LX for the AGN build-up phase (blue straight line) and the AGN feedback phase (red straight line). Symbols are color coded as a function of the Eddington ratio (λEdd) except for the four galaxies for which this information is not available (empty circles). Uncertainties on the molecular gas mass ratios and on the AGN luminosities are ±0.2 dex and ±0.15 dex, respectively. Red arrows identify upper limits.
Current usage metrics show cumulative count of Article Views (full-text article views including HTML views, PDF and ePub downloads, according to the available data) and Abstracts Views on Vision4Press platform.
Data correspond to usage on the plateform after 2015. The current usage metrics is available 48-96 hours after online publication and is updated daily on week days.
Initial download of the metrics may take a while.