Fig. 16.
Download original image
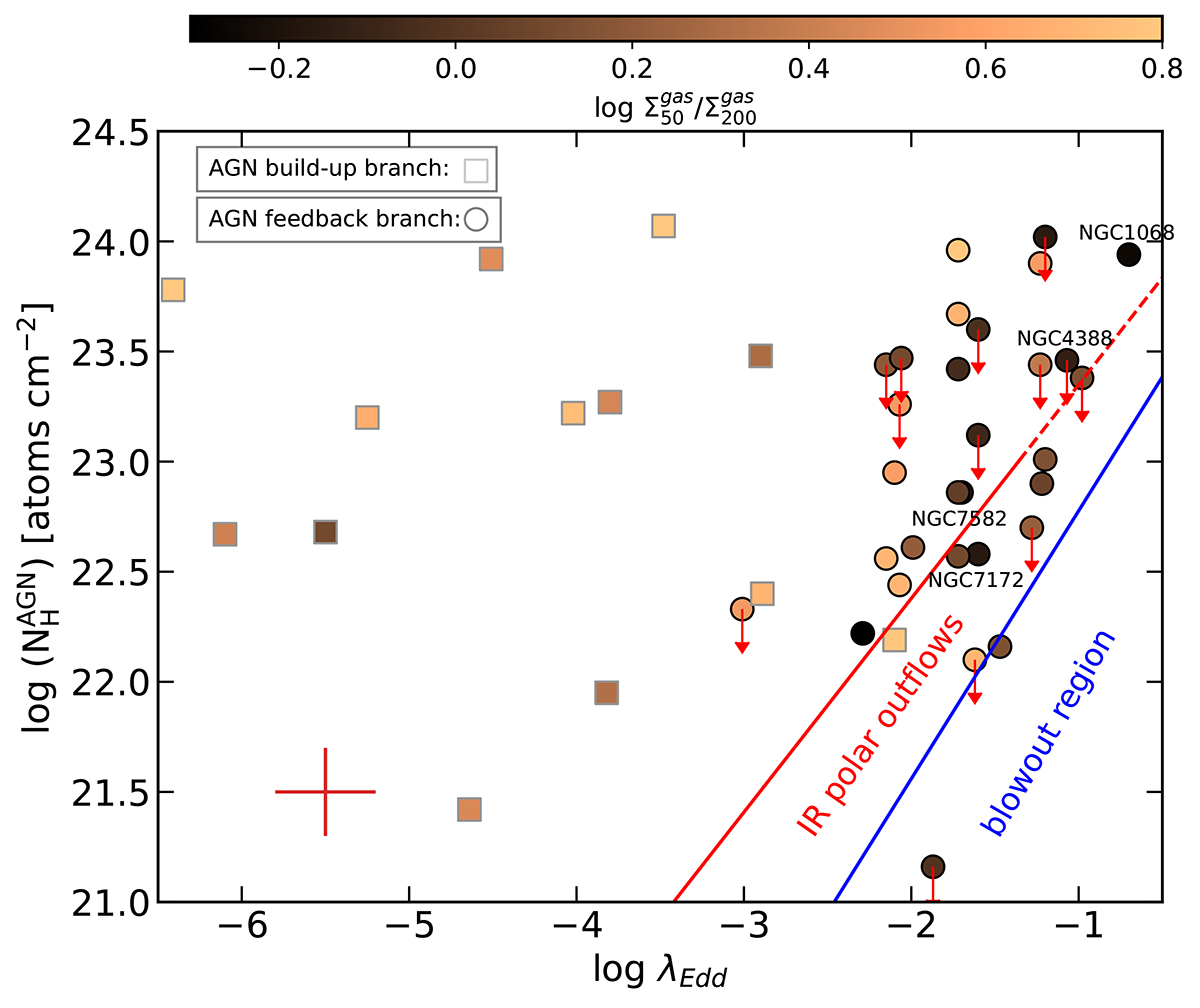
Diagram showing the hydrogen column densities measured towards the AGN (![]() in log units) derived from CO as a function of the Eddington ratio (λEdd in log units) for the galaxies of our sample. Galaxies belonging to the AGN feedback and build-up branches as defined in Sect. 5.1 are shown by filled circles and squares respectively. In either case symbols are color-coded in terms of the cold molecular gas concentration index (
in log units) derived from CO as a function of the Eddington ratio (λEdd in log units) for the galaxies of our sample. Galaxies belonging to the AGN feedback and build-up branches as defined in Sect. 5.1 are shown by filled circles and squares respectively. In either case symbols are color-coded in terms of the cold molecular gas concentration index (![]() ). The region below the blue solid curve defines the conditions conducive to the blowout of nuclear regions as defined by Fabian et al. (2008). The region below the red line defines the conditions conducive to the launching of IR dusty outflows according to Venanzi et al. (2020). See also discussion in Alonso-Herrero et al. (2021) and García-Bernete et al. (2022). We identify in the diagram the location of the four AGN feedback branch sources NGC 1068, NGC 4388, NGC 7172, and NGC 7582 discussed in Sect. 8. Red arrows identify upper limits.
). The region below the blue solid curve defines the conditions conducive to the blowout of nuclear regions as defined by Fabian et al. (2008). The region below the red line defines the conditions conducive to the launching of IR dusty outflows according to Venanzi et al. (2020). See also discussion in Alonso-Herrero et al. (2021) and García-Bernete et al. (2022). We identify in the diagram the location of the four AGN feedback branch sources NGC 1068, NGC 4388, NGC 7172, and NGC 7582 discussed in Sect. 8. Red arrows identify upper limits.
Current usage metrics show cumulative count of Article Views (full-text article views including HTML views, PDF and ePub downloads, according to the available data) and Abstracts Views on Vision4Press platform.
Data correspond to usage on the plateform after 2015. The current usage metrics is available 48-96 hours after online publication and is updated daily on week days.
Initial download of the metrics may take a while.