Fig. 9.
Download original image
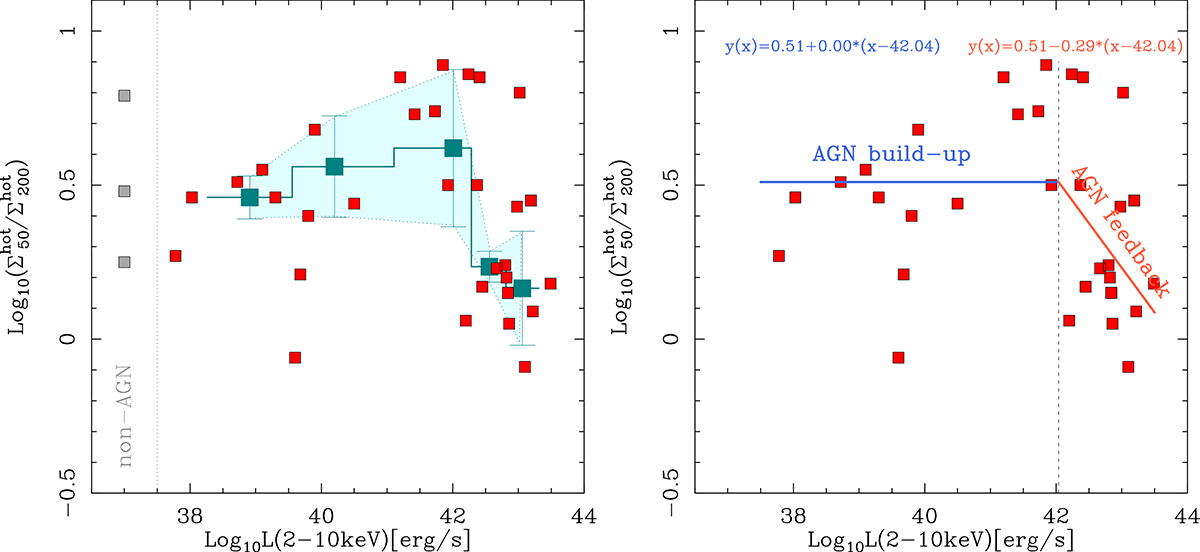
Distribution of “hot” molecular gas. Left panel: Same as the left panel of Fig. 2 but showing the change with LX of the concentration of “hot” molecular gas measured for the central regions of the galaxies in our sample derived from the ratio (in log units) of the average H2 surface densities estimated from the 2.1 μm line emission at two spatial scales: r ≤ 50 pc (![]() ) and r ≤ 200 pc (
) and r ≤ 200 pc (![]() ). The small (red) squares represent the individual galaxy measurements for AGN in the sample. Concentration indices for the three nonAGN targets are displayed as (gray) square symbols at log(LX) = 37 erg s−1. The large (green) squares show the median value of the concentration index estimated for the five LX bins that cover the range of AGN luminosities spanned by our sample, as defined in Sect. 6.1. Symbols for error bars are as in Fig. 2. Right panel: Same as the left panel but showing the two-branch linear solution found by the MARS algorithm to fit the distribution of concentration indices of “hot” molecular gas as a function of LX for the AGN build-up phase (blue straight line) and the AGN feedback phase (red straight line).
). The small (red) squares represent the individual galaxy measurements for AGN in the sample. Concentration indices for the three nonAGN targets are displayed as (gray) square symbols at log(LX) = 37 erg s−1. The large (green) squares show the median value of the concentration index estimated for the five LX bins that cover the range of AGN luminosities spanned by our sample, as defined in Sect. 6.1. Symbols for error bars are as in Fig. 2. Right panel: Same as the left panel but showing the two-branch linear solution found by the MARS algorithm to fit the distribution of concentration indices of “hot” molecular gas as a function of LX for the AGN build-up phase (blue straight line) and the AGN feedback phase (red straight line).
Current usage metrics show cumulative count of Article Views (full-text article views including HTML views, PDF and ePub downloads, according to the available data) and Abstracts Views on Vision4Press platform.
Data correspond to usage on the plateform after 2015. The current usage metrics is available 48-96 hours after online publication and is updated daily on week days.
Initial download of the metrics may take a while.