Fig. 14.
Download original image
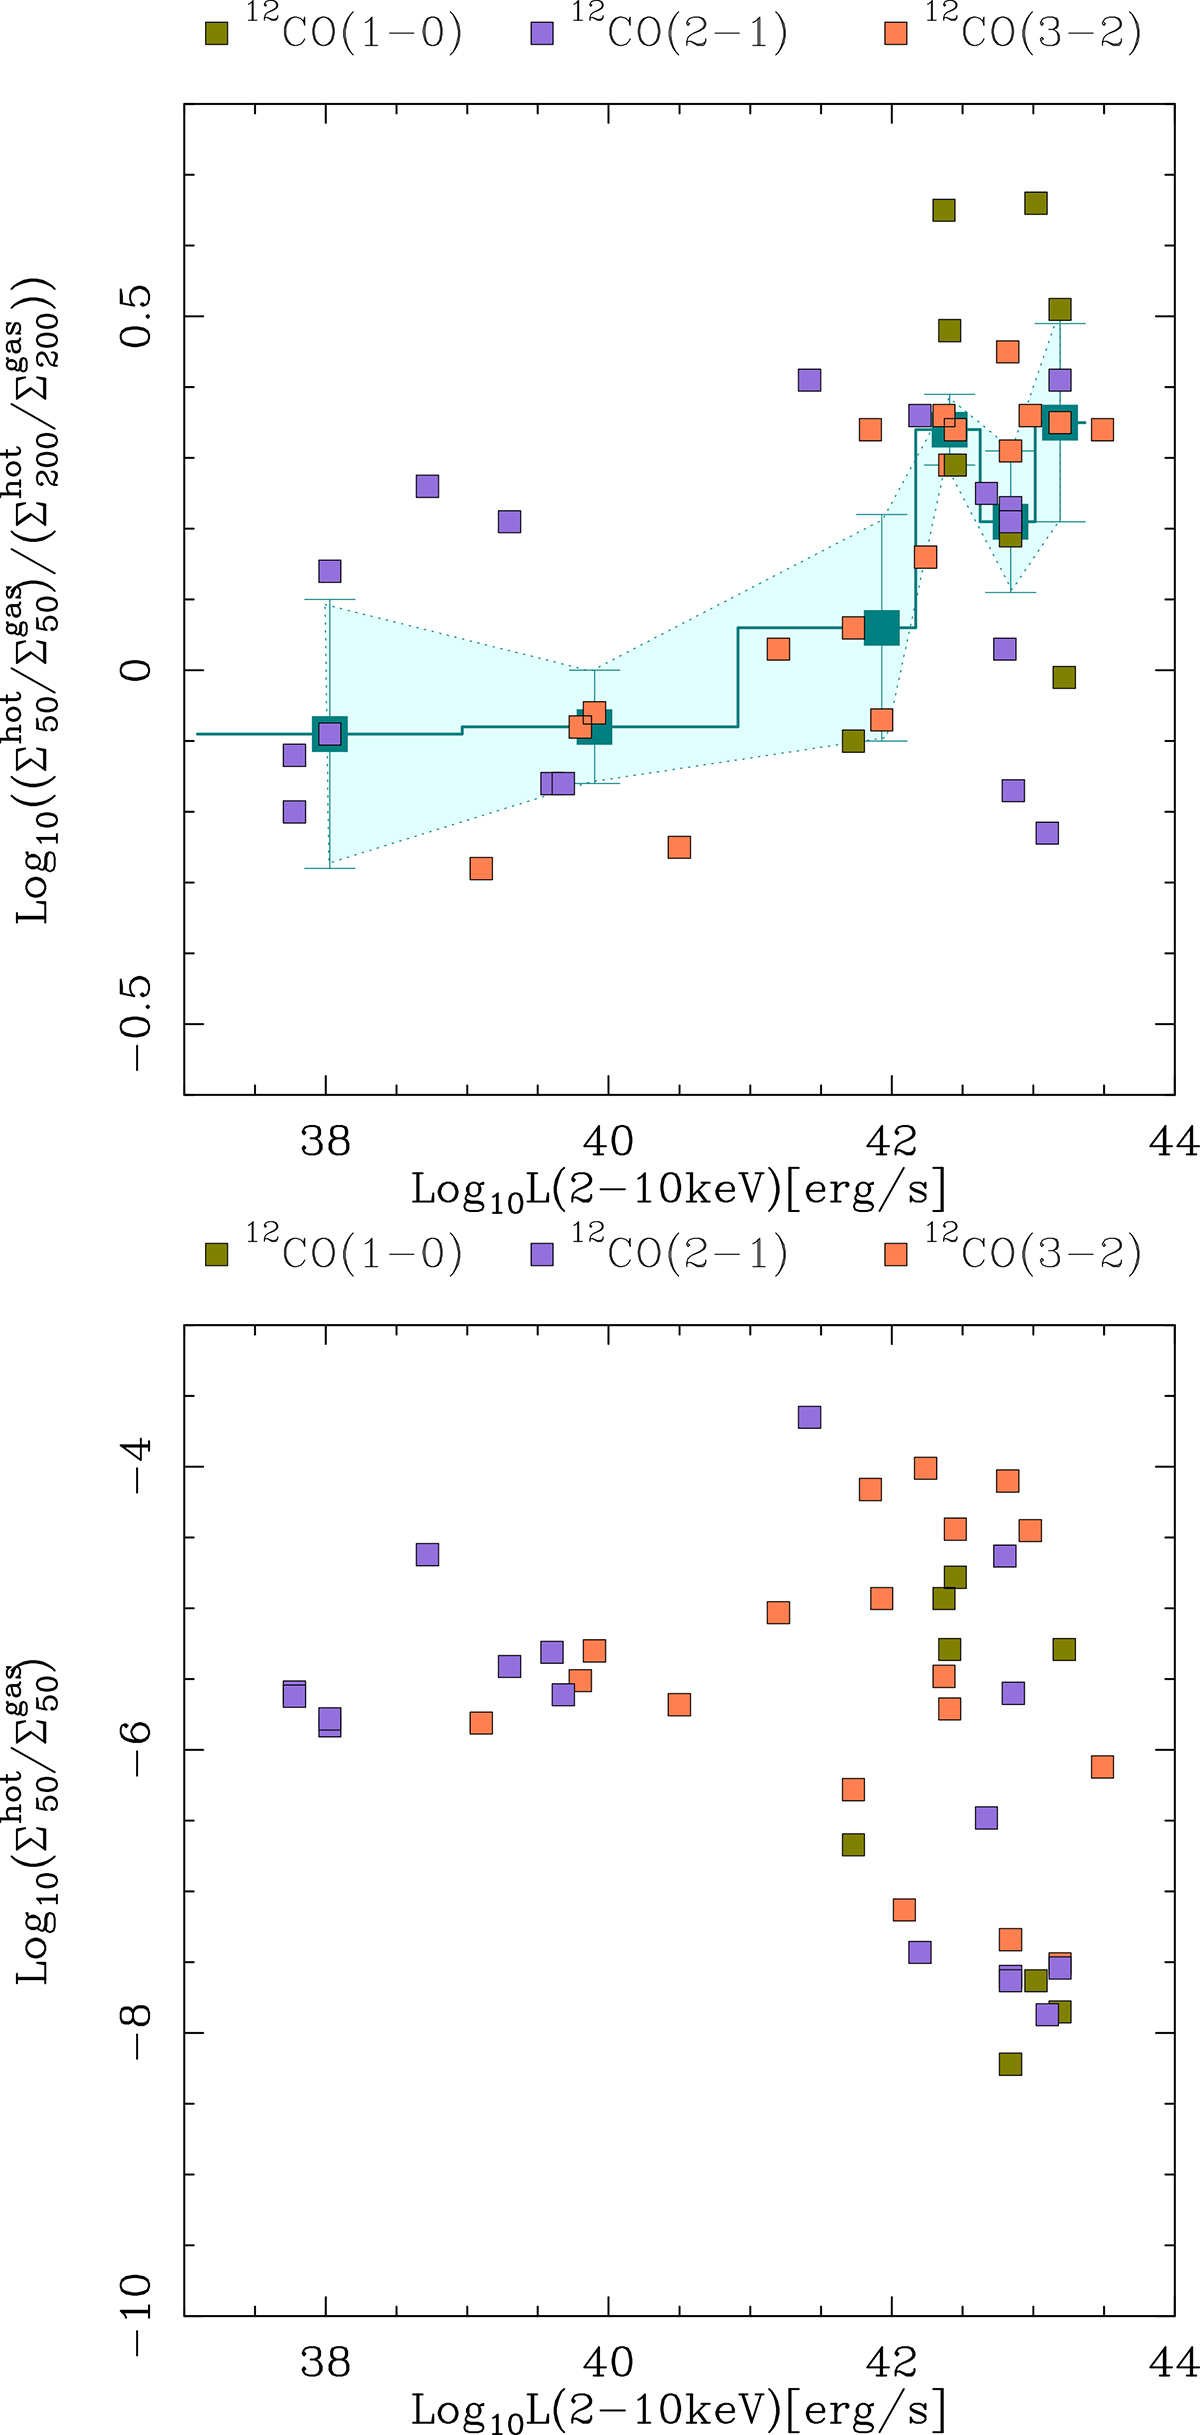
Hot-to-cold gas mass ratios. Upper panel: Change of the ratio (in log units) of the hot-to-cold molecular gas mass surface density ratios with LX estimated from the CO and 2.1 μm line emissions at the two spatial scales analyzed in this work: r ≤ 50 pc (![]() /
/![]() ) and r ≤ 200 pc (
) and r ≤ 200 pc (![]() /
/![]() ). Lower panel: Hot-to-cold molecular gas mass surface density ratio measured at r ≤ 50 pc as a function of LX. All symbols as in Fig. 2.
). Lower panel: Hot-to-cold molecular gas mass surface density ratio measured at r ≤ 50 pc as a function of LX. All symbols as in Fig. 2.
Current usage metrics show cumulative count of Article Views (full-text article views including HTML views, PDF and ePub downloads, according to the available data) and Abstracts Views on Vision4Press platform.
Data correspond to usage on the plateform after 2015. The current usage metrics is available 48-96 hours after online publication and is updated daily on week days.
Initial download of the metrics may take a while.