Fig. 8.
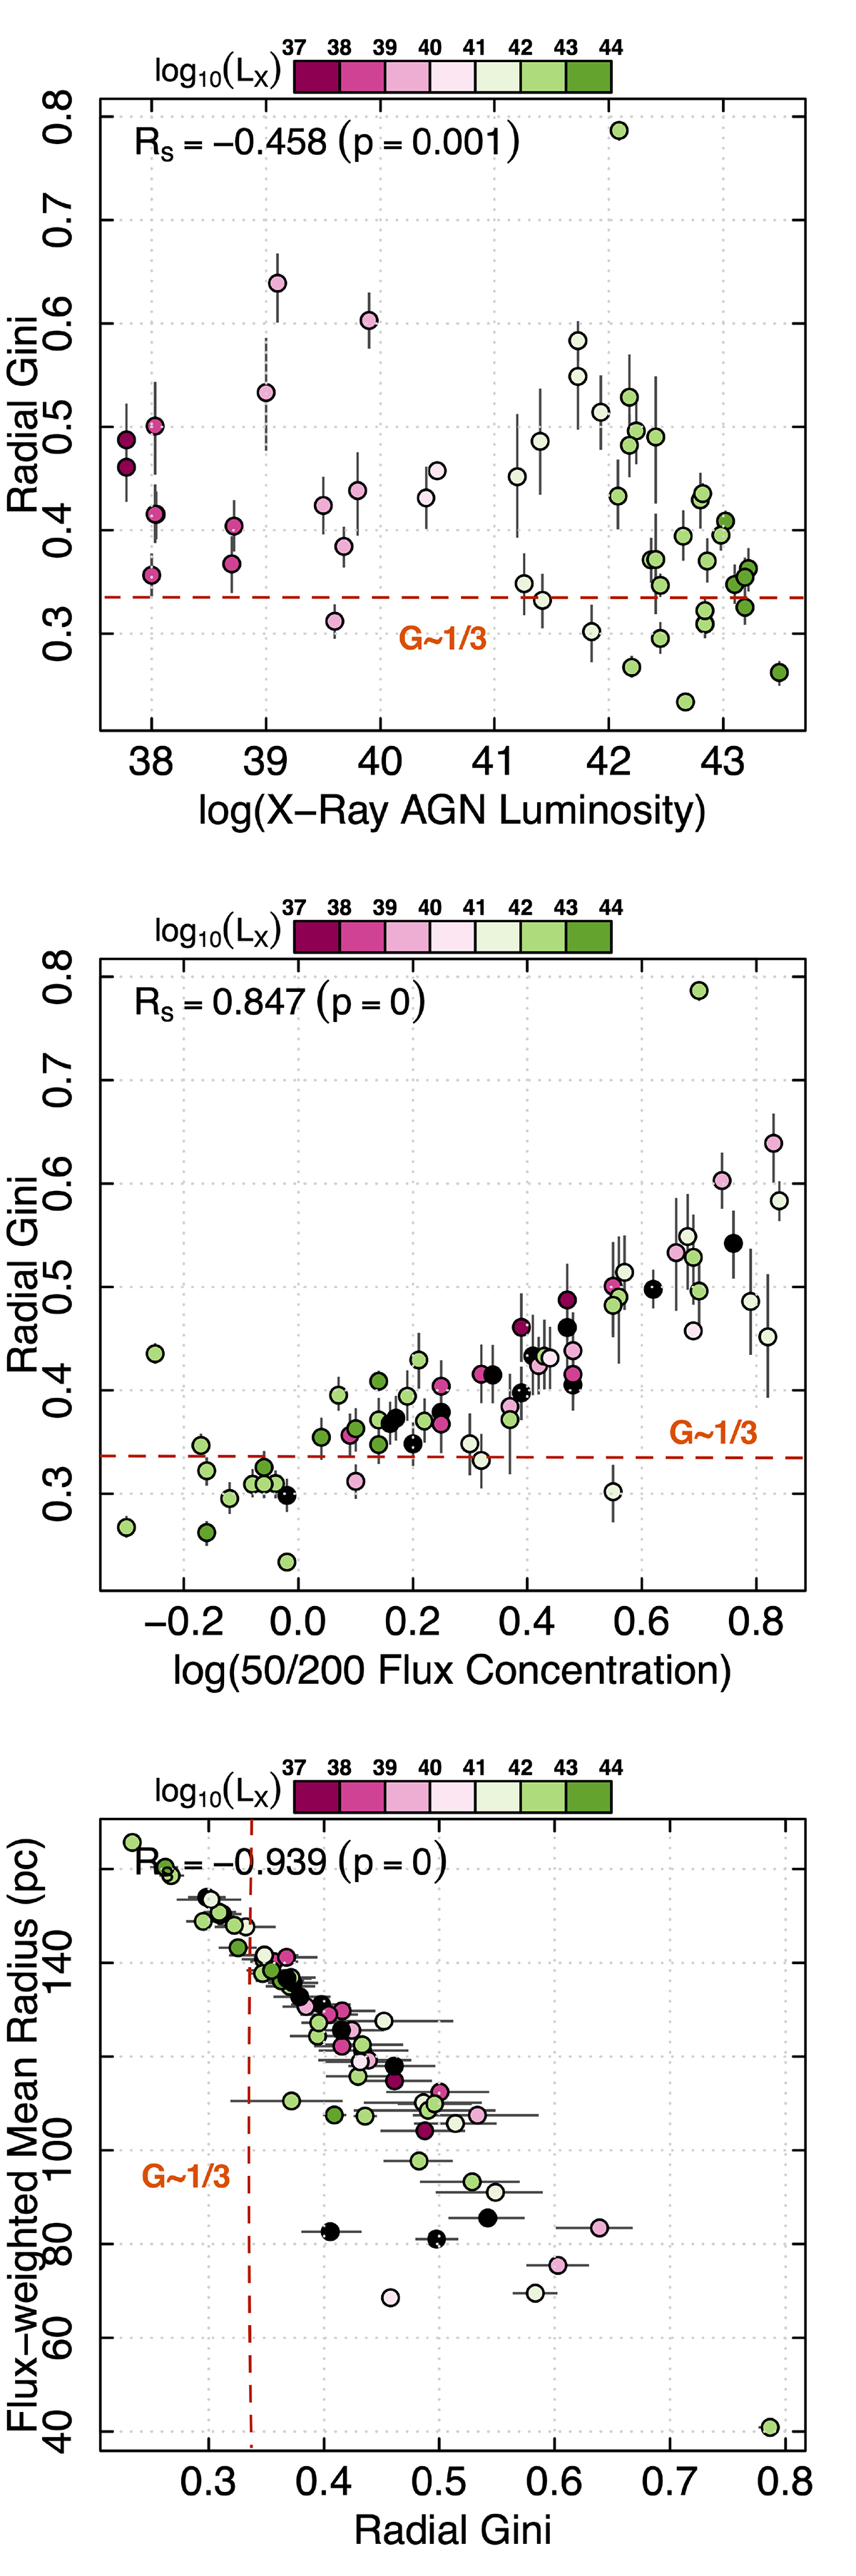
Download original image
Gini coefficients derived for the radial profiles obtained from the CO distributions in the galaxies of the sample as a function of LX (upper panel) and the concentration index of cold molecular gas (middle panel). Flux-weighted mean radii of the normalized distribution of cold molecular gas as a function of the Gini coefficients of the radial profiles derived for the galaxies of our sample (lower panel). Error bars account for the estimated uncertainties on the Gini coefficients. We indicate the estimated correlation coefficients (Rs) and their associated p-values for the three distributions. Gini coefficient values are color-coded as a function of LX (black indicates nonAGN galaxies).
Current usage metrics show cumulative count of Article Views (full-text article views including HTML views, PDF and ePub downloads, according to the available data) and Abstracts Views on Vision4Press platform.
Data correspond to usage on the plateform after 2015. The current usage metrics is available 48-96 hours after online publication and is updated daily on week days.
Initial download of the metrics may take a while.