Fig. 11.
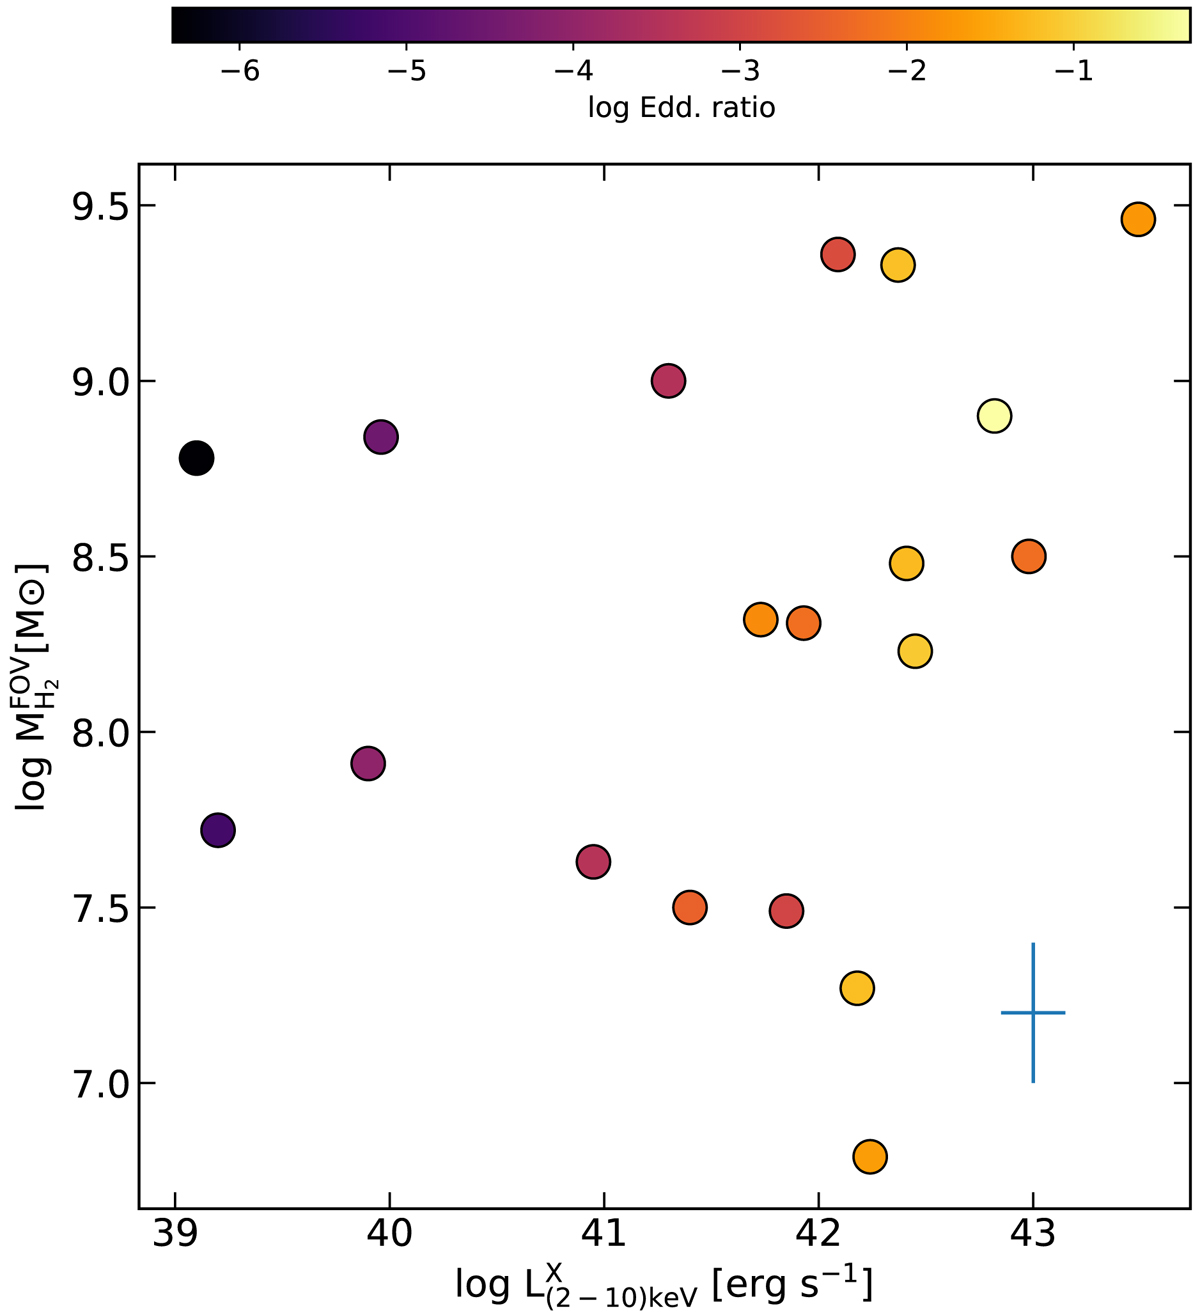
Molecular gas mass detected inside the 17″-FOV of the ALMA CO(3–2) images of the GATOS and NUGA galaxies as a function of the intrinsic AGN luminosities measured in the 2–10 keV band for the galaxies of our combined sample. The regions mapped by ALMA span the central r ≤ 0.4 − 1.2 kpc. Symbols are color-coded as a function of the Eddington ratio of the sample galaxies. Errorbars account for the range of uncertainties on the molecular gas mass estimates, due to the assumed CO-to-H2 and 3–2/1–0 conversion factors (∼±0.2 dex), and on the AGN luminosities (∼±0.15 dex).
Current usage metrics show cumulative count of Article Views (full-text article views including HTML views, PDF and ePub downloads, according to the available data) and Abstracts Views on Vision4Press platform.
Data correspond to usage on the plateform after 2015. The current usage metrics is available 48-96 hours after online publication and is updated daily on week days.
Initial download of the metrics may take a while.