Fig. 14.
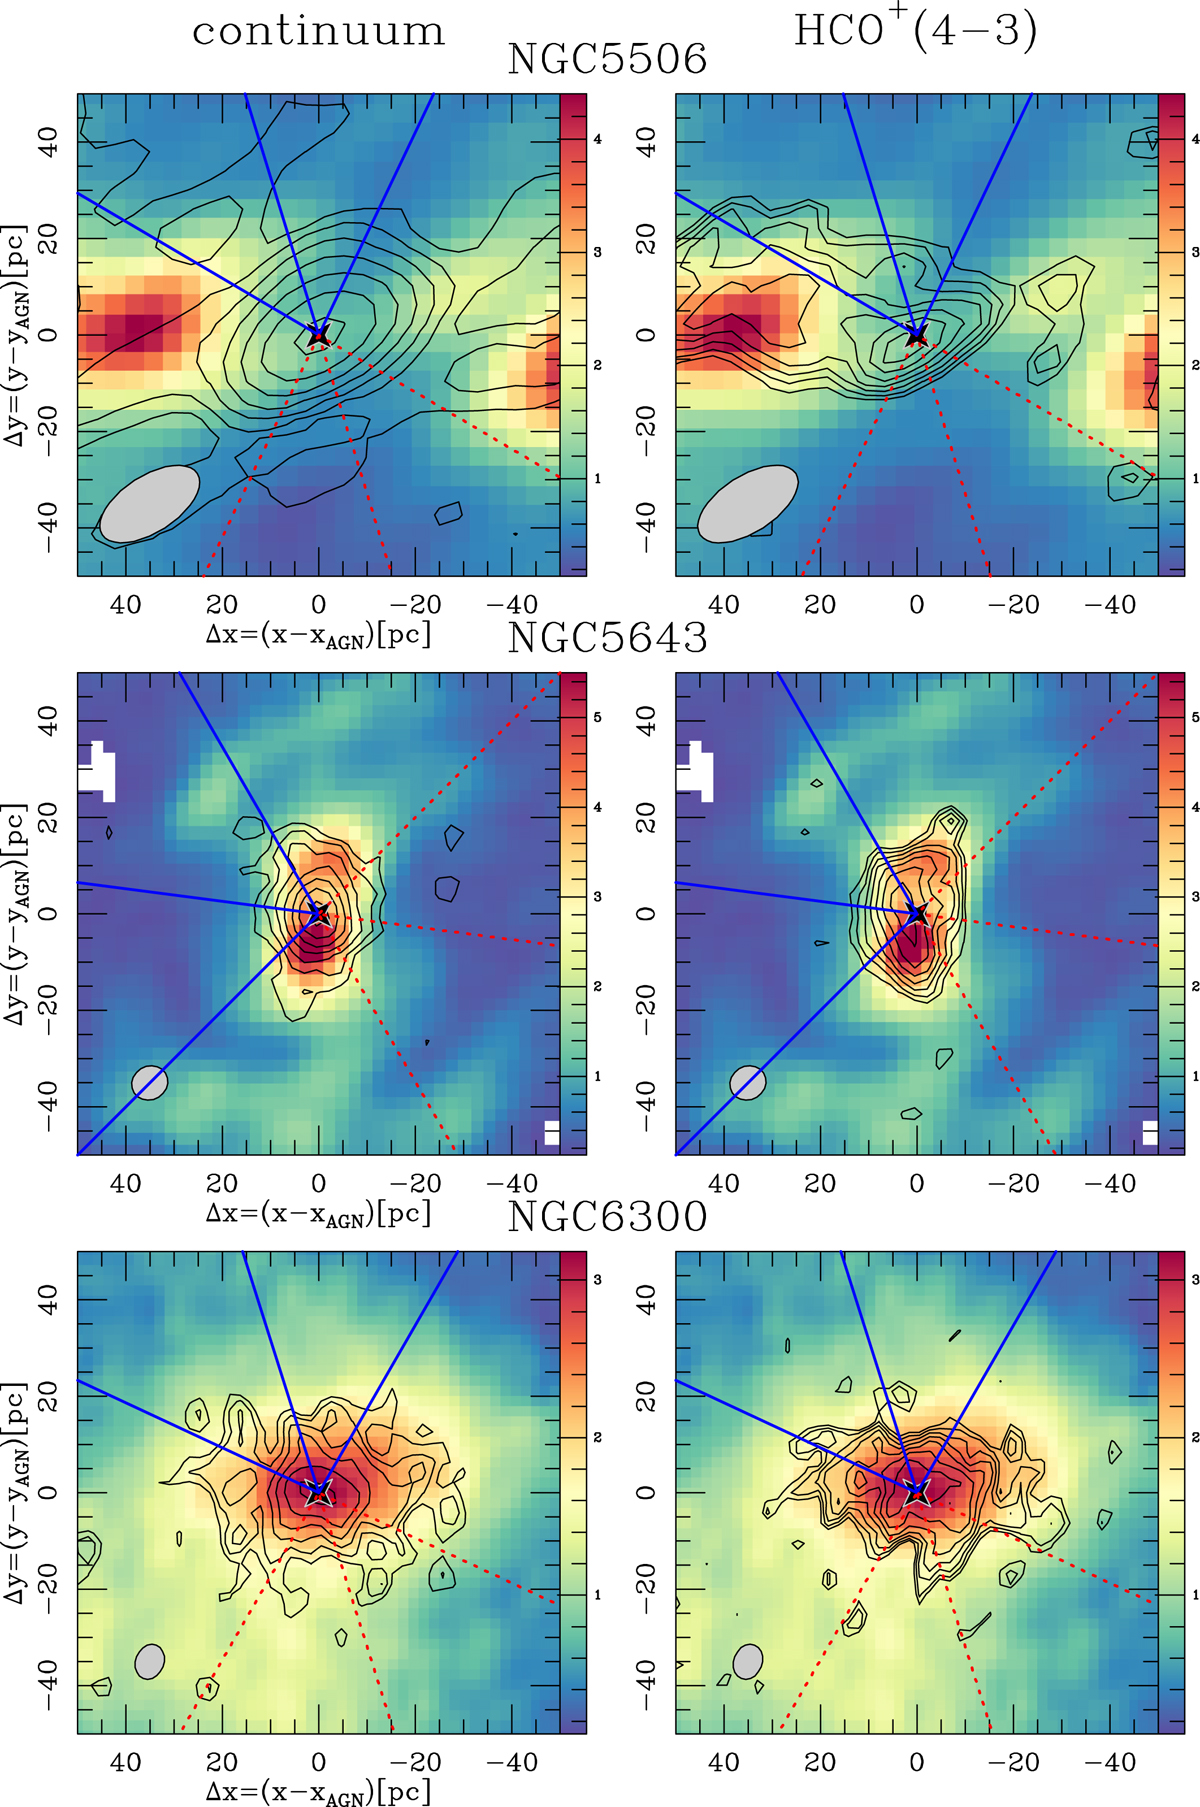
Left panels: overlay of the continuum emission (Icont; contours) on the velocity-integrated CO(3–2) maps (ICO; linear color scale) of the central Δx × Δy = 100 pc × 100 pc regions of NGC 5506, NGC 5643, and NGC 6300, derived from their ALMA HSR datasets. Color scale spans the range [3σCO, ![]() ] in units of Jy km s−1. Contour levels have a logarithmic spacing from 3σco to 90% of the peak continuum inside the displayed field-of-view (
] in units of Jy km s−1. Contour levels have a logarithmic spacing from 3σco to 90% of the peak continuum inside the displayed field-of-view (![]() ) in steps of ∼0.18 dex on average. Right panels: same as left panels but showing the overlay of the velocity-integrated HCO+(4–3) contours (IHCO+) on the CO(3–2) maps. Contour levels have a logarithmic spacing from 3σHCO+ to 90% of the peak HCO+ intensity (
) in steps of ∼0.18 dex on average. Right panels: same as left panels but showing the overlay of the velocity-integrated HCO+(4–3) contours (IHCO+) on the CO(3–2) maps. Contour levels have a logarithmic spacing from 3σHCO+ to 90% of the peak HCO+ intensity (![]() ) in steps of ∼0.08 dex on average. Markers and lines are as defined in Fig. 13.
) in steps of ∼0.08 dex on average. Markers and lines are as defined in Fig. 13.
Current usage metrics show cumulative count of Article Views (full-text article views including HTML views, PDF and ePub downloads, according to the available data) and Abstracts Views on Vision4Press platform.
Data correspond to usage on the plateform after 2015. The current usage metrics is available 48-96 hours after online publication and is updated daily on week days.
Initial download of the metrics may take a while.