Fig. 10.
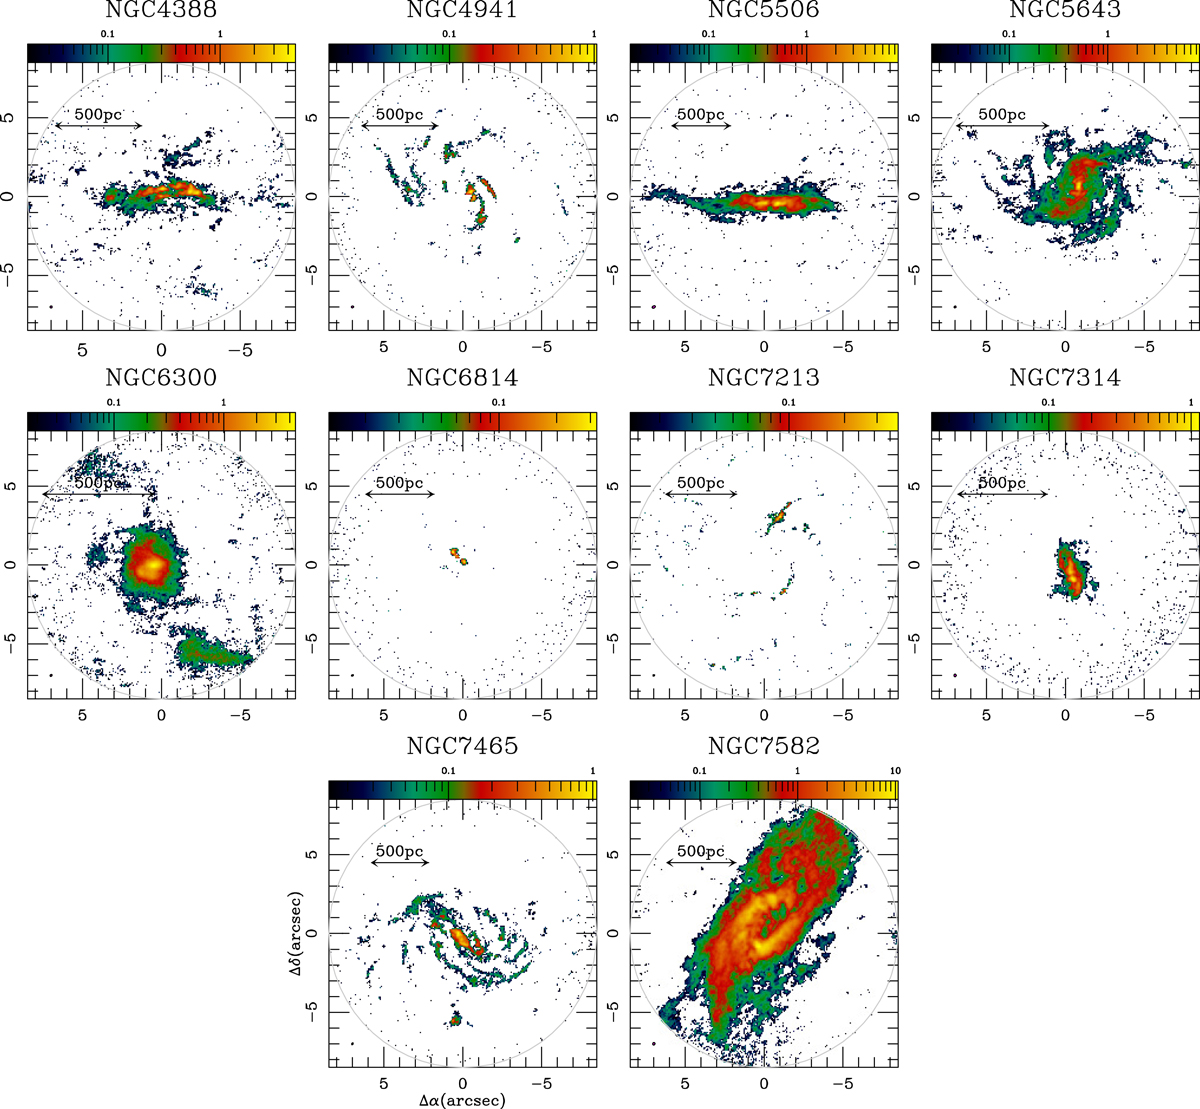
Primary-beam corrected velocity-integrated intensity maps of the 3–2 line of CO (ICO) inside the 17″ ALMA field-of-view (FOV; represented by the gray circle) for the galaxies of the core sample of GATOS. Maps were derived using a 3σ clipping. Intensities are expressed in Jy km s−1-units using a logarithmic (color) scale. (Δα, Δδ)-offsets are relative to the phase tracking centers used during the observations, listed in Table 1. Filled-ellipses at the bottom left corners identify the sizes of the ALMA beams.
Current usage metrics show cumulative count of Article Views (full-text article views including HTML views, PDF and ePub downloads, according to the available data) and Abstracts Views on Vision4Press platform.
Data correspond to usage on the plateform after 2015. The current usage metrics is available 48-96 hours after online publication and is updated daily on week days.
Initial download of the metrics may take a while.