Fig. 20.
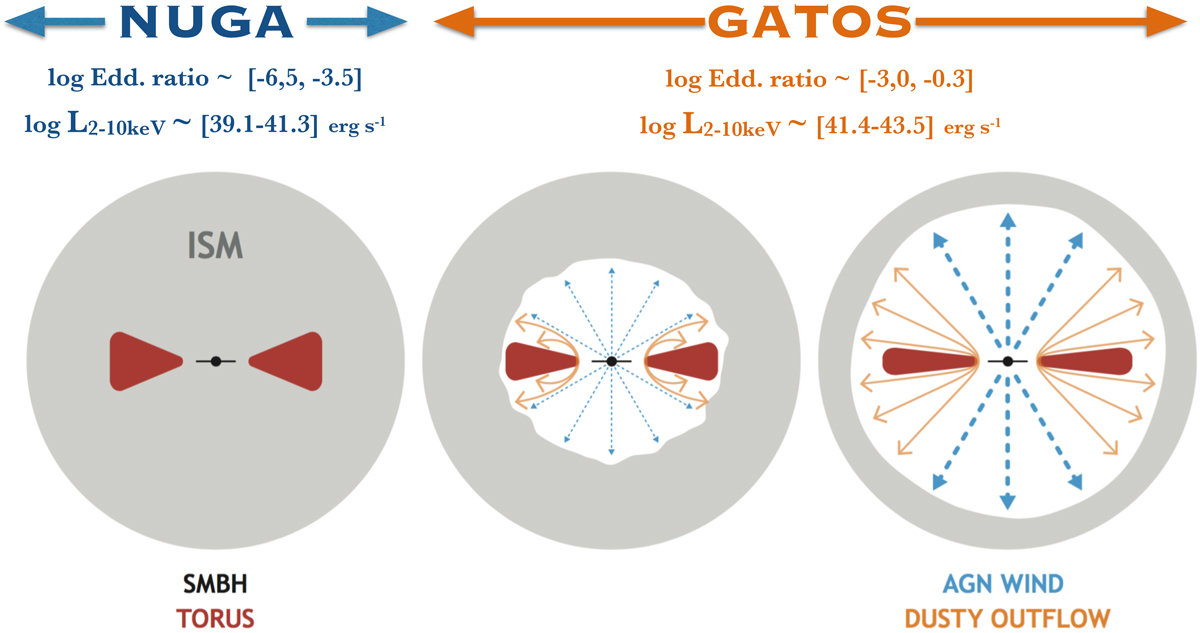
Cartoon illustrating the different nuclear and circumnuclear environments of the NUGA and GATOS sources analyzed in this paper. The figure is a (not to scale) simplified sketch of the CND around the SMBH of a Seyfert galaxy representative of the NUGA (left panel) and GATOS samples (middle and right panels). These samples are characterized by different Eddington ratios and AGN luminosities (NUGA: Eddington ratios∼10−6.5–10−3.5 and LAGN(2–10 keV) ∼ 1039.1 − 41.3 erg s−1; GATOS: Eddington ratios∼10−3.0–10−0.3 and LAGN(2–10 keV) ∼ 1041.4 − 43.5 erg s−1). Based on the monotonic trends of Fig. 18, we distinguish between the typical environment of the highest luminosity and highest Eddington ratio GATOS Seyferts (right panel, well represented by sources like NGC 1068, and an intermediate case between NUGA and the most extreme GATOS Seyferts (middle panel), well represented by sources like NGC 5643. The imprint left by AGN winds on the distribution of molecular gas in the torus and its surroundings through the launching of dusty winds, and by the impact of AGN winds on the ISM at larger radii (ISM in the figure), is seen to be more extreme in the higher luminosity and higher Eddington ratio sources.
Current usage metrics show cumulative count of Article Views (full-text article views including HTML views, PDF and ePub downloads, according to the available data) and Abstracts Views on Vision4Press platform.
Data correspond to usage on the plateform after 2015. The current usage metrics is available 48-96 hours after online publication and is updated daily on week days.
Initial download of the metrics may take a while.