Fig. 2.
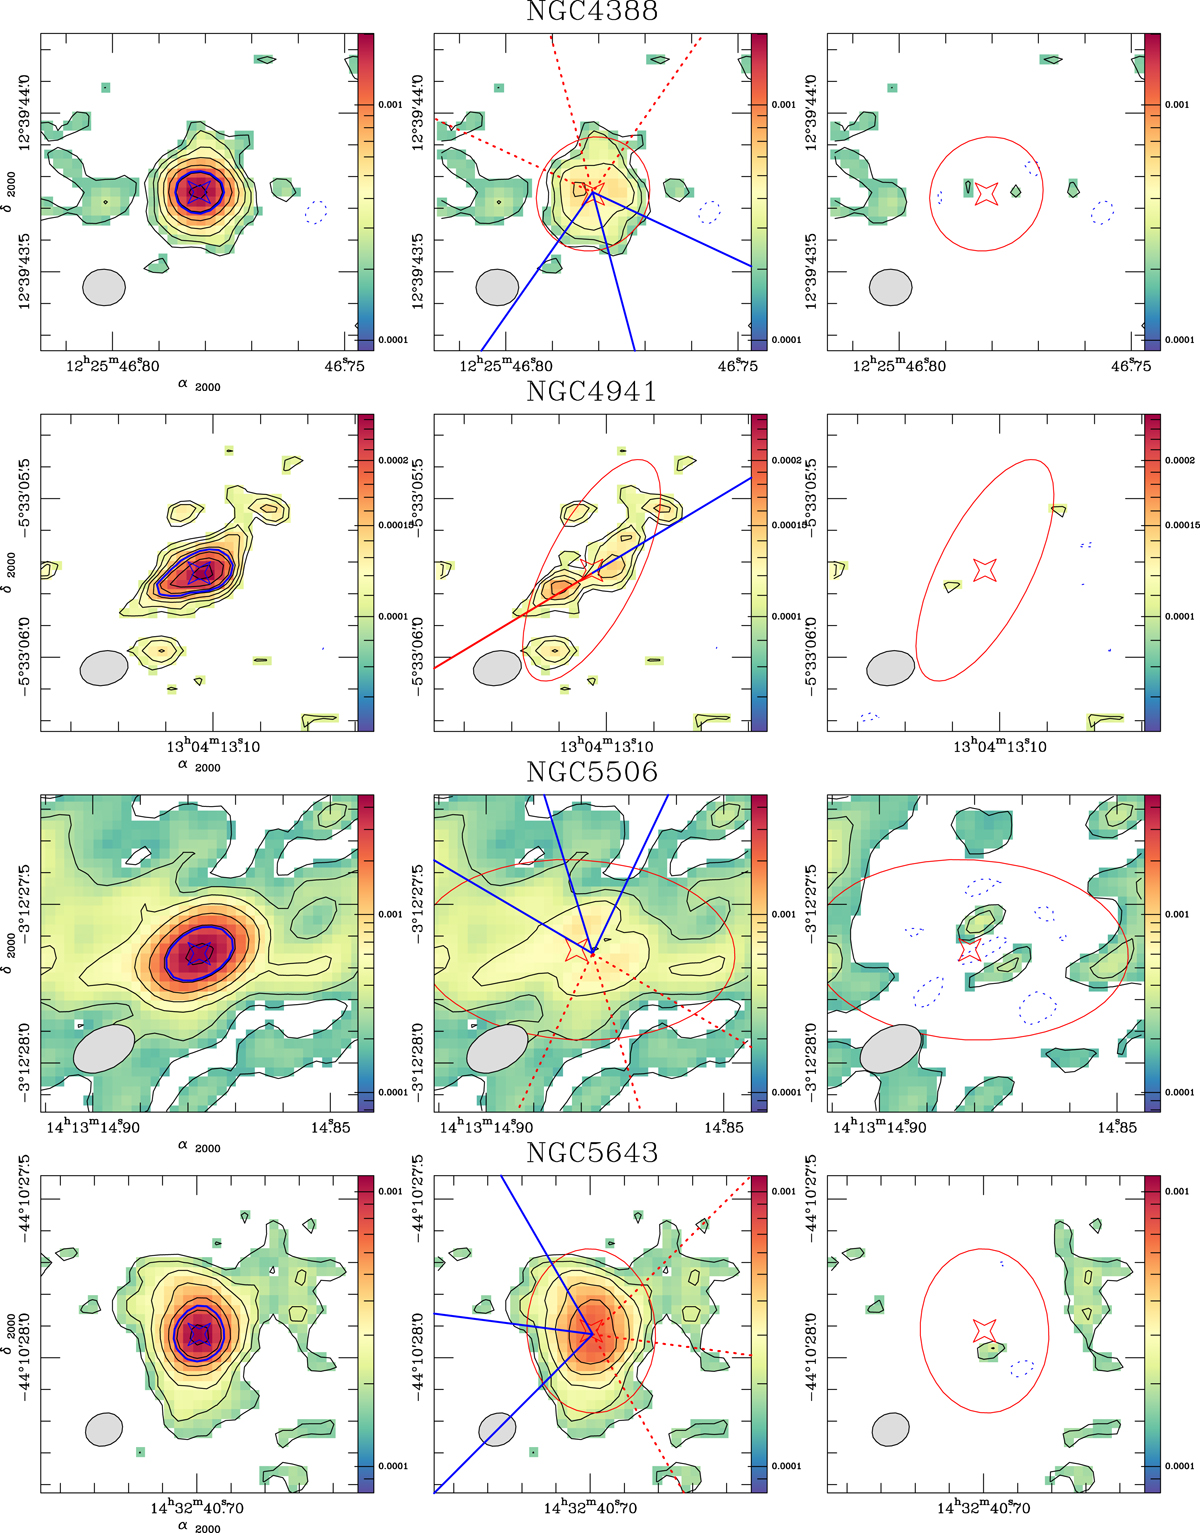
Left panels: continuum emission at the (rest) frequency range 350.6–351.1 GHz (Icont) in the central Δα × Δδ = 1″ × 1″ regions of NGC 4388, NGC 4941, NGC 5506, and NGC 5643, obtained from the ALMA MSR datasets. The AGN positions, identified by the blue star markers, correspond to the location of the point sources determined by the two-component fit to the continuum emission described in Sect. 4. The continuum maps are shown in color scale and (black) contour levels with a logarithmic spacing from −2.5σcont(dashed blue), 2.5σcont to 90% of the peak intensity (![]() in Jy beam−1-units) in steps of ∼0.18 dex on average. The (thick blue) contour corresponds to
in Jy beam−1-units) in steps of ∼0.18 dex on average. The (thick blue) contour corresponds to ![]() . The values of σcont and the parameters of the two-component fit for each galaxy are listed in Tables 2 and 3. Middle panels: same as left panels but after subtraction of the fitted point source. The (red) ellipses identify the Gaussian source fitted to the extended emission centered around the position of the red star markers. The lines highlight both the orientation (major axis) and the extent (opening angle) of the ionized winds identified in the literature for the targets (see Appendix A), except for NGC 4941 and NGC 7213, where there is only an estimate for the orientation (major axis) of the wind. Lines are color-coded to reflect whether the measured velocities of the ionized wind lobes are either redshifted or blueshifted. Dashed lines indicate that the corresponding lobe is (mostly) obscured by the disk of the host. Right panels: residuals obtained after subtraction of the sum of the point and extended sources fitted to the data. The (gray) filled ellipses at the bottom left corners in all panels represent the beam sizes of the observations listed in Table 2.
. The values of σcont and the parameters of the two-component fit for each galaxy are listed in Tables 2 and 3. Middle panels: same as left panels but after subtraction of the fitted point source. The (red) ellipses identify the Gaussian source fitted to the extended emission centered around the position of the red star markers. The lines highlight both the orientation (major axis) and the extent (opening angle) of the ionized winds identified in the literature for the targets (see Appendix A), except for NGC 4941 and NGC 7213, where there is only an estimate for the orientation (major axis) of the wind. Lines are color-coded to reflect whether the measured velocities of the ionized wind lobes are either redshifted or blueshifted. Dashed lines indicate that the corresponding lobe is (mostly) obscured by the disk of the host. Right panels: residuals obtained after subtraction of the sum of the point and extended sources fitted to the data. The (gray) filled ellipses at the bottom left corners in all panels represent the beam sizes of the observations listed in Table 2.
Current usage metrics show cumulative count of Article Views (full-text article views including HTML views, PDF and ePub downloads, according to the available data) and Abstracts Views on Vision4Press platform.
Data correspond to usage on the plateform after 2015. The current usage metrics is available 48-96 hours after online publication and is updated daily on week days.
Initial download of the metrics may take a while.