Fig. 7.
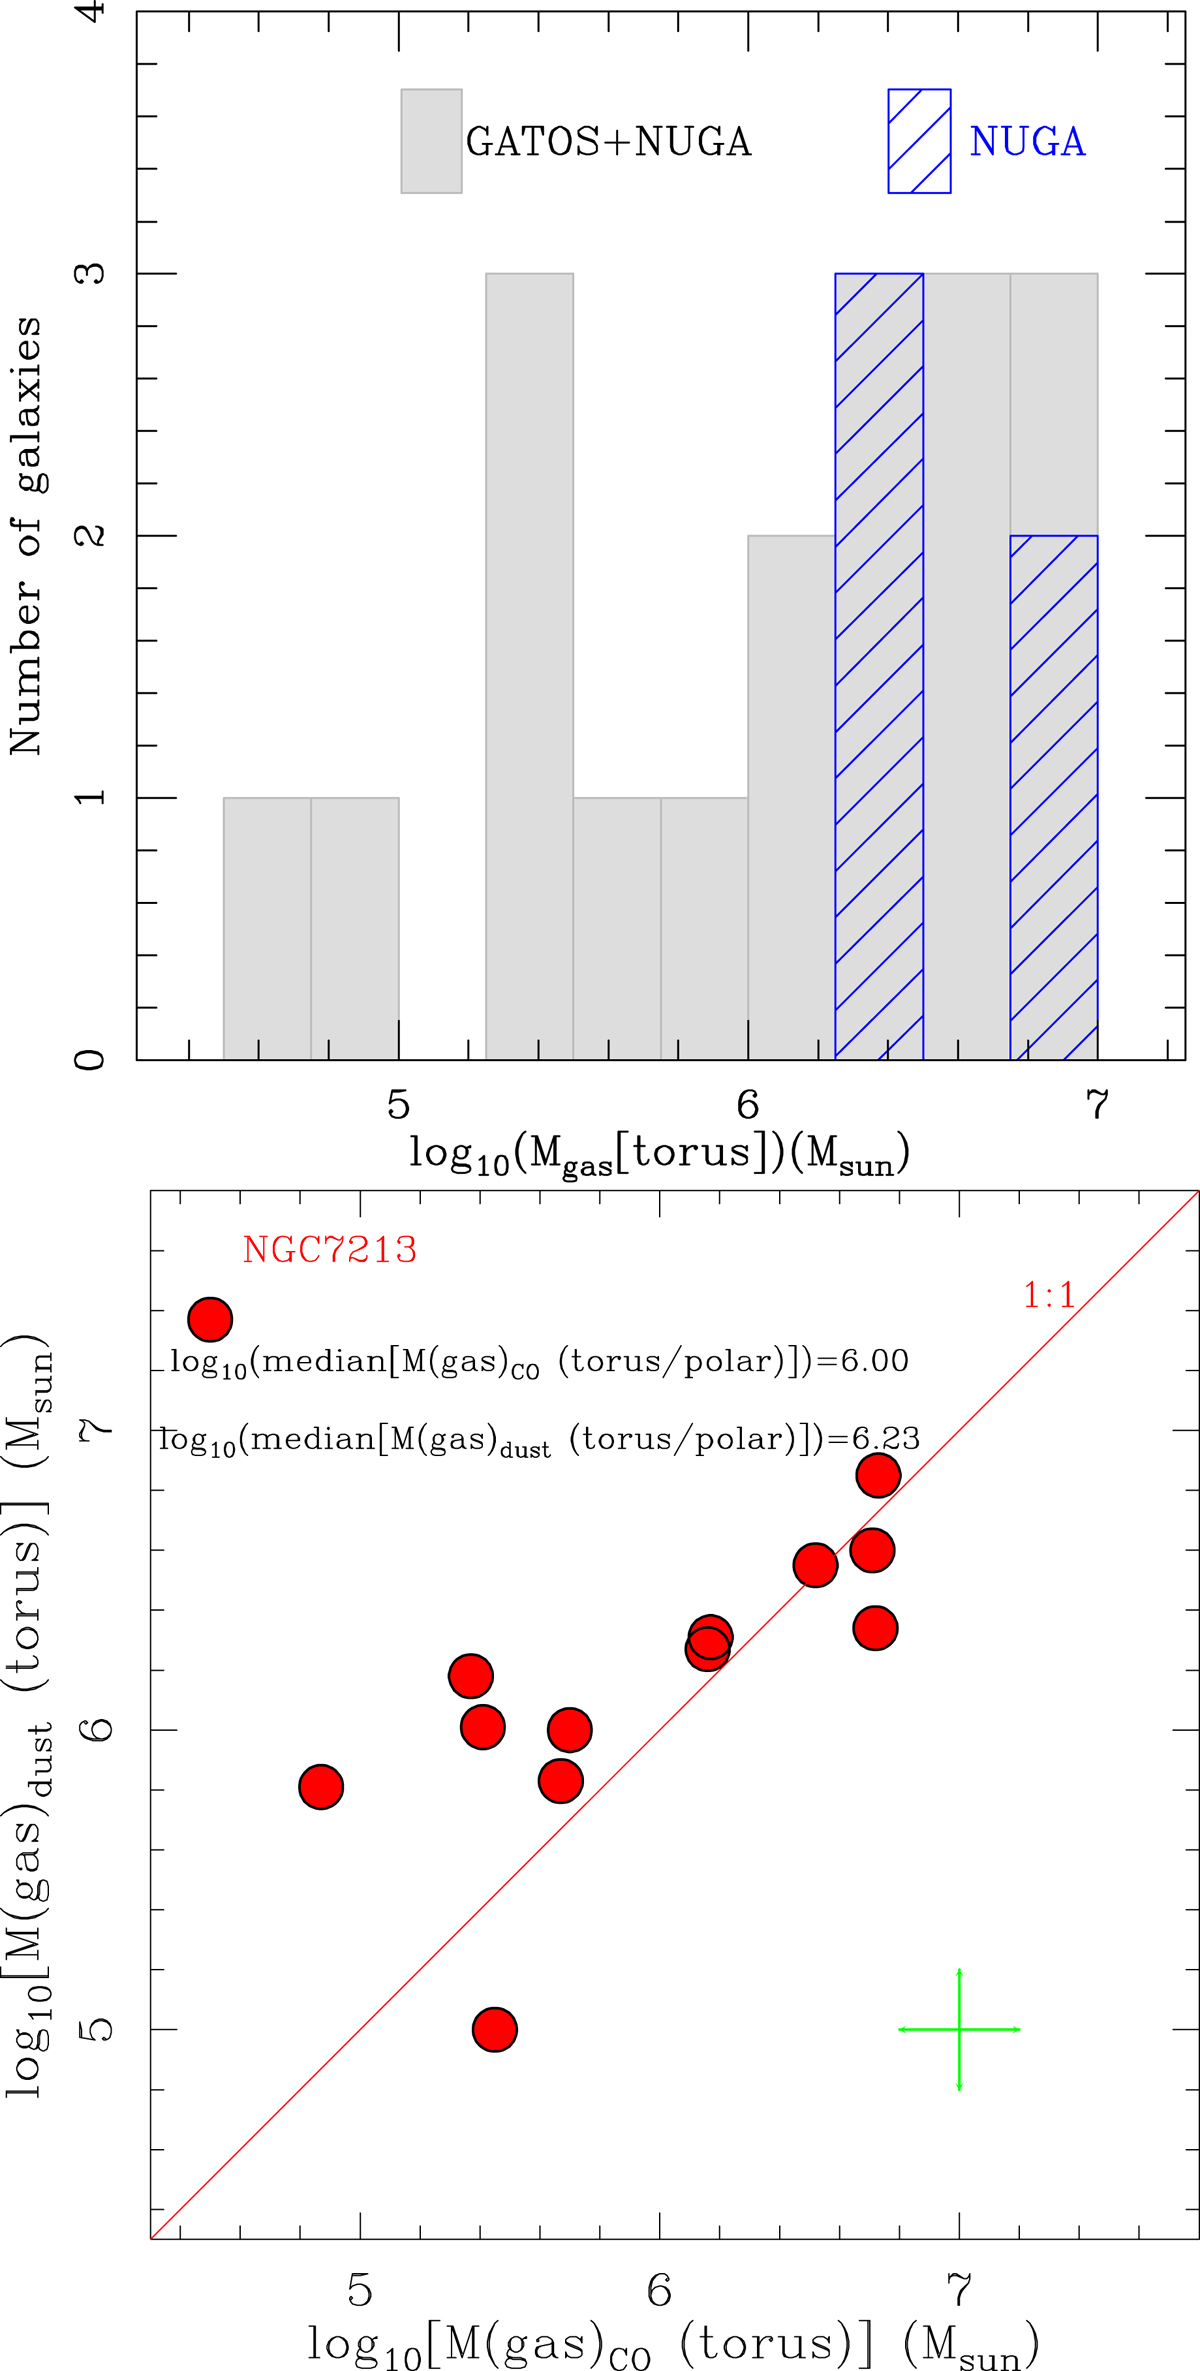
Upper panel: histograms showing the distribution of the masses of the dusty molecular tori (or polar components) derived from the combined sample of NUGA and GATOS (gray-filled histograms). We adopt for GATOS the average masses estimated from the MSR and HSR datasets. The blue-filled histogram identifies the distribution of masses of the tori derived for NUGA galaxies (Combes et al. 2019). Lower panel: comparison of the molecular gas mass derived from the CO(3–2) integrated emission and from the dust emission inside the torus (or polar) features detected by ALMA in the galaxies listed in Table 3; for this comparison the HSR dataset is used. The torus (or polar) regions are identified by the elliptical Gaussians fit to the extended components of the continuum emission shown in Figs. 2–4, as described in Sect. 4.2. The median values of the distributions exclude NGC 7213, highlighted as an outlier. A comparison with the MSR dataset yields virtually identical results. Errorbars at the lower right corner account for an uncertainty of ±0.2 dex due to the assumed conversion factors.
Current usage metrics show cumulative count of Article Views (full-text article views including HTML views, PDF and ePub downloads, according to the available data) and Abstracts Views on Vision4Press platform.
Data correspond to usage on the plateform after 2015. The current usage metrics is available 48-96 hours after online publication and is updated daily on week days.
Initial download of the metrics may take a while.