Fig. 13.
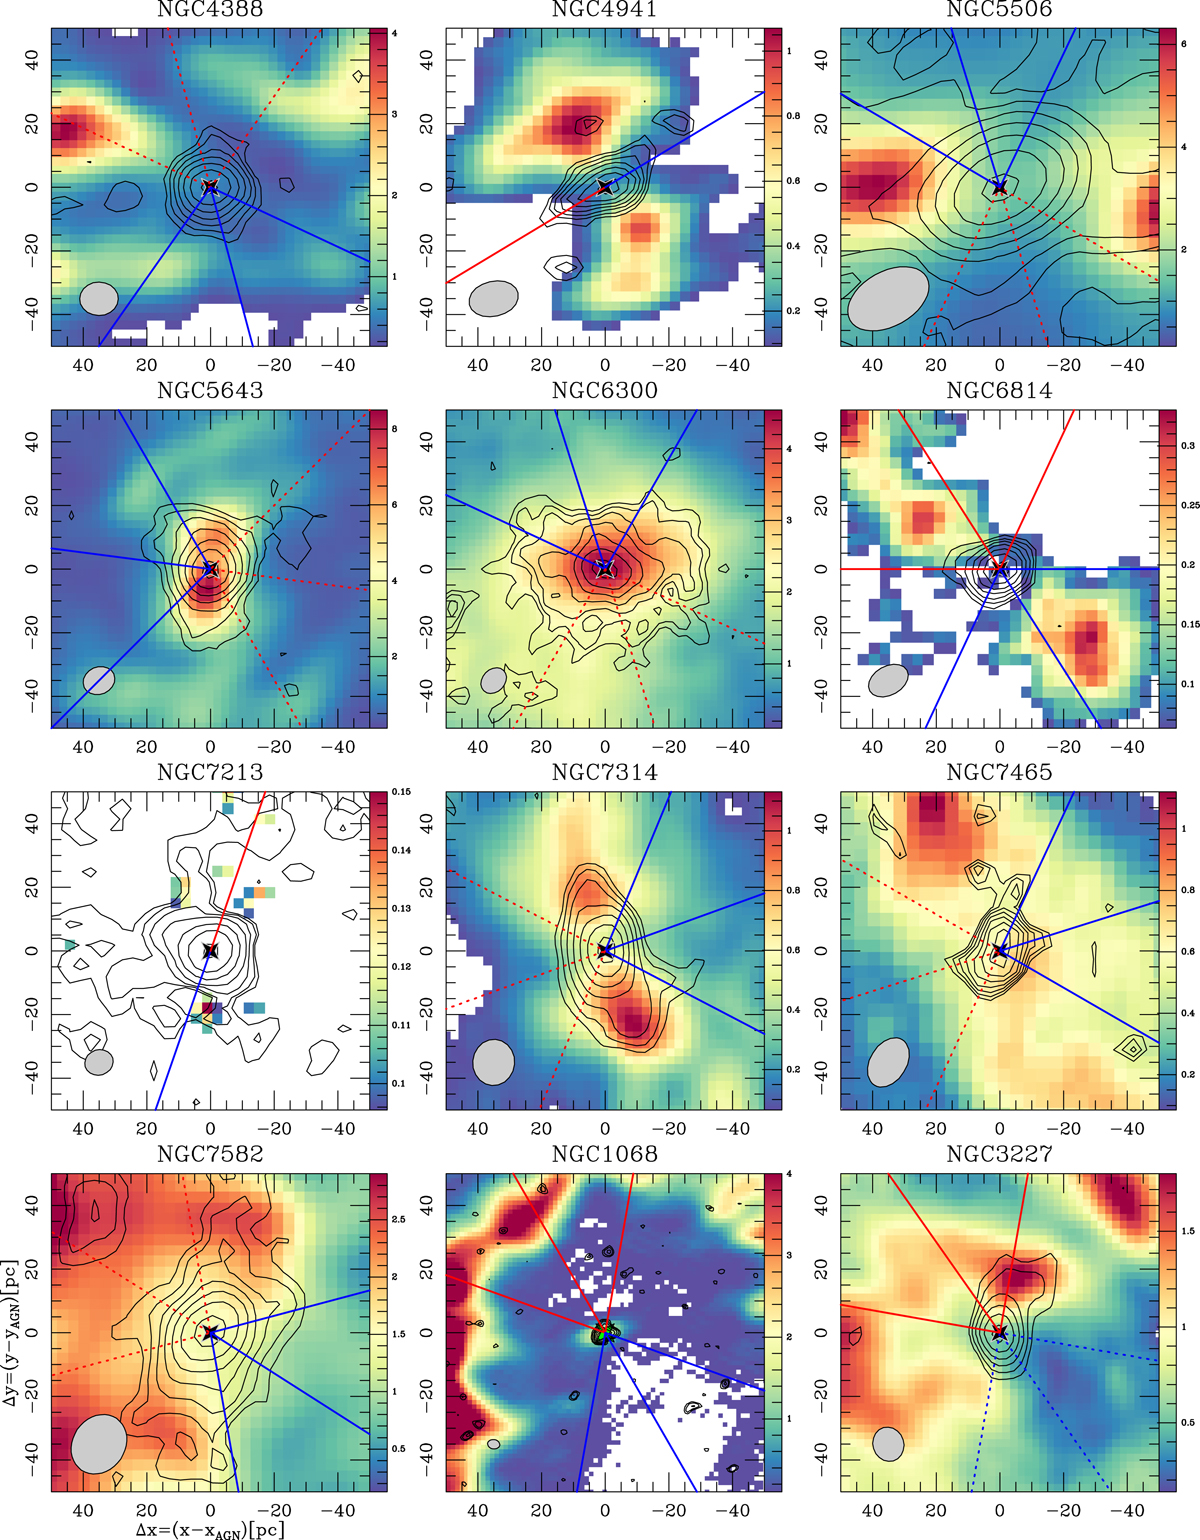
Overlay of the continuum emission, at the (rest) frequency range 350.6–351.1 GHz (Icont; contours), on the velocity-integrated CO(3–2) maps (ICO; color scale) in the central Δx × Δy = 100 pc × 100 pc regions of the core sample of GATOS galaxies. We also include the CO and continuum images of NGC 1068 (García-Burillo et al. 2019) and NGC 3227 (Alonso-Herrero et al. 2019). In NGC 1068 we use the 694 GHz continuum map of García-Burillo et al. (2016) to better identify the dusty torus. The continuum maps are shown using (black) contour levels with a logarithmic spacing from 3σcont to 90% of the peak intensity in steps of ∼0.16 dex on average. The CO(3–2) maps are displayed in (linear) color scale spanning the range [3σCO, ![]() ] in units of Jy km s−1. The values of σcont and σCO for each galaxy are listed in Table 2. The (gray) filled ellipses at the bottom left corners of the panels represent the beam sizes of the observations. The AGN positions are highlighted by the star markers. The orientation, extent, and geometry of the ionized winds are illustrated as in Figs. 2–4. All images have been obtained from the ALMA MSR datasets.
] in units of Jy km s−1. The values of σcont and σCO for each galaxy are listed in Table 2. The (gray) filled ellipses at the bottom left corners of the panels represent the beam sizes of the observations. The AGN positions are highlighted by the star markers. The orientation, extent, and geometry of the ionized winds are illustrated as in Figs. 2–4. All images have been obtained from the ALMA MSR datasets.
Current usage metrics show cumulative count of Article Views (full-text article views including HTML views, PDF and ePub downloads, according to the available data) and Abstracts Views on Vision4Press platform.
Data correspond to usage on the plateform after 2015. The current usage metrics is available 48-96 hours after online publication and is updated daily on week days.
Initial download of the metrics may take a while.