Fig. 12.
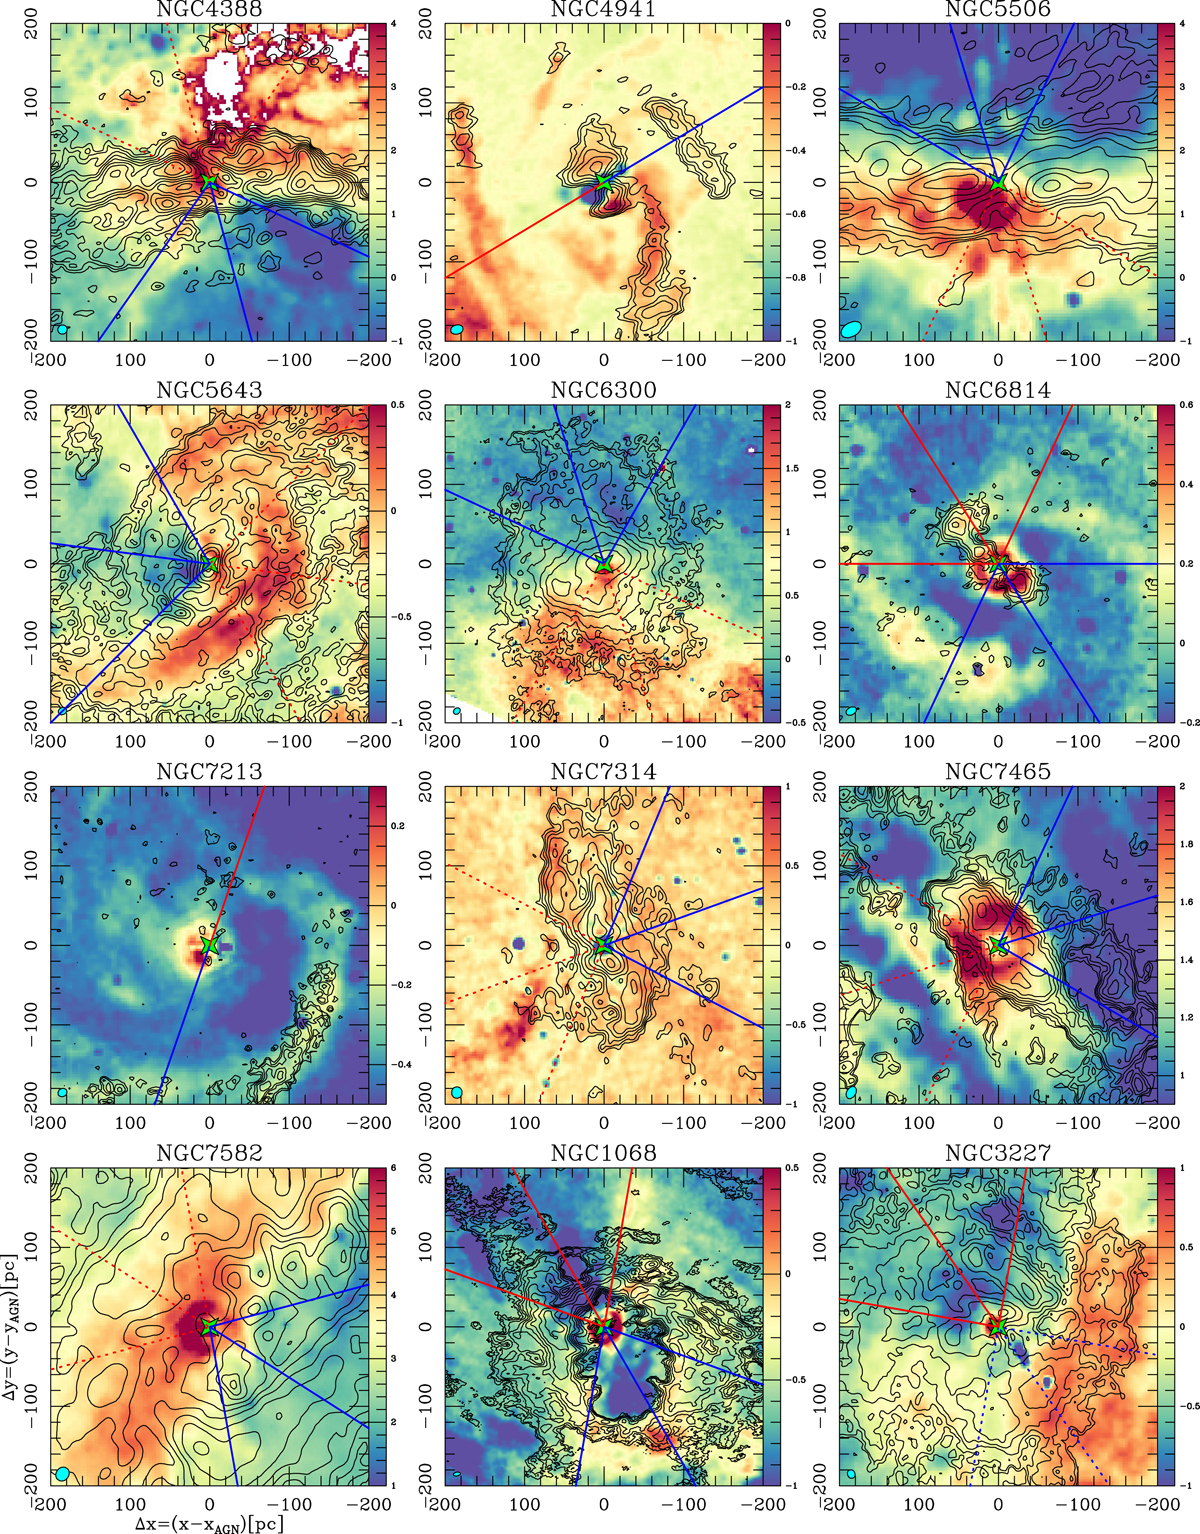
Velocity-integrated CO(3–2) emission images (ICO; contours), obtained from the ALMA MSR datasets, are overlaid on the V − H color maps (shown in color scale), derived from the images obtained by HST with the F606W (V) and F160W (H) filters, in the central Δx × Δy = 400 pc × 400 pc regions of the galaxies of the core sample of GATOS. For NGC 7314 we used data of the F450W filter to replace the unavailable F160W. We also include the CO and V − H images of NGC 1068 (García-Burillo et al. 2019) and NGC 3227 (Alonso-Herrero et al. 2019). Contour levels have a logarithmic spacing from 3σco to 90% of the peak CO intensity inside the displayed field-of-view (![]() ) in steps of ∼0.18 dex on average. The (cyan) filled ellipses at the bottom left corners in all panels represent the beam sizes of the CO observations. The AGN positions are highlighted by the star markers. The orientation and extent of the ionized winds are illustrated as in Figs. 2–4. Lines are color-coded to reflect whether the measured velocities of the ionized wind lobes are either redshifted or blueshifted. Dashed lines indicate that the corresponding lobe is (mostly) obscured by the disk of the host.
) in steps of ∼0.18 dex on average. The (cyan) filled ellipses at the bottom left corners in all panels represent the beam sizes of the CO observations. The AGN positions are highlighted by the star markers. The orientation and extent of the ionized winds are illustrated as in Figs. 2–4. Lines are color-coded to reflect whether the measured velocities of the ionized wind lobes are either redshifted or blueshifted. Dashed lines indicate that the corresponding lobe is (mostly) obscured by the disk of the host.
Current usage metrics show cumulative count of Article Views (full-text article views including HTML views, PDF and ePub downloads, according to the available data) and Abstracts Views on Vision4Press platform.
Data correspond to usage on the plateform after 2015. The current usage metrics is available 48-96 hours after online publication and is updated daily on week days.
Initial download of the metrics may take a while.