Fig. D.2.
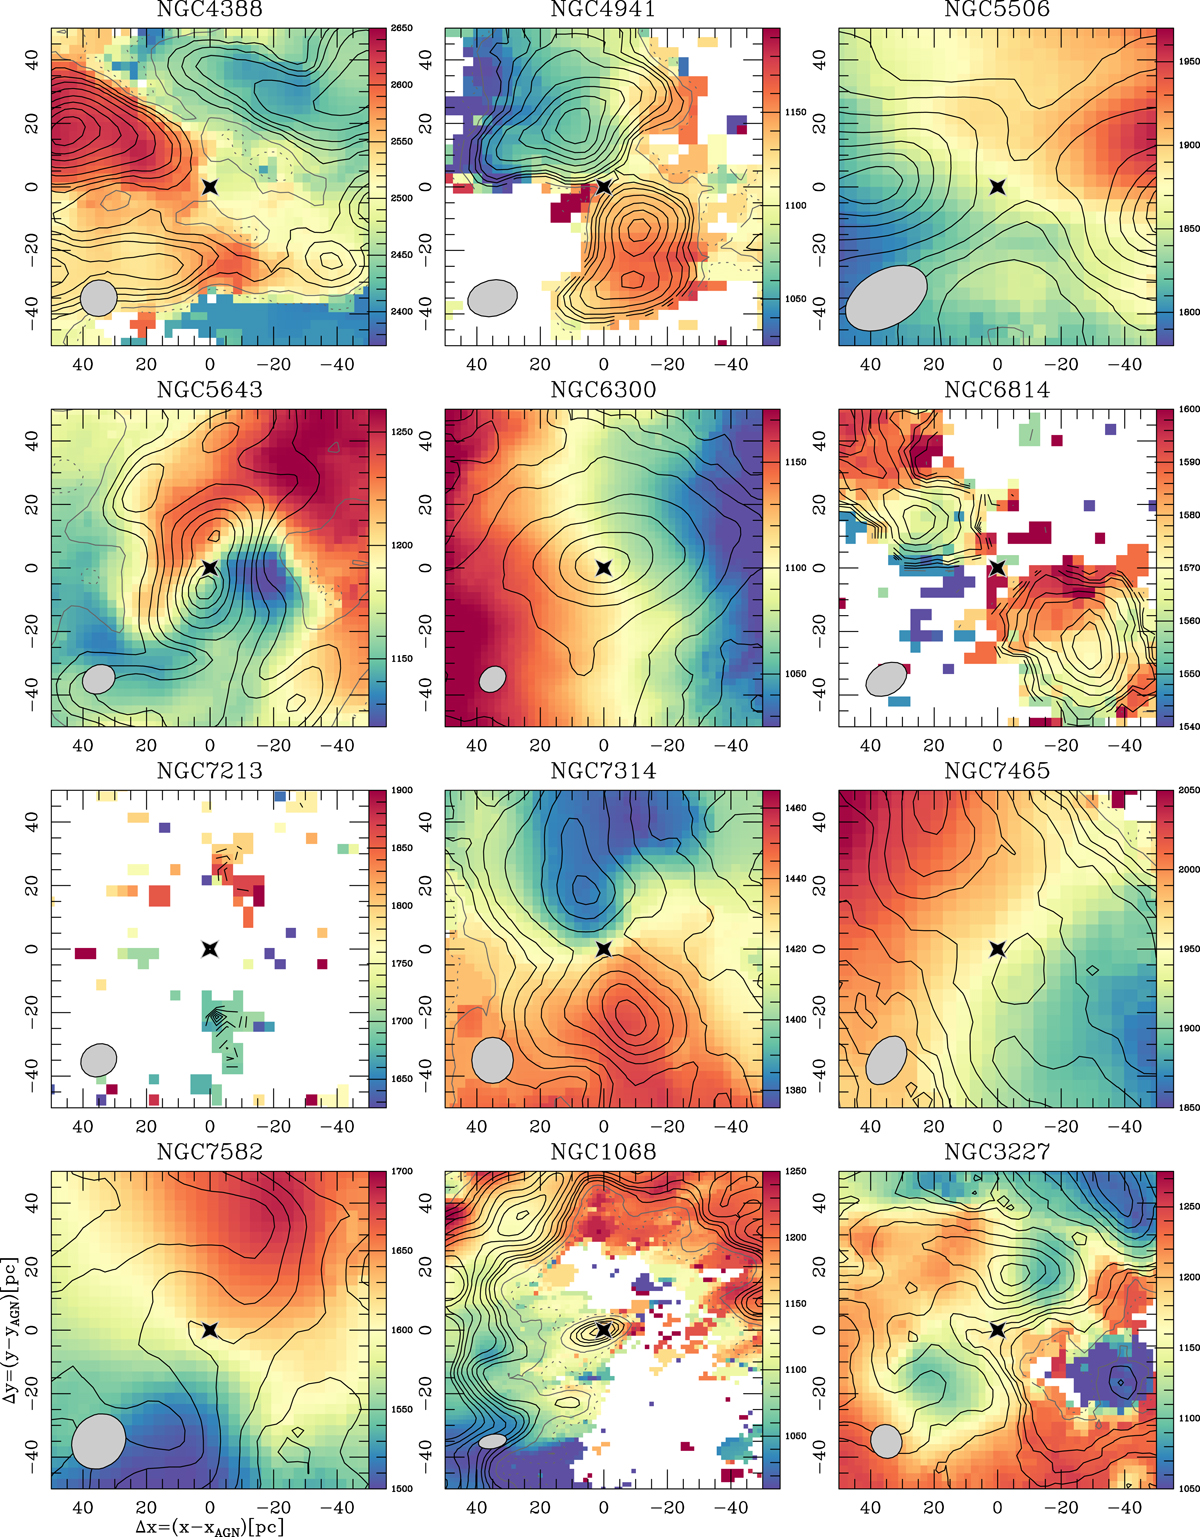
Overlay of the velocity-integrated emission (ICO; contours) on the mean-velocity field (⟨vCO⟩; linear color scale in km s−1-units) of molecular gas derived from the 3–2 line of CO for the central Δx × Δy = 100 pc × 100 pc regions of the core sample of GATOS galaxies. We also include the images of NGC 1068 (García-Burillo et al. 2019) and NGC 3227 (Alonso-Herrero et al. 2019). We used a 3σ clipping on the MSR data to simultaneously derive ICO and ⟨vCO⟩. Contours: 2.5% (dashed gray), 5% (gray), 10%, 15% 20%, 30% to 90% of ![]() in steps of 15% of
in steps of 15% of ![]() (black). Symbols as in Fig. 13.
(black). Symbols as in Fig. 13.
Current usage metrics show cumulative count of Article Views (full-text article views including HTML views, PDF and ePub downloads, according to the available data) and Abstracts Views on Vision4Press platform.
Data correspond to usage on the plateform after 2015. The current usage metrics is available 48-96 hours after online publication and is updated daily on week days.
Initial download of the metrics may take a while.