Fig. 1.
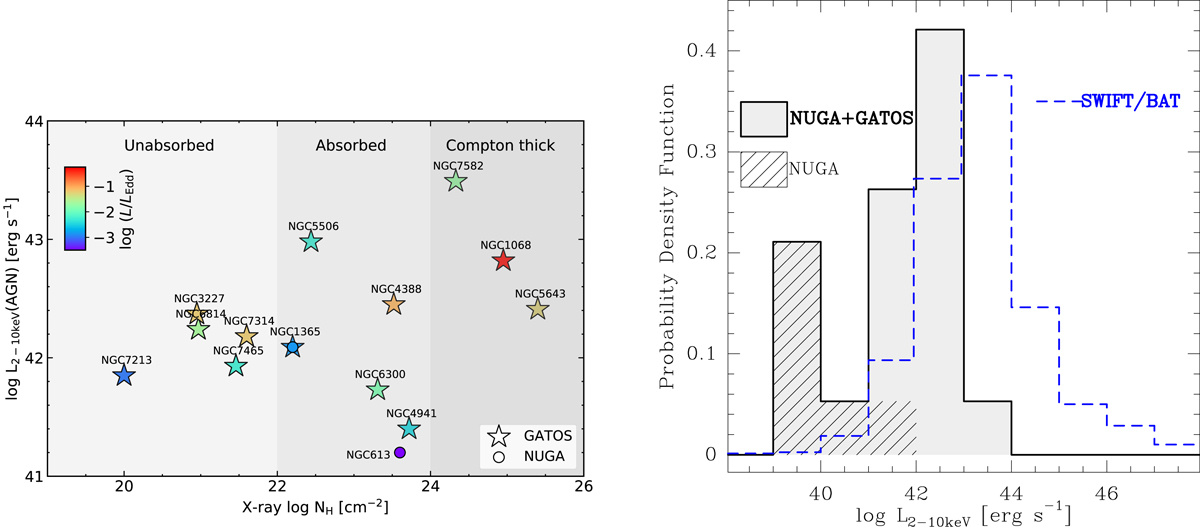
Left panel: comparison of the distribution of intrinsic AGN luminosities measured in the 2–10 keV X-ray band (corrected for absorption) and the column densities, NH, derived from hard X-rays, as measured by Swift/BAT in the 14–150 keV band for the combined GATOS sample listed in Table 1 (star markers) (Ricci et al. 2017a). We also include the data of NGC 613 from the NUGA sample (Combes et al. 2019) (circle), which also has NGC 1365 as a target in common with GATOS. Symbols are color-coded to reflect the Eddington ratios estimated by Koss et al. (2017). Right panel: comparison of the probability density function (PDF) of AGN luminosities in the 2–10 keV band for the combined sample of GATOS and NUGA (gray-filled histogram) and the Swift/BAT sample of Ricci et al. (2017a) (blue histogram). We identify the distribution of NUGA targets by the hatched area. This figure illustrates the complementarity of NUGA and GATOS samples in covering a significant (∼4.5 dex) range of intrinsic AGN luminosities with the combined sample of 19 nearby Seyferts used in this work.
Current usage metrics show cumulative count of Article Views (full-text article views including HTML views, PDF and ePub downloads, according to the available data) and Abstracts Views on Vision4Press platform.
Data correspond to usage on the plateform after 2015. The current usage metrics is available 48-96 hours after online publication and is updated daily on week days.
Initial download of the metrics may take a while.