Fig. D.3.
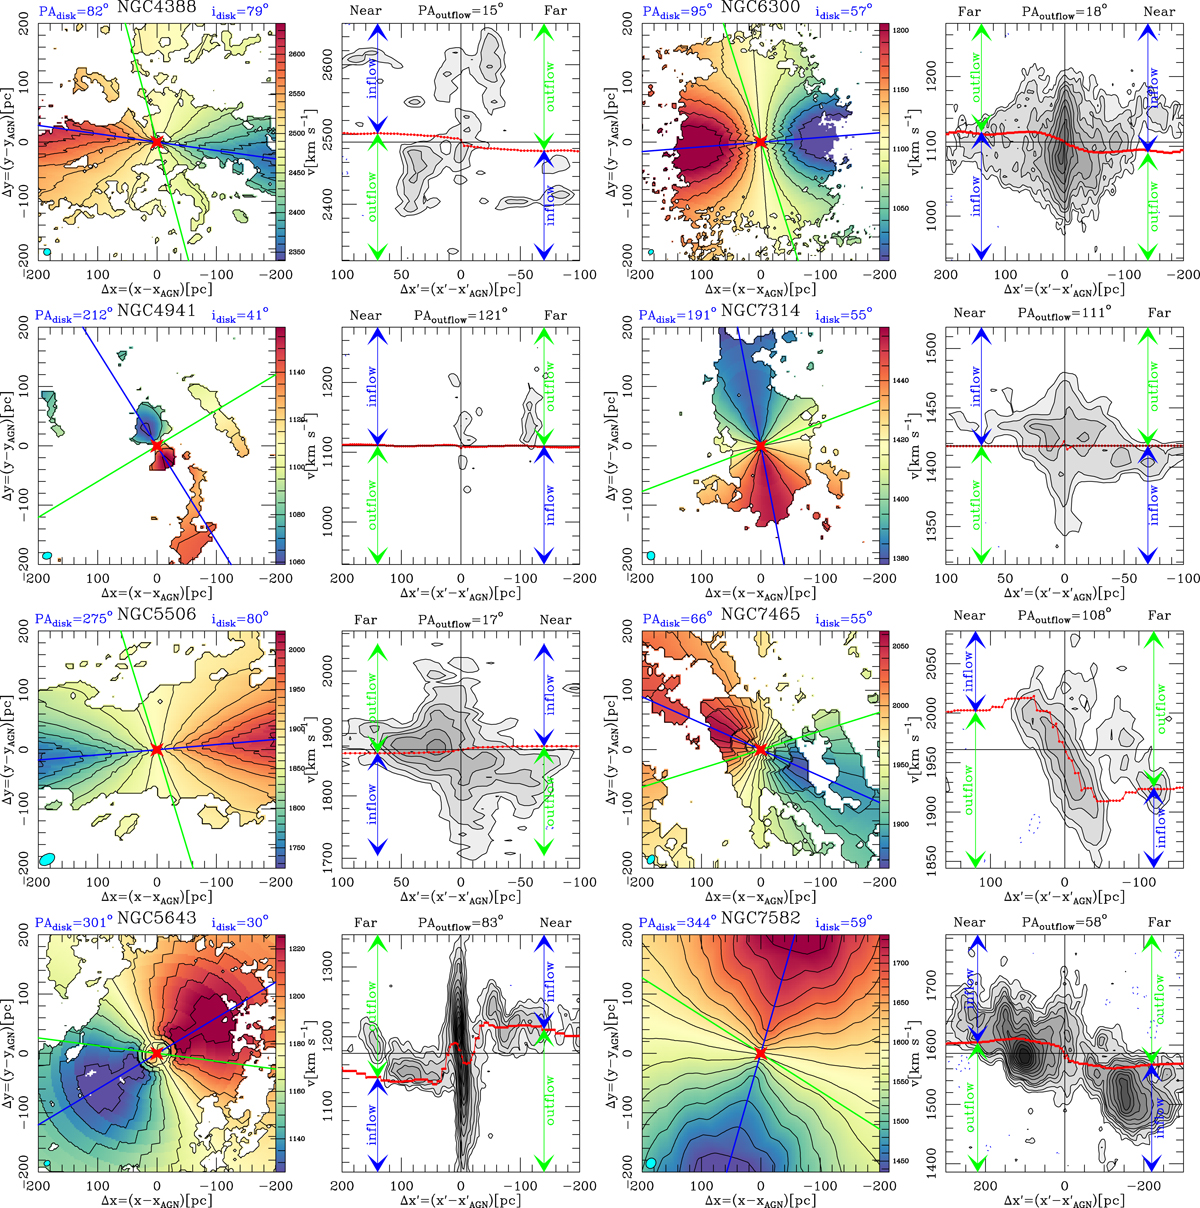
Rotational motions inside the central Δx × Δy = 400 pc × 400 pc regions of eight galaxies of the core sample of galaxies, derived from the fit to the CO velocity fields obtained by kinemetry, as described in Appendix D. We indicate the best-fit values estimated for the position angle (PAdisk; blue line) and the inclination of the disk (idisk). The green line shows the orientation of the outflow axes. The CO(3–2) position-velocity (p-v) diagrams derived along the outflow axes are shown on the right hand side beside the velocity field panels for each galaxy. The p-v diagrams are centered around the AGN locus and vsys. We identify the near and far sides on the upper x′ axes of the outflow p-v diagrams, based on the morphology of the V − H color maps of Fig. 12 and on the assumption that the spiral structures seen in some galaxies are trailing. Contour spacing: −2.5σ (dashed blue), 2.5σ, 5σ, 10σ, 15σ to the peak intensity in steps of 10σ. The red curves show the velocities along the outflow axes that can be attributed to rotational motions derived from the model. We identify in the p-v diagrams the regions corresponding to coplanar inflow or outflow radial motions.
Current usage metrics show cumulative count of Article Views (full-text article views including HTML views, PDF and ePub downloads, according to the available data) and Abstracts Views on Vision4Press platform.
Data correspond to usage on the plateform after 2015. The current usage metrics is available 48-96 hours after online publication and is updated daily on week days.
Initial download of the metrics may take a while.