Fig. 6.
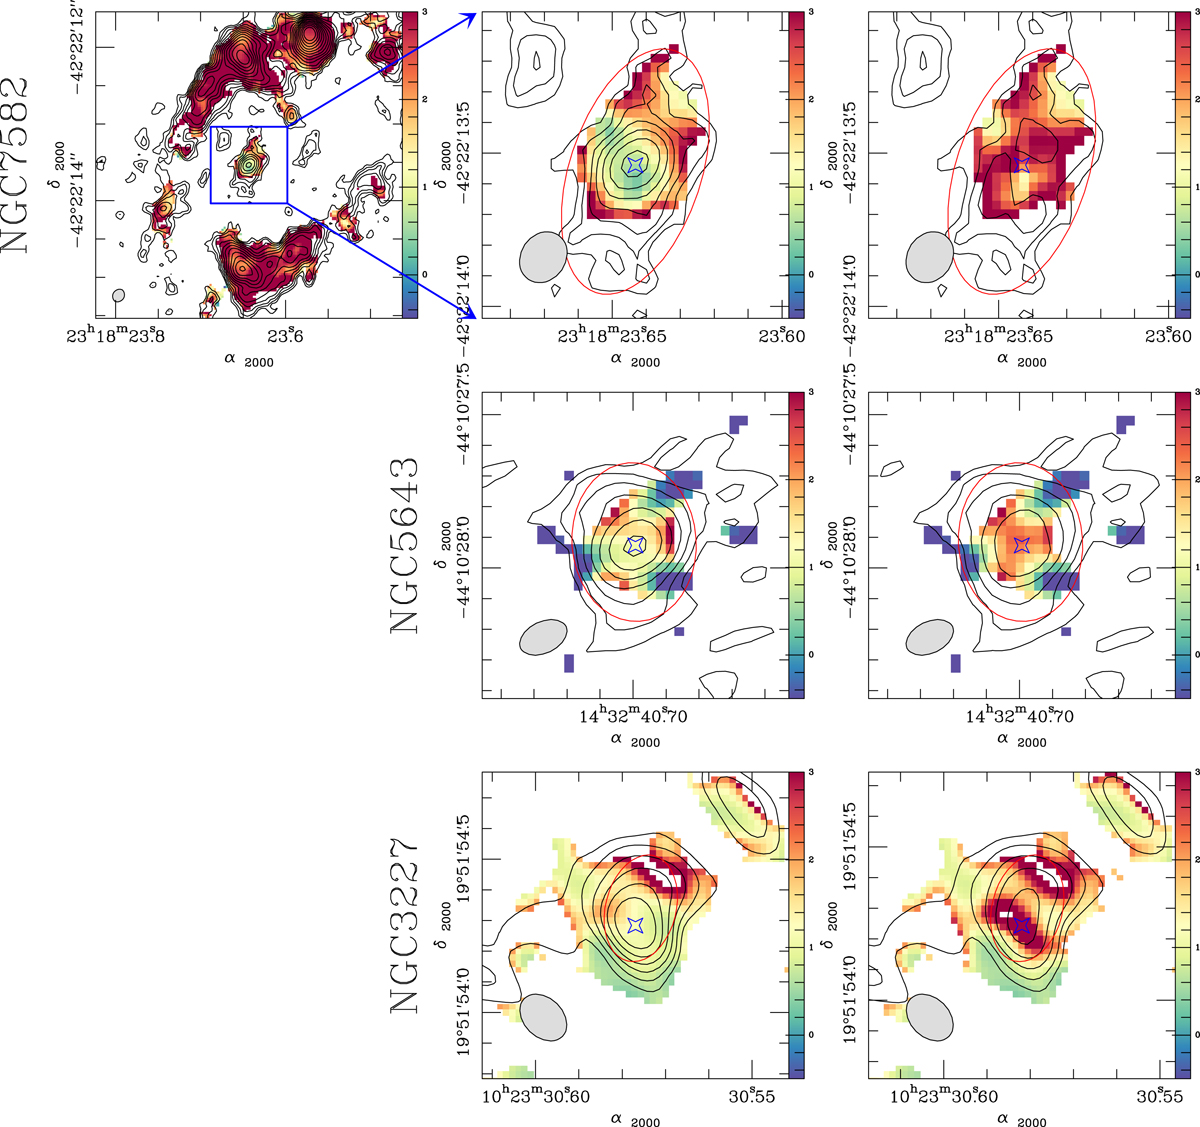
Top row: overlay of the ALMA 351 GHz continuum map of the central Δα × Δδ = 4″ × 4″ region of NGC 7582 (contours) on the spectral index map of the galaxy (α, with Sν ∝ να; in color) obtained from the images taken at ν = 230 GHz (Alonso-Herrero et al. 2020) and 351 GHz (this work) (left panel). We zoom in on the central Δα × Δδ = 1″ × 1″ region of NGC 7582 in middle panel and display the overlay after subtraction of the point-source in right panel. Middle row: same as top row but zooming in on the central Δα × Δδ = 1″ × 1″ region of NGC 5643; spectral index map obtained from the images taken at ν = 230 GHz (Alonso-Herrero et al. 2018) and 351 GHz (this work). Bottom row: same as middle row but for NGC 3227; spectral index map obtained from the images taken at ν = 230 GHz (Alonso-Herrero et al. 2019) and 351 GHz (this work). The common apertures (gray ellipses) adopted to derive the spectral index maps are: ![]() at PA = 146° (NGC 7582),
at PA = 146° (NGC 7582), ![]() at PA = 116° (NGC 5643), and
at PA = 116° (NGC 5643), and ![]() at PA = 46° (NGC 3227). In all panels contour levels span the range [3σ, 90% of the peak intensity] in logarithmic steps of 0.13 dex (NGC 7582), 0.19 dex (NGC 5643), and 0.12 dex (NGC 3227). The red ellipses identify the extended components associated with the dust emission of the tori. The star markers identify the AGN positions.
at PA = 46° (NGC 3227). In all panels contour levels span the range [3σ, 90% of the peak intensity] in logarithmic steps of 0.13 dex (NGC 7582), 0.19 dex (NGC 5643), and 0.12 dex (NGC 3227). The red ellipses identify the extended components associated with the dust emission of the tori. The star markers identify the AGN positions.
Current usage metrics show cumulative count of Article Views (full-text article views including HTML views, PDF and ePub downloads, according to the available data) and Abstracts Views on Vision4Press platform.
Data correspond to usage on the plateform after 2015. The current usage metrics is available 48-96 hours after online publication and is updated daily on week days.
Initial download of the metrics may take a while.