Fig. 18.
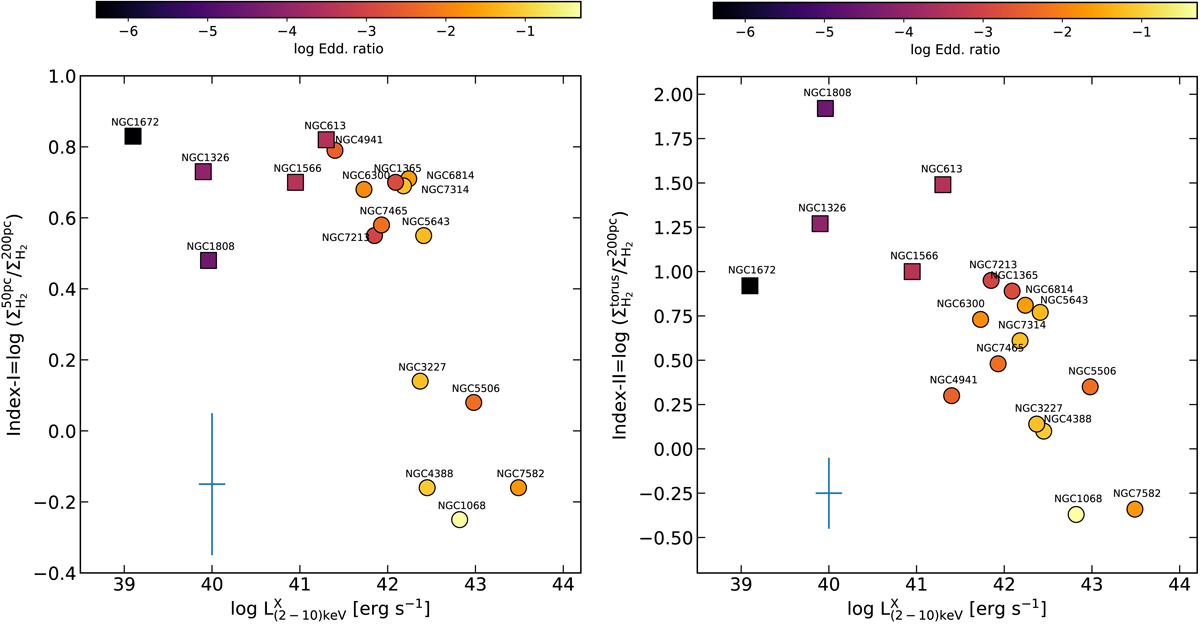
Left panel: estimate of the concentration of molecular gas in the central regions of the galaxies of GATOS and NUGA samples derived from the ratio of the average H2 surface densities measured at two spatial scales: r ≤ 50 pc (![]() ) and r ≤ 200 pc (
) and r ≤ 200 pc (![]() ); these scales are characteristic of the nuclear and circumnuclear regions, respectively. The ratio (index-I) is represented as a function of the AGN luminosities measured in the 2–10 keV band in log units; symbols are color-coded as a function of the Eddington ratios for the sample galaxies: NUGA (square markers) and GATOS (circle markers). Right panel: same as left panels but replacing
); these scales are characteristic of the nuclear and circumnuclear regions, respectively. The ratio (index-I) is represented as a function of the AGN luminosities measured in the 2–10 keV band in log units; symbols are color-coded as a function of the Eddington ratios for the sample galaxies: NUGA (square markers) and GATOS (circle markers). Right panel: same as left panels but replacing ![]() by the average H2 surface densities measured inside the torus (or polar) regions identified in Sect. 4.2 for GATOS sources (index-II). For NUGA galaxies we adopted the torus sizes derived by Combes et al. (2019). Errorbars account for the range of uncertainties on the molecular gas mass ratio estimates due to the assumed conversion factors, discussed in Sect. 8.1 (∼±0.2 dex), and on the AGN luminosities (∼±0.15 dex).
by the average H2 surface densities measured inside the torus (or polar) regions identified in Sect. 4.2 for GATOS sources (index-II). For NUGA galaxies we adopted the torus sizes derived by Combes et al. (2019). Errorbars account for the range of uncertainties on the molecular gas mass ratio estimates due to the assumed conversion factors, discussed in Sect. 8.1 (∼±0.2 dex), and on the AGN luminosities (∼±0.15 dex).
Current usage metrics show cumulative count of Article Views (full-text article views including HTML views, PDF and ePub downloads, according to the available data) and Abstracts Views on Vision4Press platform.
Data correspond to usage on the plateform after 2015. The current usage metrics is available 48-96 hours after online publication and is updated daily on week days.
Initial download of the metrics may take a while.