Fig. 16.
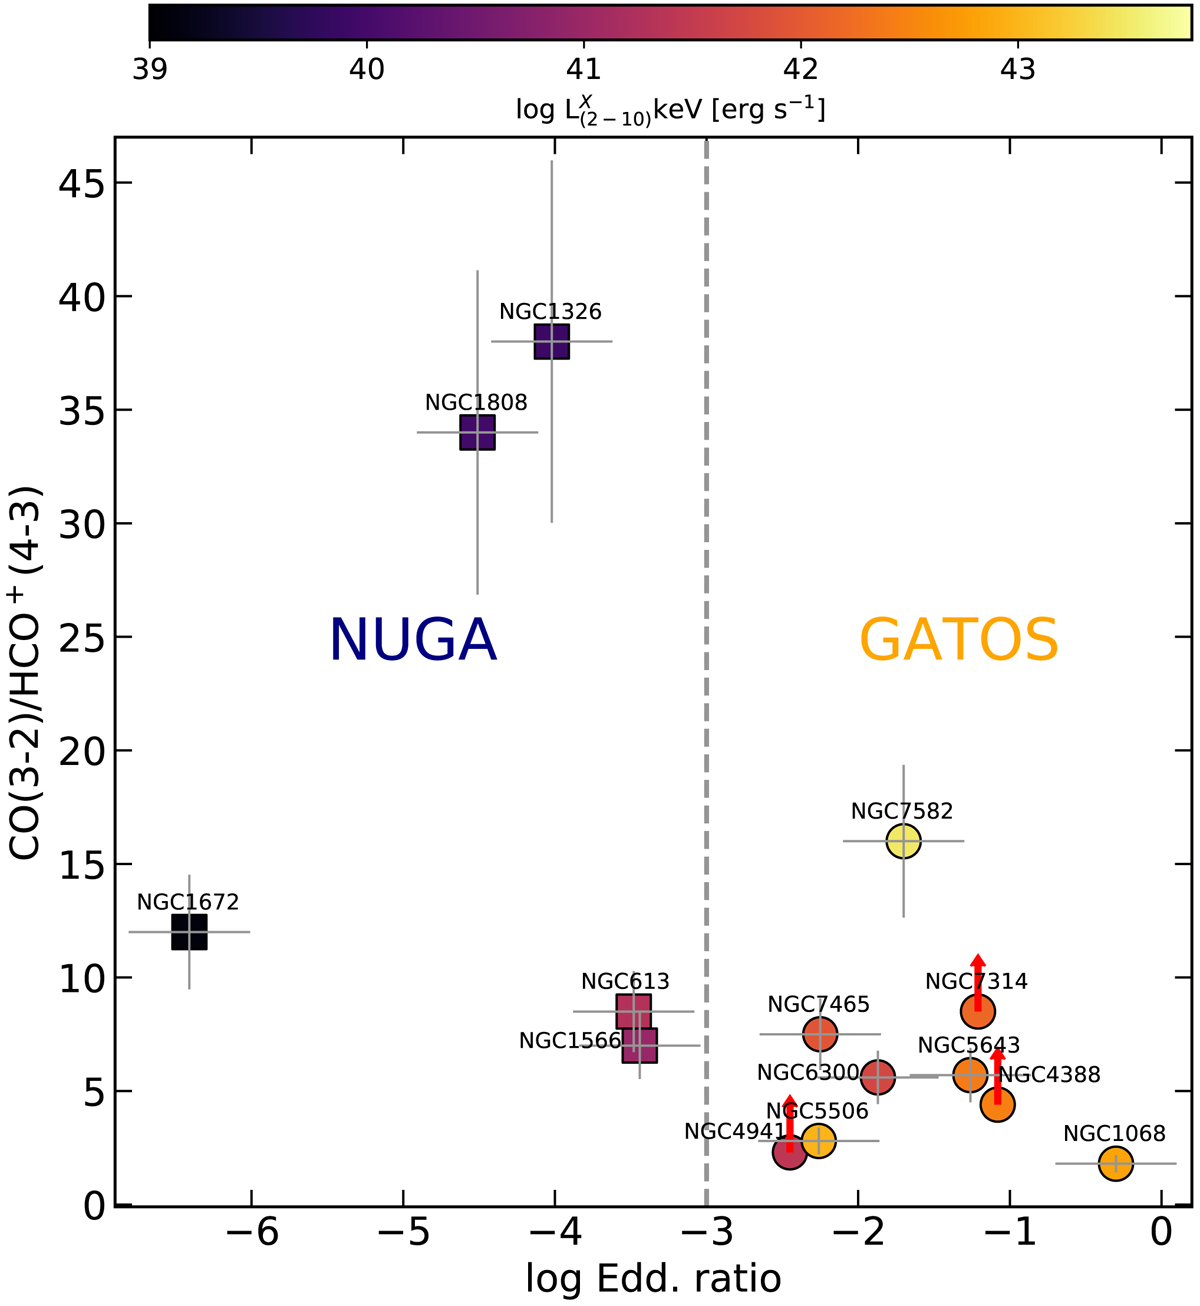
Comparison of the CO(3–2)/HCO+(4–3) ratios measured at the AGN locus in the galaxies of the NUGA (square markers) and GATOS (circle markers) samples as a function of the Eddington ratio. Symbols are color-coded as a function of the AGN luminosities measured in the 2–10 keV band for the sample galaxies. Lower limits on the ratios are identified by the (red) arrows. Uncertainties on the ratios (∼21%) are driven by the absolute flux calibration errors on the lines (∼15%). Eddington ratios have a ∼±0.4 dex uncertainty.
Current usage metrics show cumulative count of Article Views (full-text article views including HTML views, PDF and ePub downloads, according to the available data) and Abstracts Views on Vision4Press platform.
Data correspond to usage on the plateform after 2015. The current usage metrics is available 48-96 hours after online publication and is updated daily on week days.
Initial download of the metrics may take a while.