| Issue |
A&A
Volume 679, November 2023
|
|
|---|---|---|
| Article Number | A66 | |
| Number of page(s) | 21 | |
| Section | Interstellar and circumstellar matter | |
| DOI | https://doi.org/10.1051/0004-6361/202346825 | |
| Published online | 07 November 2023 | |
The Cygnus Allscale Survey of Chemistry and Dynamical Environments: CASCADE
II. A detailed kinematic analysis of the DR21 Main outflow
1
Max-Planck-Institut für Radioastronomie,
Auf dem Hügel 69,
53121
Bonn,
Germany
e-mail: This email address is being protected from spambots. You need JavaScript enabled to view it.
2
Argelander-Institut für Astronomie, Universität Bonn,
Auf dem Hügel 71,
53121
Bonn,
Germany
3
Institute of Astronomy, Faculty of Physics, Astronomy and Informatics, Nicolaus Copernicus University,
ul. Grudziądzka 5,
87-100
Toruń,
Poland
4
Max Planck Insitute for Astronomy,
Königstuhl 17,
69117
Heidelberg,
Germany
5
Department of Astronomy, University of Florida,
PO Box 112055,
Gainesville, FL
32611-2055,
USA
6
Tecnologico de Monterrey, Escuela de Ingenieria y Ciencias,
Avenida Eugenio Garza Sada 2501,
Monterrey
64849,
Mexico
7
Max-Planck-Institut für extraterrestrische Physik,
Giessenbachstrasse 1,
85748
Garching,
Germany
8
I. Physikalisches Institut, Universität zu Köln,
Zülpicher Str. 77,
50937
Köln,
Germany
9
IRAM, 300 rue de la Piscine, Domaine Universitaire de Grenoble,
38406
St.-Martin-d’Hères,
France
10
Department of Astrophysics, University of Vienna,
Turkenschanzstrasse 17,
1180
Vienna,
Austria
Received:
5
May
2023
Accepted:
17
September
2023
Abstract
Context. Molecular outflows are believed to be a key ingredient in the process of star formation. The molecular outflow associated with DR21 Main in Cygnus-X is one of the most extreme molecular outflows in the Milky Way in terms of mass and size. The outflow is suggested to belong to a rare class of explosive outflows formed by the disintegration of protostellar systems.
Aims. We aim to explore the morphology, kinematics, and energetics of the DR21 Main outflow, and to compare those properties to confirmed explosive outflows in order to unravel the underlying driving mechanism behind DR21.
Methods. We studied line and continuum emission at a wavelength of 3.6 mm with IRAM 30 m and NOEMA telescopes as part of the Cygnus Allscale Survey of Chemistry and Dynamical Environments (CASCADE) program. The spectra include (J = 1−0) transitions of HCO+, HCN, HNC, N2H+, H2CO, and CCH, which trace different temperature and density regimes of the outflowing gas at high velocity resolution (~0.8 km s−1). The map encompasses the entire DR21 Main outflow and covers all spatial scales down to a resolution of 3″ (~0.02 pc).
Results. Integrated intensity maps of the HCO+ emission reveal a strongly collimated bipolar outflow with significant overlap of the blueshifted and redshifted emission. The opening angles of both outflow lobes decrease with velocity, from ~80 to 20° for the velocity range from 5 to 45 km s−1 relative to the source velocity. No evidence is found for the presence of elongated, “filament-like” structures expected in explosive outflows. N2H+ emission near the western outflow lobe reveals the presence of a dense molecular structure, which appears to be interacting with the DR21 Main outflow.
Conclusions. The overall morphology as well as the detailed kinematics of the DR21 Main outflow are more consistent with a typical bipolar outflow than with an explosive counterpart.
Key words: stars: protostars / stars: winds, outflows / stars: formation / ISM: jets and outflows / ISM: kinematics and dynamics / ISM: molecules
© The Authors 2023
 Open Access article, published by EDP Sciences, under the terms of the Creative Commons Attribution License (https://creativecommons.org/licenses/by/4.0), which permits unrestricted use, distribution, and reproduction in any medium, provided the original work is properly cited.
This article is published in open access under the Subscribe to Open model.
Open Access funding provided by Max Planck Society.
1 Introduction
Molecular outflows are a ubiquitous part of star formation arising from both high- and low-mass protostars (Arce et al. 2007; Frank et al. 2014; Bally 2016). A new type of outflow, formed by the disintegration of protostellar systems due to a merging event, has been proposed and linked to regions of high-mass star formation (Bally & Zinnecker 2005; Zapata et al. 2009). The massive outflow of DR21 Main is one of the proposed candidates for this type of explosive outflow (Zapata et al. 2013). The large angular extent of the DR21 Main outflow allows a detailed analysis of its structure and properties, with a view to compare these to the same attributes of other explosive outflow candidates.
Molecular protostellar outflows range from highly collimated molecular jets, such as HH211 (Gueth & Guilloteau 1999), all the way to wide-angled outflows from high-mass sources (Beuther & Shepherd 2005a). In general, outflows tend to appear “narrower” at higher velocities (Bachiller & Tafalla 1999), and become less collimated as they evolve (Beuther & Shepherd 2005b; Arce & Sargent 2006; Offner et al. 2011; Hsieh et al. 2023). They can vary significantly in size and energetics, with sizes from 0.1 pc up to parsec scales and momentum rates of between 10−5 and 10−2 M⊙ km s−1 yr−1 for low-mass sources and some O type stars, respectively (e.g., Maud et al. 2015). Some outflow properties, such as their mass, force, and mechanical luminosity, correlate well with the intrinsic parameters of their driving sources, such as the bolometric luminosity (Bally & Lada 1983; Cabrit & Bertout 1992; Wu et al. 2004) and the mass of the molecular gas envelope of their driving source (Bontemps et al. 1996; Beuther et al. 2002), suggesting a common driving mechanism in both the low- and high-mass sources. Clearly, molecular outflows play a critical role in regulating star formation by removing excess angular momentum and thus facilitating the further growth in mass of a protostellar system (Blandford & Payne 1982; Machida 2014), and also play a part in dispersing the surrounding envelope, reducing the available mass reservoir (Arce & Sargent 2006).
Due to their large size and the energy they carry, molecular outflows can have a significant impact on the surrounding interstellar medium (ISM) over different spatial scales. First, at envelope scales (103−104 AU), powerful young outflows entrain and clear out dense material giving rise to bipolar cavities (e.g., Gueth et al. 1997; Velusamy & Langer 1998; Arce & Sargent 2004, 2005). At core scales (0.1–0.3 pc), outflows are considered a significant contributor to turbulence (Myers et al. 1988; Zhang et al. 2005). In addition, outflows from high-mass young stellar objects (YSOs) might impact the morphology of the host molecular cloud and may even break it apart (Fuente et al. 1998; Benedettini et al. 2004). Finally, the propagation of outflows through the surrounding dense material leads to the formation of shocks, which locally compress and heat the gas, and drive chemical processes enriching the ISM (e.g., Kaufman & Neufeld 1996; Flower & Pineau Des Forêts 2010; Burkhardt et al. 2019).
A newly proposed type of molecular outflow is the so-called explosive dispersal outflow, whose origin appears to be linked to the disintegration of young stellar systems (Bally et al. 2017; Rivera-Ortiz et al. 2021) or to protostellar mergers (Bally & Zinnecker 2005). The interpretation is limited due to the small sample of explosive-outflow candidates: Orion-KL (Zapata et al. 2009), DR21 Main (Zapata et al. 2013), G5.89 (Zapata et al. 2019), and IRAS 16076-5134 (Guzmán Ccolque et al. 2022). Nevertheless, these explosive outflows share the following characteristics (Zapata et al. 2009, 2017): (i) they consist of multiple straight, narrow, and relatively isotropically distributed filamentlike structures; (ii) these filament-like structures should all point towards the point of origin of the explosive outflow and show an increase in velocity with distance from the point of origin akin to a Hubble flow; (iii) have a significant overlap of their blueshifted and redshifted emission components. The filamentlike structures of explosive outflows form because all material is simultaneously accelerated in the explosion. As a result, faster-moving material has traveled further away from the source and is trailed by the slower parts of the outflow. Overall, the properties of these outflows have mostly been studied using low-J CO transitions at high angular resolution (e.g., Zapata et al. 2009, 2013, 2019). Observations of the inner parts of these explosive molecular outflows reveal multiple filament-like structures. At the same time, the lack of similar observations in other molecular tracers limits our understanding of their chemistry and the various physical gas components.
The DR21 Main outflow is a particularly interesting explosive outflow candidate (Zapata et al. 2013), as it is one of the most massive (Mout > 3000 M⊙) and energetic (Ekin > 2 × 1048 erg) outflows detected in our Galaxy (Garden et al. 1986, 1991b), first in the vibrationally excited 2.12 μm line of shock-excited molecular hydrogen (H2). DR21 Main itself is a compact HII region prominent at radio wavelengths. It is located in the Cygnus-X high-mass star-forming region-molecular cloud complex (Leung & Thaddeus 1992), at the southern end of the DR21 molecular ridge (Dickel et al. 1978), and at a distance of 1.5 kpc (Rygl et al. 2012). The outflow appears bipolar, with the outflow lobes extending from east to west (Garden et al. 1986, 1991a; Garden & Carlstrom 1992; Schneider et al. 2010). High-velocity low- J CO emission has also been reported in the north–south direction (Garden et al. 1991b). The blueshifted and redshifted parts of the outflow overlap significantly, suggesting that it extends very close to the plane of the sky (Cruz-González et al. 2007). It was initially suggested that the DR21 Main outflow is driven by a massive protostar, with Lbol of ~ 105−106 L⊙ (Garden et al. 1991b; Garden & Carlstrom 1992), but no such source has yet been identified (Cruz-González et al. 2007). The absence of a clearly detected driving source, along with the detection of some filament-like structures in CO (1–0) emission, led Zapata et al. (2013) to suggest a possible explosive nature for the DR21 Main outflow.
In this work, we aim to study the morphology, kinematics, and energetics of the DR21 Main outflow using observations in multiple molecular lines, which are sensitive to a range of physical conditions. We also aim to determine whether the characteristics of the DR21 Main outflow are consistent with those expected for explosive outflows or rather with those of typical protostellar outflows.
This work is part of the Max Planck IRAM Observatory Program (MIOP) “Cygnus Allscale Survey of Chemistry and Dynamical Environments (CASCADE)” (Beuther et al. 2022). CASCADE is designed to map significant parts of the Cygnus-X molecular cloud complex at high angular resolution and with a broad bandpass using the Northern Extended Array for Millimeter Astronomy (NOEMA) and the 30 m telescope, both operated by the Institut de Radioastronomie Millimètrique (IRAM). The combination of velocity-resolved single-dish and interferometric observations offers the high resolution necessary to resolve the outflow structure without losing information on extended emission. CASCADE aims to take advantage of these high-quality observations to connect the transition of gas all the way from the large scales of molecular clouds down to the small scales of cores; to look for signs of collapse or feedback; to investigate the impact of star-forming cores on their surroundings; and to search for possible trends with evolutionary stage and more. The scope and goals of CASCADE are discussed in detail by Beuther et al. (2022).
The paper is organized as follows. Section 2 describes the observations from CASCADE. Section 3 presents line detections and maps of the DR21 Main outflow in several molecular transitions, and provides the analysis of outflow properties. In Sect. 4, the results are discussed and scenarios for the origin of the DR21 Main outflow are explored along with its interactions with the surrounding molecular cloud. Finally, in Sect. 5 we present a summary and conclusions.
2 Observations
A detailed overview of the CASCADE program is given in Beuther et al. (2022). Briefly, CASCADE covers all high-column-density areas in the Cygnus-X molecular cloud complex using 40 mosaics, each covering 16 arcmin2. Each of the mosaics corresponds to 78 NOEMA pointings and was observed in both the C and D configurations. The observations have a total bandwidth of 16 GHz, 8 in each sideband, at the 3.6 mm window. The full bandwidth is covered with a spectral resolution of 2.0 MHz, but selected parts surrounding the most important lines are also covered by additional high-resolution correlator units providing a spectral resolution of 62.5 kHz. The DR21 Main outflow is covered by two of the NOEMA mosaics, which were observed between 2020 May 29 and November 6. During that time, the array consisted of ten antennas, yielding baselines between 15 m and 365 m. The strong quasars 3C345 and 3C273 were used as bandpass calibrators, MWC349 and 2010+723 were used for flux calibration, and 2005+403, 2120+445, 2050+363 and 2013+370 were used for gain calibration. Complementary single-dish observations were carried out with the IRAM 30m telescope between 2020 February and July, in order to provide the missing short spacing information. These observations will be presented in detail in an upcoming paper by Christensen et al. (in prep.).
The calibration and imaging of the data was done using CLIC and MAPPING software, which are part of the GILDAS package1). The NOEMA observations are combined with the IRAM 30m data using the UV_SHORT task. The resulting single-channel σrms noise – for a channel width of 0.8 km s−1 – and beam sizes for all observed lines are summarized in Table 1.
Continuum and spectral line parameters for all lines covered by the CASCADE observations.
3 Results and analysis
We present the CASCADE observations for an area surrounding DR21 Main that covers the entirety of its outflow. Our data allow us to analyze the kinematics, morphology, and energetics of the DR21 Main outflow and to contribute to a discussion about its nature.
3.1 Molecular detections
Several molecular lines are detected in the CASCADE observations of the DR21 Main (see Table 2). The spatial distribution of the emission can be divided into three cases: (i) tracing the outflow (extended emission in the W–E direction), (ii) tracing the DR21 ridge (extended emission in the N–S direction), and (iii) sporadic (compact emission that appears in multiple locations) or compact emission (see Fig. 1). The different tracers can therefore be used to examine the morphology of the various gas components in DR21 Main. Integrated intensity contour maps for all the emission lines are shown in Appendix A.
The contour map of the HCO+ integrated intensity (Fig. 1, left panel) shows that most of the emission arises from the area of the outflow lobes and also appears to be in close agreement with the H2 emission at 2.2 μm (see also Garden et al. 1986; Davis et al. 2007) associated with outflowing shocked gas. Interestingly, the HCO+ (1−0) contours also reveal the presence of hollowed-out cavities in both outflow lobes lacking line emission, which is similar to early findings by Garden & Carlstrom (1992). The cavities are more prominent in the eastern outflow lobe, which appears entirely separated from the center of the DR21 Main area. Therefore, while HCO+ is well associated with the outflowing material, it most accurately traces the outer parts of the outflow cavities. In a similar fashion, line emission in HCN (1−0) is also associated with the outflow, but shows a more compact pattern in the direction of the peaks of HCO+ emission (see Fig. A.1).
In contrast, the N2H+ emission appears to trace the DR21 ridge along the N–S direction (the middle panel of Fig. 1, Wilson & Mauersberger 1990; Motte et al. 2007). This is expected as N2H+ is known to trace dense, cold, CO-depleted gas (Caselli et al. 2002; Jørgensen et al. 2004). In addition to the ridge, N2H+ also reveals the presence of a molecular structure near the western lobe. This structure was previously detected in CS (2−1) by Plambeck & Menten (1990) who also reported the detection of a collisionally excited class I methanol maser in its interaction region with the outflow traced by H2 emission. Other molecules that are often associated with dense gas, such as CCH (1−0), HCCCN (both the (10−9) and (8−7) transitions), 13CS (1−0), and HNC (1−0), show a distribution similar to that of N2H+ (1−0) (see Figs. A.1, A.2 and A.3).
Finally, SiO is detected close to the center of the outflow, but also shows very localized emission in an area of the western outflow lobe (Fig. 1, right panel). Although SiO typically traces shocks in the ISM (e.g., Martin-Pintado et al. 1992; Schilke et al. 1997; Gusdorf et al. 2008), its emission peak in the center of DR21 might also originate from photo-evaporating ice mantles in the dusty envelope of a driving source(s) (e.g., Walmsley et al. 1999; Schilke et al. 2001). On the other hand, the SiO emission detected near the western lobe could result from the interaction of the outflow and the dense structure seen, for example, in N2H+, located there. This scenario is discussed in more detail in Sect. 4.3.
Figure 2 shows the profiles of the strongest lines averaged over the eastern outflow lobe, the central area of DR21 Main, and the western outflow lobe (Fig. 1). Similar spectra for the rest of the lines are presented in Appendix B. The peak of the line emission lies at a velocity of −3 km s−1, which corresponds to the velocity of the DR21 ridge (Dickel et al. 1978). The 9 km s−1 feature, caused by more diffuse foreground material in the so-called extended W75 cloud (Dickel et al. 1978; Nyman 1983) can also be seen in some of the lines, but is most prominent in HCO+ and HCN. The profiles of both the HCO+ and HCN lines display extended line wings and strong emission in both outflow lobes, confirming their association with the outflowing material. In contrast, emission from molecules associated with the denser gas and the bulk of the DR21 ridge, such as N2H+ or HNC, have narrower emission lines and relatively weaker emission from the outflow lobes.
In summary, the CASCADE observations offer a clear view of the different gas components in the DR21 Main area. Most importantly, the HCO+ is found to accurately trace the molecular outflow, N2H+ highlights the dense filament, and SiO emission suggests the possibility of an interaction between the outflow and the surrounding ISM, a scenario further explored in Sect. 4.3. The release of a full line list, including unidentified lines for all targets of the CASCADE survey, will be presented in a future paper of the collaboration.
Molecular line detections (at 5σ level) in the area of the DR21 Main outflow.
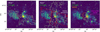 |
Fig. 1 United Kingdom Infra-Red Telescope (UKIRT) Wide Field Camera (WFCAM) continuum image of the DR21 Main region at 2.2 μm (Warren et al. 2007) and the line emission in key gas tracers observed as part of CASCADE. Shock-excited H2 emission makes a significant contribution to the 2.2 μm image, in particular to the lobes off the central region. White contours mark the 5σ HCO+ (left), N2H+ (middle), and SiO (right) emission. Intensities are integrated between −50 and 50, −20 and 10, and −20 and 20 km s−1 for the HCO+, N2H+, and SiO emission, respectively. The adopted point of origin of the outflow is marked in all cases with a red cross. Red dashed lines (middle) mark the three separate areas of the DR21 Main region used to extract the spectra in Fig. 2, with “E” marking the eastern outflow lobe, “C” the central area, and “W” the western outflow lobe. The magenta dashed box (right) marks the location of the interaction region shown in Fig. 11. Finally orange contours (right) show the 5σ integrated intensity of H41α from −30 to 30 km s−1. |
3.2 The molecular outflow of DR21 Main
The HCO+ emission is one of the best tracers of the molecular outflow in DR21 Main and its distribution closely follows that of the H2 emission (Sect. 3.1, Fig. 1). Therefore, we use it to explore the kinematics as well as the outflow morphology at different velocities. In particular, we investigate the change of the opening angle with gas velocity.
Figure 3 shows the spatial distribution of the HCO+ (1 −0) emission integrated over velocity intervals of 5 km s−1 in the range from 5 and 45 km s−1 relative to the source velocity (vsource = −3 km s−1) for the redshifted emission, and from −5 to −45 km s−1 for the blueshifted emission. Most of the HCO+ emission is elongated in the W–E direction, tracing the outflow lobes of a bipolar outflow (Fig. 1). Some emission extends also in the N−S direction in a narrow range of velocities, suggesting that it is associated with the DR21 ridge. However, some of this emission might also originate from the outflowing gas, as suggested by CO (1−0) maps (Garden et al. 1991b).
Overall, the velocity-channel maps (Fig. 3) show a rather symmetric morphology, but some small asymmetries can be noted. Namely, the blueshifted part of the outflow appears stronger and extends to higher velocities than its redshifted counterpart. Similar behavior is also seen between the two lobes of the outflow, with the western lobe both appearing brighter and showing higher velocities than the eastern one. These small asymmetries are likely to arise because of the relative position of the outflow driving source compared to the bulk of material in the surrounding ISM. In addition, the higher-velocity HCO+ emission seems to be detached from the point of origin of the outflow (see also Garden & Carlstrom 1992). Thanks to the higher angular resolution of the current observations, we find cleared-out cavities in the outflow lobes. Finally, the known overlap of the blueshifted and redshifted parts of the DR21 Main outflow, indicating that the outflow extends close to the plane of the sky, is clearly seen (see Fig. 4, and Schneider et al. 2010). However, we note that we cannot estimate the inclination of the outflow more precisely because of the complexity of the ISM surrounding DR21 Main, for example, the interaction region.
Figure 5 shows the position velocity diagram of HCO+ along the DR21 Main outflow illustrating several key outflow structures. First, the bright negative peak near the offset of 200” indicates the location of the interaction region, where material is deflected into the line of sight. Secondly, an extended absorption feature is detected near the middle of the outflow, which corresponds to the H II region. Thirdly, the known absorption feature at 9 km s−1, which is caused by more diffuse foreground material associated with W75, is also detected along the entire length of the outflow (Dickel et al. 1978). Finally, several structures are detected in the less disrupted eastern lobe, which resemble a sawtooth pattern associated with the extremely high-velocity (EHV) component of the low-mass protostar IRAS 04166+2706 (Santiago-Garcia et al. 2009). A first estimate of the maximum velocity of the structures (~20 km s−1) and the separation between them (~10″) using approximate values derived from the PV diagram yields upper limits for the timescales between these knots of the order of ~103 yr. This result corresponds to the upper limits of the timescales found between the knots in the outflows of W43–MM1 (Nony et al. 2020).
Figure 6 compares the velocities of HCO+ with those of N2H+ in the direction of the DR21 ridge. N2H+ is exclusively associated with the ridge (Fig. 1) and shows three peaks corresponding to its hyperfine-splitted lines. All those components show a velocity gradient along the DR21 ridge, with velocities becoming increasingly blue-shifted North of DR21 Main. A similar gradient cannot be probed in the corresponding HCO+ position–velocity diagram (Fig. 6) due to the complex line profiles. Similar to Fig. 5, a strong central absorption feature exists, associated with the H II region. In addition, the extended emission in the North–South is detected as a blue-shifted structure between offsets 50″ and 100″. The lack of corresponding red-shifted emission favors the scenario that this emission is associated with the ridge and not an additional outflow, extending in the N–S direction.
An important characteristic often used to describe outflows is their opening angle, a measure of how wide or collimated an outflow actually is. Here we calculated the opening angles for the DR21 Main outflow, separately for each lobe and for red- and blue-shifted emission, by examining the spectra of HCO+ emission along a half-circle with radius approximately equal to half the extent of the corresponding outflow lobe (The exact location of these half-circles is shown in Fig. 3). The opening angle then corresponds to the angle between the location where the emission first becomes significant and the location where it drops further to noise level. The resulting opening angles for all different cases and for different velocities are plotted in Fig. 7 over the corresponding velocity. Interestingly, the opening angles for all cases appear to be decreasing for higher velocities, a behavior that is expected in the case of a typical bipolar outflow powered by a narrow and well-collimated jet (e.g., Zhang et al. 2019; Rabenanahary et al. 2022).
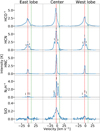 |
Fig. 2 Averaged line profiles of the (1−0) transitions of HCO+, HCN, HNC, N2H+, and the (2−1) transition of SiO toward the eastern lobe, the center, and the western lobe of the DR21 Main outflow (see Fig. 1). For HCN and N2H+, the velocities corresponding to hyperfine structure components are marked with black ticks. Red dashed lines show the source velocity, −3 km s−1, green dashed lines mark the location of the absorption feature at 9 km s−1, and the gray horizontal lines show the baselines. |
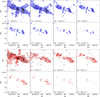 |
Fig. 3 Channel maps of the DR21 Main outflow in HCO+. Contours of the blueshifted HCO+ emission (in blue) and redshifted emission (in red) are integrated over velocity steps of 5 km s−1 and are plotted over the corresponding grayscale. The full velocity range is from 5 to 45 km s−1 relative to the source velocity (−3 km s−1) and the contour levels correspond to 5, 10, and 20 σrms. The black dashed circle shows the area of the DR21–1 core in Cao et al. (2019). The green dashed lines denote the half-circles used to derive the outflow opening angles (see Fig. 7). |
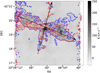 |
Fig. 4 HCO+ emission integrated from −50 to 50 km s−1. Red and blue contours mark the redshifted (5 to 45 km s−1) and blueshifted (−5 to −45 km s−1) HCO+ emission, respectively. Contours correspond to 5 σrms emission and the velocity ranges are given relative to the source velocity (−3 km s−1). Black arrows mark the cuts for the PV diagrams (Figs. 5 and 6) and the ticks mark distances of 50 arcsec along the arrows. |
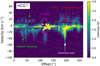 |
Fig. 5 Position–velocity diagram for HCO+ emission along the DR21 Main outflow. The offset is measured from the edge of the eastern lobe towards the west. The arrow points to the 9 km s−1 absorption feature (Dickel et al. 1978), the white arrow highlights the location of the interaction region (this work), the magenta dashed contour marks the H41α emission from the Η II region, and the light green arrows mark examples of sawtooth pattern structures (Santiago-García et al. 2009). |
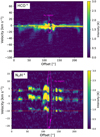 |
Fig. 6 Position–velocity diagrams for HCO+ (top) and N2H+ (bottom) emission along the DR21 ridge. The offset is measured from south to north (see Fig. 4 for the exact location of the cut). The magenta dashed contour marks the H41 α emission from the Η II region while the orange dashed lines mark the source velocity (−3 km s−1). For the N2H+ line, the velocities of the three resolved hyperfine structure components are marked at 4, −3, and −10 km s−1, respectively. |
3.3 Energetics of the outflow
The spatially- and velocity-resolved observations of the DR21 Main outflow allow us to calculate key outflow properties, such as the outflow force, F, the rate at which the outflow injects momentum into the surrounding ISM, the outflow mass, M, and its kinetic energy, Ekin. For all calculations, we use the HCO+ (1−0) emission, which is found to be a good tracer of the molecular outflow (Sect. 3.1).
To measure the force of the DR21 Main outflow, we use the so-called separation method introduced in van der Marel et al. (2013), where the outflow force is calculated as:
![Mathematical equation: $ {F_{{\rm{HC}}{{\rm{O}}^{\rm{ + }}}}} = {c_3} \times {{K\left( {\sum\limits_j {{{\left[ {\int_{{\upsilon _{{\rm{in}}}}}^{{\upsilon _{{\rm{out}}}},j} {T\left( {\upsilon '} \right)\upsilon '{\rm{d}}\upsilon '} } \right]}_j}} } \right){\upsilon _{\max }}} \over {{R_{{\rm{lobe}}}}}}. $](/articles/aa/full_html/2023/11/aa46825-23/aa46825-23-eq2.png) (1)
(1)
Here, c3 is a correction factor for a given inclination angle of the outflow (Table 3), Κ is a conversion factor between the line-integrated intensity and the molecular gas mass, the integral  corresponds to the velocity-weighted integrated intensity, υmax is the maximum line-of-sight velocity in the outflow lobe, and Rlobe is the length of the outflow lobe, while the sum runs over all pixels (j) that are part of the outflow. The conversion factor Κ (see Appendix C of van der Marel et al. 2013) is given by:
![Mathematical equation: $ K = \mu {m_{\rm{H}}}A{{8\pi {k_{\rm{B}}}{v^2}} \over {h{c^3}{A_{{\rm{ul}}}}}}\left[ {{{{{\rm{H}}_2}} \over {{\rm{HC}}{{\rm{O}}^ + }}}} \right]{{Q\left( {{T_{{\rm{exc}}}}} \right)} \over {{g_{\rm{u}}}}}{{\rm{e}}^{{E_{\rm{u}}}/{T_{{\rm{exc}}}}}}, $](/articles/aa/full_html/2023/11/aa46825-23/aa46825-23-eq4.png) (2)
(2)
where μ is the mean molecular weight, mH is the hydrogen mass, A is the observed area of the outflow, [H2/HCO+] is the abundance ratio between H2 and HCO+, Q(Texc) is the partition function at a specific excitation temperature Texc, gu is the degeneracy of the upper level of the observed transition, Eu is the upper-level energy in Kelvin, ν is the frequency of the observed transition in Hz, c is the speed of light, kB is Boltzmann’s constant, h is Planck’s constant, and Aul is the Einstein A coefficient for the transition in s−1. We assume a single excitation temperature of 40 Κ (Garden et al. 1991b). The abundance ratio of H2 over HCO+ in high-mass star-forming regions has been found to range from 2 × 10⁹ down to 3 × 10⁷ (Godard et al. 2010; Gerner et al. 2014). In the present work, we adopt an abundance ratio of H2 over HCO+ of 1.6 × 10⁸ (Garden & Carlstrom 1992), which is well within the above range and was estimated for DR21 Main. The corresponding value of the partition function and the remaining molecular data are taken from Splatalogue2 using the CDMS catalog (Müller et al. 2001).
The inner velocities for the integration (υin) are −5 and 5 km s−1 relative to the source velocity for the blueshifted and redshifted parts of the emission, excluding the innermost 10 km s−1 in order to avoid contamination from the cloud material.
The calculation of the length of the outflow lobe, Rlobe, requires information about the point of origin of the outflow. Here, we take this to be the position of the dense core DR21-1 from Cao et al. (2019; see also core N46 in Motte et al. 2007), which is located close to the center of the two outflow lobes and at the DR21 ridge. The location of the core also agrees well with the peak of the 3 mm continuum emission, as shown in Fig. 8. Higher-resolution observations of this area would be required to determine the exact location and nature of the driving source, which is outside of the scope of this paper.
The gas mass carried by the outflow is obtained as
![Mathematical equation: $ M = K\left( {\sum\limits_j {{{\left[ {\int_{{\upsilon _{{\rm{in}}}}}^{{\upsilon _{{\rm{out}}}},j} {T\left( {\upsilon '} \right){\rm{d}}\upsilon '} } \right]}_j}} } \right). $](/articles/aa/full_html/2023/11/aa46825-23/aa46825-23-eq5.png) (3)
(3)
Subsequently, the time-averaged kinetic energy of the outflow is calculated as
 (4)
(4)
and its momentum as
![Mathematical equation: $ P = K\left( {\sum\limits_j {{{\left[ {\int_{{\upsilon _{{\rm{in}}}}}^{{\upsilon _{{\rm{out}}}},j} {T\left( {\upsilon '} \right)\upsilon '{\rm{d}}\upsilon '} } \right]}_j}} } \right). $](/articles/aa/full_html/2023/11/aa46825-23/aa46825-23-eq7.png) (5)
(5)
The dynamical time, which is an estimate of the lifetime of the outflow, is then taken as
 (6)
(6)
This, in turn, allows the calculation of the mass loss rate:
 (7)
(7)
and the power of the outflow:
 (8)
(8)
The calculations are performed for the east and west outflow lobes, and for the redshifted and blueshifted emission, separately. The resulting outflow properties are presented in Table 4.
The outflow mass and kinetic energy can be compared with the results from Garden & Carlstrom (1992), where observations of the transition of HCO+ (1−0) were analyzed. Here, we use the high-velocity component from Garden et al. (1991b) and scale it to the same distance as DR21, as adopted in this work. The outflow mass for the high-velocity component, of namely ~120 M⊙ (see Table 4), is a factor of 2−5 higher than the corresponding outflow mass in Garden & Carlstrom (1992). The outflow extent and the area covered by the observations are similar in both studies; Garden et al. (1991b) obtain an Rlobe of ~1.7pc. Therefore, the difference is likely due to the velocity limits adopted in Garden & Carlstrom (1992), which exclude a significant part of gas mass at velocities close to the source velocity (υin from −12.5 to −42.5 km s−1). Moreover, the outflow kinetic energy, which accounts for the relevant range of velocities, is fully consistent: Ekin of 5.0 × 1047 erg (Table 4) is within the range of ~2.5−5.0 × 1047 erg reported in Garden & Carlstrom (1992) using HCO+ and about a factor of 4 lower than the total energy measured using CO (Garden et al. 1991b). We provide a more thorough discussion of the DR21 Main outflow properties with respect to both low- and high-mass protostars in Sect. 4.2.
The calculation of the outflow parameters includes a few assumptions that need to be addressed. First, the conversion factor K is accurate only when the observed emission is optically thin. In the case of DR21 Main, the HCO+ emission is optically thin in the outflow lobes, but not in the central area (Garden & Carlstrom 1992). Using our H13CO+ observations, which appear to trace the dense ridge (Sect. 3), we estimate a τ of 12.5 for the DR21 Main center. To this end, the central region is excluded from the calculation of the outflow parameters. Similarly, gas with velocities within ~5 km s−1 of the velocity of the N–S filament is also excluded. We note that, even though a significant part of the outflow material is often found at low velocities, its impact on F or Ekin is not as significant due to the dependence of those parameters on υ2. Second, the correction factor of inclination angle, c3, is available only for the inclination angles of 10°, 30°, 50°, and 70° (Table 3). In this work, c3 of 3.8 is assumed (corresponding to 70°), but as the outflow of DR21 Main appears to be close to 90° (see Sect. 3.2), the correction is most likely underestimated by a factor of ≲ 2. Finally, we assume a uniform excitation temperature of the gas along the outflow, which likely differs by a factor of a few depending on the position of line emission. The increase in excitation temperature from 40 to 80K would lead to an increase in the K parameter by a factor of ~1.9. The variations of Tex along the outflow are therefore not expected to significantly impact the results.
In summary, the parameters of the DR21 Main outflow calculated using HCO+ provide a useful diagnostic of outflow energetics. The calculations are consistent with previous work by Garden & Carlstrom (1992), who used the same tracer and transition. Due to the optical thickness of the emission and the adopted velocity limits, the mass of the outflow as well as the related parameters are lower limits to the actual parameters.
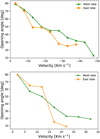 |
Fig. 7 Opening angle of the DR21 Main outflow as a function of velocity using HCO+ 1−0 line profiles. The angles are calculated every 5 km s−1 from the source velocity up to υmax = 22,32,−38, and −48 km s−1 for the east-red, west-red, east-blue, and west-blue outflow lobes, respectively. Top: opening angles for blueshifted outflow velocities. Bottom: opening angles for redshifted outflow velocities. |
Inclination correction factors used in the different methods of outflow force calculation.
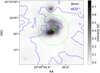 |
Fig. 8 Image showing the 3 mm continuum emission in the area of DR21 Main. The peak of the continuum emission is marked with a red star, while the green circle marks the location of the dense core DR21-1 (Cao et al. 2019), and the green dashed line the FWHM. Blue contours mark the integrated HCO+ intensity (−50 to 50 km s−1), while the beam of the continuum observations is shown with the red ellipse. |
Outflow parameters of the DR21 Main outflow.
4 Discussion
4.1 The nature of the DR21 Main outflow
The nature of the DR21 Main outflow is still a topic of discussion because it has been proposed to belong to the class of explosive outflows (Zapata et al. 2013). Detailed analysis of the morphology and the kinematics of the outflow using HCO+ observations reveals a rather well-defined bipolar outflow structure reminiscent of that of a typical protostellar outflow (Sect. 3.2). The strong overlap of redshifted and blueshifted HCO+ emission is indeed a property attributed to explosive outflows (Zapata et al. 2017); however, this can also appear in the case of a bipolar outflow that extends along the plane of the sky with the redshifted and blueshifted emission arising from the sideways expansion of the outflow lobes. Additionally, the apparent decrease in the opening angle of the DR21 Main outflow with increasing velocity (see Fig. 7) is characteristic of bipolar outflows that are powered by a narrow collimated jet; nevertheless, this scenario seems unlikely in the case of explosive outflows.
Figure 9 shows a side-by-side comparison of local intensity peaks at multiple velocity steps between the DR21 Main outflow and the Orion KL outflow. Here, we used the HCO+ data presented in this work for the DR21 Main outflow, and archival ALMA CO (2−1) data for Orion (Project ID: 2013.1.00546.S, PI: John Bally, Bally et al. (2017)). The emission in Orion (right) can be seen to consist of multiple, well-defined filament-like structures, which also display clear velocity gradients along their length with higher absolute velocities being further away from the point of origin of the outflow. This behavior is probably the most distinctive characteristic of explosive outflows and is absent in the case of the DR21 Main outflow (left). More precisely, in DR21 Main, there are very few distinct filament-like structures, and those present do not show any significant velocity gradients along their length. Moreover, the structures that do exist appear to be tracing the cavity walls of the outflow lobes, contrary to the more random distribution that the filament-like structures have in Orion. However, we note that DR21, at 1.5 kpc (Rygl et al. 2012), is located significantly further away than Orion KL, which lies at ~400pc (Menten et al. 2007; Kounkel et al. 2017), which means that the physical scales of the two outflows in Fig. 9 are significantly different.
Taking all of the above into consideration, it appears that the outflow of DR21 Main more closely resembles a typical bipolar outflow driven by a protostar rather than an explosive outflow. However, the observations presented here do not reveal a single compact emission that could be associated with the driving source (Appendix A). Further observations are required in order to discern the protostar or protostellar system behind such an exceptionally powerful bipolar outflow.
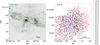 |
Fig. 9 Distribution of gas velocities associated with the outflows in DR21 (left) and Orion KL (right, Bally et al. 2017). Each point shows a local intensity peak of the HCO+ emission (above 2 σ) integrated in velocity steps of 5 km s−1. The color of the points signifies the corresponding velocity steps and is the same for the two plots. Background grayscale shows the integrated HCO+ (left panel) and CO emission (right panel) over the entire velocity range of the outflows (from −70 to 70 km s−1 for DR21 Main and −100 to 100 km s−1 for Orion KL). |
4.2 Outflow energetics
Multiple correlations have been reported connecting the energetics of protostellar outflows with the properties of their driving sources. For example, the correlations of the outflow force with the envelope mass and bolometric luminosity are attributed to a connection between mass-accretion rate and outflow activity (Beuther et al. 2002; Duarte-Cabral et al. 2013; Mottram et al. 2017). The existence of such correlations allows a direct comparison of the properties of the DR21 Main outflow with those of other protostellar and explosive outflows.
Figure 10 shows the comparison of the outflow force of the DR21 Main outflow and those of low-, intermediate-, and highmass protostars (Beuther et al. 2002; van Kempen et al. 2009; van der Marel et al. 2013; Yildiz et al. 2015; Maud et al. 2015; Mottram et al. 2017; Li et al. 2020; Skretas & Kristensen 2022). We calculate the Pearson coefficients and the corresponding significance (σ) for both correlations (see e.g., Marseille et al. 2010). The outflow forces of high-mass protostars are found to correlate strongly both with their envelope masses (6.1σ) and bolometric luminosities (6.5σ); the correlation extends also to lower masses. The source sample from Li et al. 2020 represents sources at very early stages of their evolution (70 μm dark clumps), and these are therefore expected to have a low Lbol/Menv ratio, which would explain their relatively large envelope masses with respect to other sources of similar energetic parameters.
The outflow force of DR21 is higher than those of other high-mass protostars, including the other two explosive-outflow candidates: G5.89-0.39 (Lbol of 4.1× 10⁴ L⊙, Menv of 140 M⊙, van der Tak et al. 2013; Karska et al. 2014) and Orion BN/KL (Lbol of 5 × 10⁴ L⊙, Menv of 150 M⊙, Downes et al. 1981; Genzel & Stutzki 1989). For DR21, we adopt Lbol of 1.0 × 10⁴ L⊙ and Menv of 1355 M⊙, which account for the new distance to the source and the peak of the spectral energy distribution (Cao et al. 2019).
DR21 also shows enhanced mass-outflow rate and outflow kinetic luminosity, but falls within the range of other high-mass protostars in terms of outflow mass, power, and kinetic energy (Appendix C). Those differences are therefore the largest for parameters involving the outflow dynamical time, and as such are related with υmax, which in turn depends on the inclination angle. However, the inclination of DR21 on the sky could only introduce a factor of approximately four difference in the derived parameters, which is much less than the enhancement in outflow properties with respect to typical high-mass protostars.
Orion BN/KL and G5.89-0.39 also show relatively high mass-outflow rates, kinetic energies, and luminosities, which might suggest these could be common characteristics of explosive-outflow candidates. Assuming that the underlying physical mechanism for explosive outflows is different from that for typical outflows, there is presently no theoretical expectation that explosive outflows should follow the F–Menv and F–Lbol correlations (Fig. 10). However, the sample of these objects is too small for conclusions to be drawn.
The DR21 Main outflow is found to be a bipolar outflow (Sect. 4.1). Therefore, the enhanced outflow force of DR21 might indicate the presence of scatter for the high-mass sources similar to that measured in the outflow properties of low-mass YSOs (Fig. 10). In any case, the high outflow force of the DR21 Main outflow is consistent with it being one of the most powerful outflows in the Galaxy.
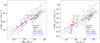 |
Fig. 10 Outflow force vs. envelope mass of the driving source for various protostellar sources. Right-facing triangles represent low-mass sources from Mottram et al. (2017), left-facing triangles mark sources taken from Yildiz et al. (2015), and upward-pointing triangles are from van der Marel et al. (2013); Class I sources are marked in blue, and Class 0 in red. Black diamonds mark intermediate-mass sources (van Kempen et al. 2009), gray squares mark high-mass sources from Maud et al. (2015), green “×” symbols mark high-mass sources from Beuther et al. (2002), and black stars mark high-mass sources in Cygnus (Skretas & Kristensen 2022). The red crosses mark a sample of high-mass 70µm dark sources (Li et al. 2020). The cyan star marks G5.89-0.39, the magenta one marks Orion KL, and the green one represents the DR21 Main outflow. The dashed black line shows the best fit to the outflow force–envelope mass correlation for all sources, while red and gray show the best fits for the low- and high-mass sources, respectively. |
4.3 Interaction at the western outflow lobe
Outflow activity from protostars can impact the structure and chemistry of their parental and/or nearby dense cores (e.g., van Kempen et al. 2009; Lis et al. 2016; Kahle et al. 2023). The energetic outflow from DR21 Main heavily interacts with its surroundings, and creates an “interaction region” in the western outflow lobe, which has been associated with a collisionally excited Class I methanol maser (Plambeck & Menten 1990). Molecular line emission from CASCADE allows us to pin-point the detailed characteristics of the outflow-cloud interaction.
The interaction region shows various patterns of molecular line emission with HCN and H2CO peaking in its eastern part, and HNC and N2H+ emission extending to the western and outer parts of the outflow lobe (Fig. 11). The SiO emission shows a compact pattern associated most closely with H2CO, suggesting the presence of shocks in the interface between for example HCN and N2H+ gas.
We investigate the line emission across the interaction regions in Figs. 12–17. HCO+ emission peaks in the interaction region, and is followed by H2CO tracing warm gas and N2H+, which is sensitive to the sharp increase in cold gas density (Fig. 12). In the case of HCO+, it is likely that some outflowing material is deflected into the line of sight, giving rise to the strong, high velocity, blue-shifted emission detected in this area (Fig. 3). This velocity shift is also clearly seen in the first moment of HCO+, which shows that its emission in the area of the dense structure is mainly redshifted (Fig. 13). A likely explanation could be that the dense structure is located closer to the observer along the line of sight and is therefore interacting mostly with the blueshifted part of the outflow. The blueshifted emission indeed shows a high-velocity component elongated almost vertical to the outflow axis, while the redshifted emission appears almost unperturbed (Fig. 3).
The H2CO emission displays a sharp increase in the interaction area followed by a significant decrease deeper into the dense structure (also shown in Fig. 12). Such an increase is likely related to the enhanced gas temperatures in the interaction region, which lead to sputtering of H2CO from the dust grains (Benedettini et al. 2013). Alternatively, the H2CO emission could be explained by shock chemistry (e.g., Viti et al. 2011), but the commonly predicted double-peaked structure is not resolved in our observations. On the other hand, it is also possible that averaging along the interaction front leads to the blending of line emission, making this feature less apparent. A close association of H2CO with the SiO emission tracing shocks (Fig. 14) favors the scenario in which H2CO traces not only warm gas but also the location of active shocks, as was suggested by Li et al. (2022). The multiple peaks of SiO and H2CO likely arise because of averaging across the entire interaction front and the clumpy nature of SiO emission (see Fig. 11).
HCN and HNC show some differences along the interaction region (Fig. 15), which might reflect the changes in gas temperature (Hacar et al. 2020). The pattern of emission in HNC is similar to that of N2H+, whereas HCN closely follows H2CO. We refrain from using the Hacar et al. (2020) relation to calculate gas temperatures, because the HCN over HNC line ratios partly exceed the range where the experimental relation holds. Nevertheless, the ratio of the two species suggests that the temperature increases rapidly at the front of the interaction area and then drops steadily to a relatively low value. The ratio shows two peaks that follow the peaks in HCN intensity (Fig. 15), and are found close to but not exactly at the same location as the peaks of SiO. This suggests that HCN might also be enhanced in the warm gas behind the shock front (see e.g., Mirocha et al. 2021). In addition, the velocities of the gas traced by HCN and HNC also differ (Fig. 16). HNC has velocities close to that of the cloud, especially from the middle of the interaction area and into the dense structure, where its emission becomes significant. HCN on the other hand follows HCO+ and shows significant blueshifted emission, which becomes redshifted in the area dominated by the dense structure. The blueshifted peak appears deeper in the interaction area compared to that of HCO+, showing that they trace different material.
HCCCN emission is detected in the area of the dense structure, as expected based on previous studies (e.g., Morris et al. 1976; Churchwell et al. 1978). The slight enhancement of HCCCN abundance in the interaction region (Fig. 17) supports the findings of Benedettini et al. (2013) that HCCCN is formed in shocks.
The intensity of CCH shows a significant increase close to the center of the interaction region, which is likely due to UV radiation originating from the shocked material in the interaction region (e.g., Gratier et al. 2017; Bouvier et al. 2020; Chahine et al. 2022).
In contrast, HNCO is not detected in the interaction region, even though it is often associated with shocks. According to Yu et al. (2018), HNCO is preferentially enhanced in slow-moving shocks, but is destroyed in high-velocity shocks, which might indeed be the case for the energetic outflow from DR21.
Finally, we note here that, because of the irregular shape of the interaction front, the simplistic average along it adopted for the above analysis suffers from significant uncertainties. Still, it can offer an interesting qualitative look into the behavior of species across such an interaction.
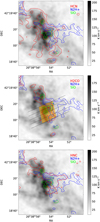 |
Fig. 11 Outflow–cloud interaction region in the western lobe of the DR2l Main outflow. The grayscale shows the integrated HCO+ emission between −50 and 50 km s−1 relative to the source velocity. Red contours show line emission of HCN (top), H2CO (middle), and HNC (bottom). Blue contours show the emission of N2H+ and green contours show the emission of SiO, in all panels. Contour levels are at 5, 10, and 20 σrms. The dashed black lines in the middle plot mark the lines used to calculate the average intensities and first moments across the interaction front presented in Figs. 12–17. The orange rectangle marks the area actively affected by the interaction as derived from these intensities. |
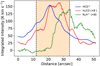 |
Fig. 12 Average integrated intensities of HCO+ (in blue), H2CO (in red), and N2H+ (in green) across the interaction region in the western lobe of DR2l. Intensities are integrated from −70 to 70, from −20 to 20, and from −20 to 10 km s−1 for HCO+, H2CO, and N2H+, respectively. The x-axis shows the distance in arcseconds covering the extent of the relevant region where the outflow interacts with a dense structure (marked also in Fig. 11). The orange rectangle shows the area actively affected by the interaction. The intensities for H2CO and N2H+ are scaled up by a factor of 8 in order for their distributions to be more easily comparable. |
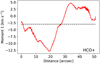 |
Fig. 13 First moment of HCO+ emission across the interaction front (see Fig. 12). The black dashed line marks the DR2l cloud velocity of υcloud = −3 km s−1. |
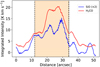 |
Fig. 14 Average integrated intensities of SiO (in blue) and H2CO (in red) across the interaction region in the western lobe of DR21. Intensities are integrated from −25 to 25 and from −20 to 20 km s−1 for SiO and H2CO, respectively. The SiO emission is scaled up by a factor of 2 for clarity. |
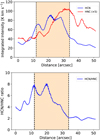 |
Fig. 15 HCN and HNC emission in the interaction region. Top: average integrated intensities of HCN (in blue) and HNC (in red) across the interaction region in the western lobe of DR21. Intensities are integrated from −35 to 35 and from −15 to 10 km s−1 for HCN and HNC, respectively. The HNC emission is scaled up by a factor of 5 for clarity. Bottom: ratio of HCN over HNC across the interaction region. |
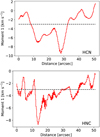 |
Fig. 16 First moment across the interaction front of the DR21 Main outflow and the dense structure located near the western outflow lobe plotted over the corresponding distance. The distance is measured from the outflow-dominated part and extends into the dense structure. The black dashed line marks the DR21 cloud velocity of υcloud = −3 km s−1. Top: For HCN emission Bottom: for HNC emission. |
5 Summary and conclusions
This work presents the results of CASCADE observations in the area of the DR2l Main outflow covering several molecular tracers, including HCO+ HCN, HNC, N2H+, H2CO, and CCH at high spatial (~3″) and spectral resolution (~0.8 km s−1). These molecular tracers are split into three separate categories according to their morphology, tracing the outflow (HCO+ and HCN), the DR21 ridge (13CS, CCH, H2CO, H13CO+, HCCCN (10–9), HCCCN (8–7), HNC, N2H+), and localized emission (e.g., CH3CN (4k–3k), CH3CN (5k–4k), CH3OH, DCN, DCO+, DNC, Hα41, NH2D, SiO).
Based on the HCO+ emission, the DR21 Main outflow is found to mostly resemble a typical bipolar outflow rather than an explosive one, as its emission shows two well-structured lobes that get progressively more collimated at higher velocities and lack the filament-like structures that are prevalent in established explosive outflows.
Adapting the separation method, and applying it to HCO+ emission allowed us to estimate the energetic parameters (outflow force F = 0.56 M⊙ km yr−1 s−1, mass M = 124 M⊙, and kinetic energy Ekin = 5 ×1047 erg) of the outflow. Comparison with other protostellar sources showed that the outflow force of the DR21 Main outflow is about an order of magnitude higher than that of outflows originating from sources of similar envelope mass. However, it remains uncertain as to whether the outflow of DR21 Main represents an upper limit of typical protostellar outflows or is powered by a different mechanism.
Finally, a dense molecular structure was detected near the western lobe of the outflow. The detection of SiO and H2CO emission in this area shows that there is ongoing interaction between the outflow and this dense structure. We used this information to perform an analysis of the behavior of different molecular species across such an interaction and found them to be in good agreement with the results of recent modeling predictions and observations of shocked regions.
Overall, the results presented in this paper firmly establish the outflow of DR21 Main as one of the most interesting cases of bipolar, protostellar outflow, given its exceptional size and power. Additionally, the CASCADE observations offer valuable information as to the chemistry of the interaction region, but further and more detailed modeling is required in order to properly constrain the chemistry that takes place in this location.
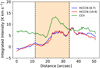 |
Fig. 17 Average integrated intensities of HCCCN J = 8−7 (in blue), HCCCN J = 10−9 (in red), and CCH (in green) across the interaction region in the western lobe of DR21. Intensities are integrated from −10 to 5 km s−1 for all three lines. |
Acknowledgements
The authors would like to thank the anonymous referee for his suggestions and constructive comments that improved the overall quality of the manuscript. The authors are also grateful to the staff at the NOEMA and Pico Veleta observatories for their support of these observations. We thank in particular P. Chaudet, operator at the NOEMA observatory, for his motivation and dedication in developing and testing the advanced mosaic observing procedures employed in this project. This work is based on observations carried out under project number L19MA with the IRAM NOEMA Interferometer and [145-19] with the 30 m telescope. IRAM is supported by INSU/CNRS (France), MPG (Germany) and IGN (Spain). A.K. acknowledges support from the Polish National Agency for Academic Exchange grant No. BPN/BEK/2021/1/00319/DEC/1. H.B. acknowledges support from the European Research Council under the Horizon 2020 Framework Program via the ERC Con-solidator Grant CSF-648505 and from the Deutsche Forschungsgemeinschaft in the Collaborative Research Center (SFB 881) “The Milky Way System” (sub-project B1). A.G. acknowledges support from NSF AAG 2008101 and NSF CAREER 2142300. D.S. acknowledges support from the European Research Council under the Horizon 2020 Framework Program via the ERC Advanced Grant No. 832428-Origins.
Appendix A Integrated intensity contour maps
Figures A.1–A.6 show contour maps of the integrated intensity of all observed molecules in the area of the DR21 Main outflow. The detected molecules can broadly be separated in three categories (see Section 3.1, Table 2): (i) those tracing the outflow, (ii) those tracing the dense ridge, and (iii) those displaying localized and fragmented emission. The emission of the rare isotopologs (e.g., H13CO+, H13CN, HN13C, and 13CS) appears to trace the high-density material along the DR21 ridge. In contrast to the patterns of emission in H13CO+ and H13CN, the emission in their 12C counterparts is associated with outflowing material. The difference in behavior between the main 12C and their 13C isotopologs is likely due to the low abundances of rare isotopologs in the high-velocity gas.
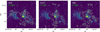 |
Fig. A.1 UKIRT/WFCAM continuum image of the DR21 Main region at 2.2 µm and the line emission in key gas tracers observed as part of CASCADE. White contours mark the 5σ HCN (left), H2CO (middle), and HNC (right) emission. |
Appendix B Line profiles in detected molecules
Figures B.1–B.4 show spectra of the different molecular lines observed in CASCADE. The spectra are averaged over the east lobe, the center, and the western lobe (see Fig. 1).
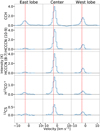 |
Fig. B.1 Similar to 2, but for CCH, HCCCN (10−9), HCCCN (8−7), H13CO, and 13CS |
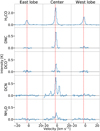 |
Fig. B.2 Similar to 2, but for H2CO, DNC, DCO+, DCN, and NH2D |
Appendix C Correlation plots
Figures C.1–C.5 show correlation plots between the different outflow parameters and the bolometric luminosity and envelope mass of their driving sources.
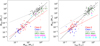 |
Fig. C.1 Outflow mass versus envelope mass and bolometric luminosity. The labels are the same as in Fig. 10. |
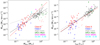 |
Fig. C.2 Outflow mass rate versus envelope mass and bolometric luminosity. The labels are the same as in Fig. 10. |
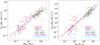 |
Fig. C.3 Outflow momentum versus envelope mass and bolometric luminosity. The labels are the same as in Fig. 10. |
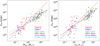 |
Fig. C.4 Outflow kinetic energy versus envelope mass and bolometric luminosity. The labels are the same as in Fig. 10. |
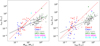 |
Fig. C.5 Outflow kinetic luminosity versus envelope mass and bolometric luminosity. The labels are the same as in Fig. 10. |
References
- Arce, H. G., & Sargent, A. I. 2004, ApJ, 612, 342 [NASA ADS] [CrossRef] [Google Scholar]
- Arce, H. G., & Sargent, A. I. 2005, ApJ, 624, 232 [NASA ADS] [CrossRef] [Google Scholar]
- Arce, H. G., & Sargent, A. I. 2006, ApJ, 646, 1070 [NASA ADS] [CrossRef] [Google Scholar]
- Arce, H. G., Shepherd, D., Gueth, F., et al. 2007, in Protostars and Planets V, eds. B. Reipurth, D. Jewitt, & K. Keil, 245 [Google Scholar]
- Bachiller, R., & Tafalla, M. 1999, in NATO Advanced Study Institute (ASI)Series C, 540, The Origin of Stars and Planetary Systems, eds. C. J. Lada & N. D. Kylafis, 227 [NASA ADS] [CrossRef] [Google Scholar]
- Bally, J. 2016, ARA&A, 54, 491 [Google Scholar]
- Bally, J., & Lada, C. J. 1983, ApJ, 265, 824 [NASA ADS] [CrossRef] [Google Scholar]
- Bally, J., & Zinnecker, H. 2005, AJ, 129, 2281 [NASA ADS] [CrossRef] [Google Scholar]
- Bally, J., Ginsburg, A., Arce, H., et al. 2017, ApJ, 837, 60 [Google Scholar]
- Benedettini, M., Molinari, S., Testi, L., & Noriega-Crespo, A. 2004, MNRAS, 347, 295 [NASA ADS] [CrossRef] [Google Scholar]
- Benedettini, M., Viti, S., Codella, C., et al. 2013, MNRAS, 436, 179 [Google Scholar]
- Beuther, H., & Shepherd, D. 2005a, in Astrophysics and Space Science Library, 324, eds. M. S. N. Kumar, M. Tafalla, & P. Caselli, 105 [NASA ADS] [CrossRef] [Google Scholar]
- Beuther, H., & Shepherd, D. 2005b, in Astrophysics and Space Science Library, 324, eds. M. S. N. Kumar, M. Tafalla, & P. Caselli, 105 [NASA ADS] [CrossRef] [Google Scholar]
- Beuther, H., Schilke, P., Sridharan, T. K., et al. 2002, A&A, 383, 892 [NASA ADS] [CrossRef] [EDP Sciences] [Google Scholar]
- Beuther, H., Wyrowski, F., Menten, K. M., et al. 2022, A&A, 665, A63 [NASA ADS] [CrossRef] [EDP Sciences] [Google Scholar]
- Blandford, R. D., & Payne, D. G. 1982, MNRAS, 199, 883 [CrossRef] [Google Scholar]
- Bontemps, S., Andre, P., Terebey, S., & Cabrit, S. 1996, A&A, 311, 858 [NASA ADS] [Google Scholar]
- Bouvier, M., López-Sepulcre, A., Ceccarelli, C., et al. 2020, A&A, 636, A19 [NASA ADS] [CrossRef] [EDP Sciences] [Google Scholar]
- Burkhardt, A. M., Shingledecker, C. N., Le Gal, R., et al. 2019, ApJ, 881, 32 [Google Scholar]
- Cabrit, S., & Bertout, C. 1990, ApJ, 348, 530 [CrossRef] [Google Scholar]
- Cabrit, S., & Bertout, C. 1992, A&A, 261, 274 [Google Scholar]
- Cao, Y., Qiu, K., Zhang, Q., et al. 2019, ApJS, 241, 1 [Google Scholar]
- Caselli, P., Benson, P. J., Myers, P. C., & Tafalla, M. 2002, ApJ, 572, 238 [Google Scholar]
- Chahine, L., López-Sepulcre, A., Podio, L., et al. 2022, A&A, 667, A6 [NASA ADS] [CrossRef] [EDP Sciences] [Google Scholar]
- Churchwell, E., Winnewisser, G., & Walmsley, C. M. 1978, A&A, 67, 139 [NASA ADS] [Google Scholar]
- Cruz-González, I., Salas, L., & Hiriart, D. 2007, Rev. Mexicana Astron. Astrofis., 43, 337 [Google Scholar]
- Davis, C. J., Kumar, M. S. N., Sandell, G., et al. 2007, MNRAS, 374, 29 [Google Scholar]
- Dickel, J. R., Dickel, H. R., & Wilson, W. J. 1978, ApJ, 223, 840 [Google Scholar]
- Downes, T. P., & Cabrit, S. 2007, A&A, 471, 873 [NASA ADS] [CrossRef] [EDP Sciences] [Google Scholar]
- Downes, D., Genzel, R., Becklin, E. E., & Wynn-Williams, C. G. 1981, ApJ, 244, 869 [CrossRef] [Google Scholar]
- Duarte-Cabral, A., Bontemps, S., Motte, F., et al. 2013, A&A, 558, A125 [NASA ADS] [CrossRef] [EDP Sciences] [Google Scholar]
- Flower, D. R., & Pineau Des Forêts, G. 2010, MNRAS, 406, 1745 [NASA ADS] [Google Scholar]
- Frank, A., Ray, T. P., Cabrit, S., et al. 2014, in Protostars and Planets VI, eds. H. Beuther, R. S. Klessen, C. P. Dullemond, & T. Henning, 451 [Google Scholar]
- Fuente, A., Martin-Pintado, J., Bachiller, R., Neri, R., & Palla, F. 1998, A&A, 334, 253 [NASA ADS] [Google Scholar]
- Garden, R. P., & Carlstrom, J. E. 1992, ApJ, 392, 602 [CrossRef] [Google Scholar]
- Garden, R., Geballe, T. R., Gatley, I., & Nadeau, D. 1986, MNRAS, 220, 203 [NASA ADS] [Google Scholar]
- Garden, R. P., Geballe, T. R., Gatley, I., & Nadeau, D. 1991a, ApJ, 366, 474 [CrossRef] [Google Scholar]
- Garden, R. P., Hayashi, M., Gatley, I., Hasegawa, T., & Kaifu, N. 1991b, ApJ, 374, 540 [NASA ADS] [CrossRef] [Google Scholar]
- Genzel, R., & Stutzki, J. 1989, ARA&A, 27, 41 [NASA ADS] [CrossRef] [Google Scholar]
- Gerner, T., Beuther, H., Semenov, D., et al. 2014, A&A, 563, A97 [NASA ADS] [CrossRef] [EDP Sciences] [Google Scholar]
- Godard, B., Falgarone, E., Gerin, M., Hily-Blant, P., & de Luca, M. 2010, A&A, 520, A20 [NASA ADS] [CrossRef] [EDP Sciences] [Google Scholar]
- Gratier, P., Bron, E., Gerin, M., et al. 2017, A&A, 599, A100 [CrossRef] [EDP Sciences] [Google Scholar]
- Gueth, F., & Guilloteau, S. 1999, A&A, 343, 571 [NASA ADS] [Google Scholar]
- Gueth, F., Guilloteau, S., Dutrey, A., & Bachiller, R. 1997, A&A, 323, 943 [NASA ADS] [Google Scholar]
- Gusdorf, A., Cabrit, S., Flower, D. R., & Pineau Des Forêts, G. 2008, A&A, 482, 809 [NASA ADS] [CrossRef] [EDP Sciences] [Google Scholar]
- Guzmán Ccolque, E., Fernández-López, M., Zapata, L. A., & Baug, T. 2022, ApJ, 937, 51 [CrossRef] [Google Scholar]
- Hacar, A., Bosman, A. D., & van Dishoeck, E. F. 2020, A&A, 635, A4 [NASA ADS] [CrossRef] [EDP Sciences] [Google Scholar]
- Hsieh, C.-H., Arce, H. G., Li, Z.-Y., et al. 2023, ApJ, 947, 25 [NASA ADS] [CrossRef] [Google Scholar]
- Jørgensen, J. K., Schöier, F. L., & van Dishoeck, E. F. 2004, A&A, 416, 603 [Google Scholar]
- Kahle, K. A., Hernández-Gómez, A., Wyrowski, F., & Menten, K. M. 2023, A&A, 673, A143 [NASA ADS] [CrossRef] [EDP Sciences] [Google Scholar]
- Karska, A., Herpin, F., Bruderer, S., et al. 2014, A&A, 562, A45 [NASA ADS] [CrossRef] [EDP Sciences] [Google Scholar]
- Kaufman, M. J., & Neufeld, D. A. 1996, ApJ, 456, 611 [NASA ADS] [CrossRef] [Google Scholar]
- Kounkel, M., Hartmann, L., Loinard, L., et al. 2017, ApJ, 834, 142 [Google Scholar]
- Leung, H. O., & Thaddeus, P. 1992, ApJS, 81, 267 [NASA ADS] [CrossRef] [Google Scholar]
- Li, S., Sanhueza, P., Zhang, Q., et al. 2020, ApJ, 903, 119 [Google Scholar]
- Li, S., Sanhueza, P., Lu, X., et al. 2022, ApJ, 939, 102 [CrossRef] [Google Scholar]
- Lis, D. C., Wootten, H. A., Gerin, M., et al. 2016, ApJ, 827, 133 [NASA ADS] [CrossRef] [Google Scholar]
- Lovas, F. J. 2004, J. Phys. Chem. Ref. Data, 33, 177 [NASA ADS] [CrossRef] [Google Scholar]
- Machida, M. N. 2014, ApJ, 796, L17 [CrossRef] [Google Scholar]
- Marseille, M. G., van der Tak, F. F. S., Herpin, F., & Jacq, T. 2010, A&A, 522, A40 [NASA ADS] [CrossRef] [EDP Sciences] [Google Scholar]
- Martin-Pintado, J., Bachiller, R., & Fuente, A. 1992, A&A, 254, 315 [NASA ADS] [Google Scholar]
- Maud, L. T., Moore, T. J. T., Lumsden, S. L., et al. 2015, MNRAS, 453, 645 [Google Scholar]
- Menten, K. M., Reid, M. J., Forbrich, J., & Brunthaler, A. 2007, A&A, 474, 515 [NASA ADS] [CrossRef] [EDP Sciences] [Google Scholar]
- Mirocha, A., Karska, A., Gronowski, M., et al. 2021, A&A, 656, A146 [NASA ADS] [CrossRef] [EDP Sciences] [Google Scholar]
- Morris, M., Turner, B. E., Palmer, P., & Zuckerman, B. 1976, ApJ, 205, 82 [CrossRef] [Google Scholar]
- Motte, F., Bontemps, S., Schilke, P., et al. 2007, A&A, 476, 1243 [NASA ADS] [CrossRef] [EDP Sciences] [Google Scholar]
- Mottram, J. C., van Dishoeck, E. F., Kristensen, L. E., et al. 2017, A&A, 600, A99 [NASA ADS] [CrossRef] [EDP Sciences] [Google Scholar]
- Müller, H. S. P., Thorwirth, S., Roth, D. A., & Winnewisser, G. 2001, A&A, 370, L49 [Google Scholar]
- Myers, P. C., Heyer, M., Snell, R. L., & Goldsmith, P. F. 1988, ApJ, 324, 907 [Google Scholar]
- Nony, T., Motte, F., Louvet, F., et al. 2020, A&A, 636, A38 [NASA ADS] [CrossRef] [EDP Sciences] [Google Scholar]
- Nyman, L. A. 1983, A&A, 120, 307 [NASA ADS] [Google Scholar]
- Offner, S. S. R., Lee, E. J., Goodman, A. A., & Arce, H. 2011, ApJ, 743, 91 [CrossRef] [Google Scholar]
- Plambeck, R. L., & Menten, K. M. 1990, ApJ, 364, 555 [Google Scholar]
- Rabenanahary, M., Cabrit, S., Meliani, Z., & Pineau des Forêts, G. 2022, A&A, 664, A118 [NASA ADS] [CrossRef] [EDP Sciences] [Google Scholar]
- Rivera-Ortiz, P. R., Rodríguez-González, A., Cantó, J., & Zapata, L. A. 2021, ApJ, 916, 56 [NASA ADS] [CrossRef] [Google Scholar]
- Rygl, K. L. J., Brunthaler, A., Sanna, A., et al. 2012, A&A, 539, A79 [NASA ADS] [CrossRef] [EDP Sciences] [Google Scholar]
- Santiago-García, J., Tafalla, M., Johnstone, D., & Bachiller, R. 2009, A&A, 495, 169 [NASA ADS] [CrossRef] [EDP Sciences] [Google Scholar]
- Schilke, P., Walmsley, C. M., Pineau des Forets, G., & Flower, D. R. 1997, A&A, 321, 293 [NASA ADS] [Google Scholar]
- Schilke, P., Pineau des Forêts, G., Walmsley, C. M., & Martín-Pintado, J. 2001, A&A, 372, 291 [NASA ADS] [CrossRef] [EDP Sciences] [Google Scholar]
- Schneider, N., Csengeri, T., Bontemps, S., et al. 2010, A&A, 520, A49 [CrossRef] [EDP Sciences] [Google Scholar]
- Skretas, I. M., & Kristensen, L. E. 2022, A&A, 660, A39 [NASA ADS] [CrossRef] [EDP Sciences] [Google Scholar]
- van der Marel, N., Kristensen, L. E., Visser, R., et al. 2013, A&A, 556, A76 [NASA ADS] [CrossRef] [EDP Sciences] [Google Scholar]
- van der Tak, F. F. S., Chavarría, L., Herpin, F., et al. 2013, A&A, 554, A83 [NASA ADS] [CrossRef] [EDP Sciences] [Google Scholar]
- van Kempen, T. A., van Dishoeck, E. F., Güsten, R., et al. 2009, A&A, 507, 1425 [NASA ADS] [CrossRef] [EDP Sciences] [Google Scholar]
- Velusamy, T., & Langer, W. D. 1998, Nature, 392, 685 [CrossRef] [Google Scholar]
- Viti, S., Jimenez-Serra, I., Yates, J. A., et al. 2011, ApJ, 740, L3 [NASA ADS] [CrossRef] [Google Scholar]
- Walmsley, C. M., Pineau des Forêts, G., & Flower, D. R. 1999, A&A, 342, 542 [NASA ADS] [Google Scholar]
- Warren, S. J., Cross, N. J. G., Dye, S., et al. 2007, arXiv e-prints, Astro [arXiv:astro-ph/0703037] [Google Scholar]
- Wilson, T. L., & Mauersberger, R. 1990, A&A, 239, 305 [NASA ADS] [Google Scholar]
- Wu, Y., Wei, Y., Zhao, M., et al. 2004, A&A, 426, 503 [NASA ADS] [CrossRef] [EDP Sciences] [Google Scholar]
- Yildiz, U. A., Kristensen, L. E., van Dishoeck, E. F., et al. 2015, A&A, 576, A109 [NASA ADS] [CrossRef] [EDP Sciences] [Google Scholar]
- Yu, N.-P., Xu, J.-L., & Wang, J.-J. 2018, Res. Astron. Astrophys., 18, 015 [CrossRef] [Google Scholar]
- Zapata, L. A., Schmid-Burgk, J., Ho, P. T. P., Rodríguez, L. F., & Menten, K. M. 2009, ApJ, 704, L45 [Google Scholar]
- Zapata, L. A., Schmid-Burgk, J., Pérez-Goytia, N., et al. 2013, ApJ, 765, L29 [NASA ADS] [CrossRef] [Google Scholar]
- Zapata, L. A., Schmid-Burgk, J., Rodríguez, L. F., Palau, A., & Loinard, L. 2017, ApJ, 836, 133 [NASA ADS] [CrossRef] [Google Scholar]
- Zapata, L. A., Ho, P. T. P., Guzmán Ccolque, E., et al. 2019, MNRAS, 486, L15 [NASA ADS] [Google Scholar]
- Zhang, Q., Hunter, T. R., Brand, J., et al. 2005, ApJ, 625, 864 [NASA ADS] [CrossRef] [Google Scholar]
- Zhang, Y., Arce, H. G., Mardones, D., et al. 2019, ApJ, 883, 1 [NASA ADS] [CrossRef] [Google Scholar]
All Tables
Continuum and spectral line parameters for all lines covered by the CASCADE observations.
Inclination correction factors used in the different methods of outflow force calculation.
All Figures
|
Fig. 1 United Kingdom Infra-Red Telescope (UKIRT) Wide Field Camera (WFCAM) continuum image of the DR21 Main region at 2.2 μm (Warren et al. 2007) and the line emission in key gas tracers observed as part of CASCADE. Shock-excited H2 emission makes a significant contribution to the 2.2 μm image, in particular to the lobes off the central region. White contours mark the 5σ HCO+ (left), N2H+ (middle), and SiO (right) emission. Intensities are integrated between −50 and 50, −20 and 10, and −20 and 20 km s−1 for the HCO+, N2H+, and SiO emission, respectively. The adopted point of origin of the outflow is marked in all cases with a red cross. Red dashed lines (middle) mark the three separate areas of the DR21 Main region used to extract the spectra in Fig. 2, with “E” marking the eastern outflow lobe, “C” the central area, and “W” the western outflow lobe. The magenta dashed box (right) marks the location of the interaction region shown in Fig. 11. Finally orange contours (right) show the 5σ integrated intensity of H41α from −30 to 30 km s−1. |
| In the text | |
|
Fig. 2 Averaged line profiles of the (1−0) transitions of HCO+, HCN, HNC, N2H+, and the (2−1) transition of SiO toward the eastern lobe, the center, and the western lobe of the DR21 Main outflow (see Fig. 1). For HCN and N2H+, the velocities corresponding to hyperfine structure components are marked with black ticks. Red dashed lines show the source velocity, −3 km s−1, green dashed lines mark the location of the absorption feature at 9 km s−1, and the gray horizontal lines show the baselines. |
| In the text | |
|
Fig. 3 Channel maps of the DR21 Main outflow in HCO+. Contours of the blueshifted HCO+ emission (in blue) and redshifted emission (in red) are integrated over velocity steps of 5 km s−1 and are plotted over the corresponding grayscale. The full velocity range is from 5 to 45 km s−1 relative to the source velocity (−3 km s−1) and the contour levels correspond to 5, 10, and 20 σrms. The black dashed circle shows the area of the DR21–1 core in Cao et al. (2019). The green dashed lines denote the half-circles used to derive the outflow opening angles (see Fig. 7). |
| In the text | |
|
Fig. 4 HCO+ emission integrated from −50 to 50 km s−1. Red and blue contours mark the redshifted (5 to 45 km s−1) and blueshifted (−5 to −45 km s−1) HCO+ emission, respectively. Contours correspond to 5 σrms emission and the velocity ranges are given relative to the source velocity (−3 km s−1). Black arrows mark the cuts for the PV diagrams (Figs. 5 and 6) and the ticks mark distances of 50 arcsec along the arrows. |
| In the text | |
|
Fig. 5 Position–velocity diagram for HCO+ emission along the DR21 Main outflow. The offset is measured from the edge of the eastern lobe towards the west. The arrow points to the 9 km s−1 absorption feature (Dickel et al. 1978), the white arrow highlights the location of the interaction region (this work), the magenta dashed contour marks the H41α emission from the Η II region, and the light green arrows mark examples of sawtooth pattern structures (Santiago-García et al. 2009). |
| In the text | |
|
Fig. 6 Position–velocity diagrams for HCO+ (top) and N2H+ (bottom) emission along the DR21 ridge. The offset is measured from south to north (see Fig. 4 for the exact location of the cut). The magenta dashed contour marks the H41 α emission from the Η II region while the orange dashed lines mark the source velocity (−3 km s−1). For the N2H+ line, the velocities of the three resolved hyperfine structure components are marked at 4, −3, and −10 km s−1, respectively. |
| In the text | |
|
Fig. 7 Opening angle of the DR21 Main outflow as a function of velocity using HCO+ 1−0 line profiles. The angles are calculated every 5 km s−1 from the source velocity up to υmax = 22,32,−38, and −48 km s−1 for the east-red, west-red, east-blue, and west-blue outflow lobes, respectively. Top: opening angles for blueshifted outflow velocities. Bottom: opening angles for redshifted outflow velocities. |
| In the text | |
|
Fig. 8 Image showing the 3 mm continuum emission in the area of DR21 Main. The peak of the continuum emission is marked with a red star, while the green circle marks the location of the dense core DR21-1 (Cao et al. 2019), and the green dashed line the FWHM. Blue contours mark the integrated HCO+ intensity (−50 to 50 km s−1), while the beam of the continuum observations is shown with the red ellipse. |
| In the text | |
|
Fig. 9 Distribution of gas velocities associated with the outflows in DR21 (left) and Orion KL (right, Bally et al. 2017). Each point shows a local intensity peak of the HCO+ emission (above 2 σ) integrated in velocity steps of 5 km s−1. The color of the points signifies the corresponding velocity steps and is the same for the two plots. Background grayscale shows the integrated HCO+ (left panel) and CO emission (right panel) over the entire velocity range of the outflows (from −70 to 70 km s−1 for DR21 Main and −100 to 100 km s−1 for Orion KL). |
| In the text | |
|
Fig. 10 Outflow force vs. envelope mass of the driving source for various protostellar sources. Right-facing triangles represent low-mass sources from Mottram et al. (2017), left-facing triangles mark sources taken from Yildiz et al. (2015), and upward-pointing triangles are from van der Marel et al. (2013); Class I sources are marked in blue, and Class 0 in red. Black diamonds mark intermediate-mass sources (van Kempen et al. 2009), gray squares mark high-mass sources from Maud et al. (2015), green “×” symbols mark high-mass sources from Beuther et al. (2002), and black stars mark high-mass sources in Cygnus (Skretas & Kristensen 2022). The red crosses mark a sample of high-mass 70µm dark sources (Li et al. 2020). The cyan star marks G5.89-0.39, the magenta one marks Orion KL, and the green one represents the DR21 Main outflow. The dashed black line shows the best fit to the outflow force–envelope mass correlation for all sources, while red and gray show the best fits for the low- and high-mass sources, respectively. |
| In the text | |
|
Fig. 11 Outflow–cloud interaction region in the western lobe of the DR2l Main outflow. The grayscale shows the integrated HCO+ emission between −50 and 50 km s−1 relative to the source velocity. Red contours show line emission of HCN (top), H2CO (middle), and HNC (bottom). Blue contours show the emission of N2H+ and green contours show the emission of SiO, in all panels. Contour levels are at 5, 10, and 20 σrms. The dashed black lines in the middle plot mark the lines used to calculate the average intensities and first moments across the interaction front presented in Figs. 12–17. The orange rectangle marks the area actively affected by the interaction as derived from these intensities. |
| In the text | |
|
Fig. 12 Average integrated intensities of HCO+ (in blue), H2CO (in red), and N2H+ (in green) across the interaction region in the western lobe of DR2l. Intensities are integrated from −70 to 70, from −20 to 20, and from −20 to 10 km s−1 for HCO+, H2CO, and N2H+, respectively. The x-axis shows the distance in arcseconds covering the extent of the relevant region where the outflow interacts with a dense structure (marked also in Fig. 11). The orange rectangle shows the area actively affected by the interaction. The intensities for H2CO and N2H+ are scaled up by a factor of 8 in order for their distributions to be more easily comparable. |
| In the text | |
|
Fig. 13 First moment of HCO+ emission across the interaction front (see Fig. 12). The black dashed line marks the DR2l cloud velocity of υcloud = −3 km s−1. |
| In the text | |
|
Fig. 14 Average integrated intensities of SiO (in blue) and H2CO (in red) across the interaction region in the western lobe of DR21. Intensities are integrated from −25 to 25 and from −20 to 20 km s−1 for SiO and H2CO, respectively. The SiO emission is scaled up by a factor of 2 for clarity. |
| In the text | |
|
Fig. 15 HCN and HNC emission in the interaction region. Top: average integrated intensities of HCN (in blue) and HNC (in red) across the interaction region in the western lobe of DR21. Intensities are integrated from −35 to 35 and from −15 to 10 km s−1 for HCN and HNC, respectively. The HNC emission is scaled up by a factor of 5 for clarity. Bottom: ratio of HCN over HNC across the interaction region. |
| In the text | |
|
Fig. 16 First moment across the interaction front of the DR21 Main outflow and the dense structure located near the western outflow lobe plotted over the corresponding distance. The distance is measured from the outflow-dominated part and extends into the dense structure. The black dashed line marks the DR21 cloud velocity of υcloud = −3 km s−1. Top: For HCN emission Bottom: for HNC emission. |
| In the text | |
|
Fig. 17 Average integrated intensities of HCCCN J = 8−7 (in blue), HCCCN J = 10−9 (in red), and CCH (in green) across the interaction region in the western lobe of DR21. Intensities are integrated from −10 to 5 km s−1 for all three lines. |
| In the text | |
|
Fig. A.1 UKIRT/WFCAM continuum image of the DR21 Main region at 2.2 µm and the line emission in key gas tracers observed as part of CASCADE. White contours mark the 5σ HCN (left), H2CO (middle), and HNC (right) emission. |
| In the text | |
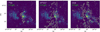 |
Fig. A.2 Similar to Fig. A.1, but for 13CS (left), H13CO+ (middle) and CCH (right). |
| In the text | |
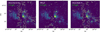 |
Fig. A.3 Similar to Fig. A.1, but for HCCCN (10-9) (left), NH2D (middle) and HCCCN (8-7) (right). |
| In the text | |
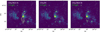 |
Fig. A.4 Similar to Fig. A.1, for CH3CN (5-4) (left), CH3OH (middle) and CH3CN (4-3) (right). |
| In the text | |
 |
Fig. A.5 Similar to Fig. A.1, but for DNC (left), DCO+ (middle) and DCN (8-7) (right). |
| In the text | |
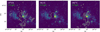 |
Fig. A.6 Similar to Fig. A.1, but for H13CN (left), Hα41 (middle) and HN13C (right). |
| In the text | |
|
Fig. B.1 Similar to 2, but for CCH, HCCCN (10−9), HCCCN (8−7), H13CO, and 13CS |
| In the text | |
|
Fig. B.2 Similar to 2, but for H2CO, DNC, DCO+, DCN, and NH2D |
| In the text | |
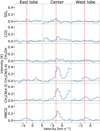 |
Fig. B.3 Same as Fig 2, but for SO2, CCD, CH3OH, CH3CN (4k–3k), CH3CN (5k–4k), and HNCO |
| In the text | |
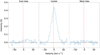 |
Fig. B.4 Same as Fig 2, but for H41α emission. |
| In the text | |
|
Fig. C.1 Outflow mass versus envelope mass and bolometric luminosity. The labels are the same as in Fig. 10. |
| In the text | |
|
Fig. C.2 Outflow mass rate versus envelope mass and bolometric luminosity. The labels are the same as in Fig. 10. |
| In the text | |
|
Fig. C.3 Outflow momentum versus envelope mass and bolometric luminosity. The labels are the same as in Fig. 10. |
| In the text | |
|
Fig. C.4 Outflow kinetic energy versus envelope mass and bolometric luminosity. The labels are the same as in Fig. 10. |
| In the text | |
|
Fig. C.5 Outflow kinetic luminosity versus envelope mass and bolometric luminosity. The labels are the same as in Fig. 10. |
| In the text | |
Current usage metrics show cumulative count of Article Views (full-text article views including HTML views, PDF and ePub downloads, according to the available data) and Abstracts Views on Vision4Press platform.
Data correspond to usage on the plateform after 2015. The current usage metrics is available 48-96 hours after online publication and is updated daily on week days.
Initial download of the metrics may take a while.