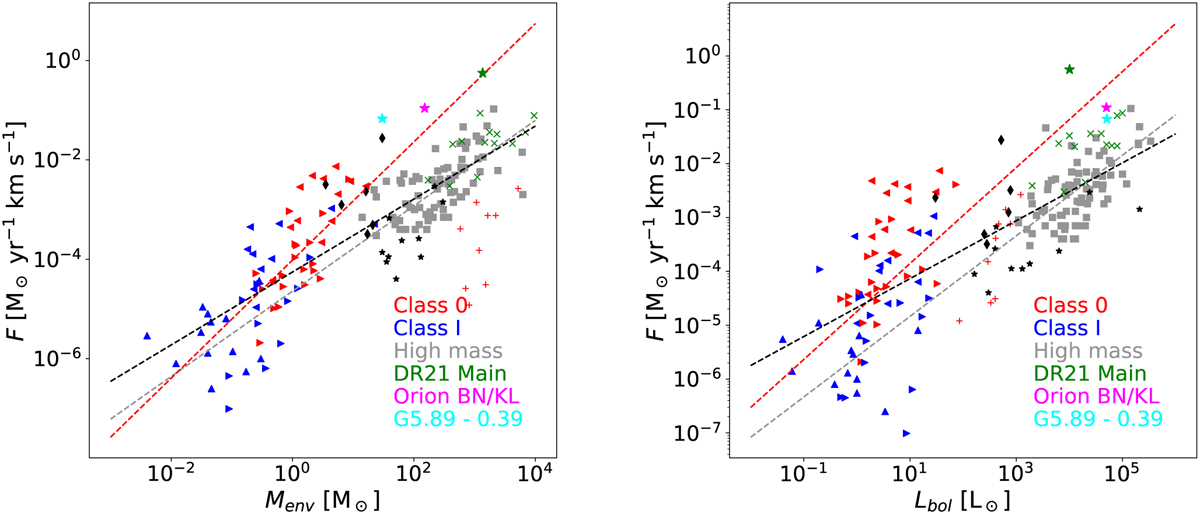
Fig. 10
Download original image
Outflow force vs. envelope mass of the driving source for various protostellar sources. Right-facing triangles represent low-mass sources from Mottram et al. (2017), left-facing triangles mark sources taken from Yildiz et al. (2015), and upward-pointing triangles are from van der Marel et al. (2013); Class I sources are marked in blue, and Class 0 in red. Black diamonds mark intermediate-mass sources (van Kempen et al. 2009), gray squares mark high-mass sources from Maud et al. (2015), green “×” symbols mark high-mass sources from Beuther et al. (2002), and black stars mark high-mass sources in Cygnus (Skretas & Kristensen 2022). The red crosses mark a sample of high-mass 70µm dark sources (Li et al. 2020). The cyan star marks G5.89-0.39, the magenta one marks Orion KL, and the green one represents the DR21 Main outflow. The dashed black line shows the best fit to the outflow force–envelope mass correlation for all sources, while red and gray show the best fits for the low- and high-mass sources, respectively.
Current usage metrics show cumulative count of Article Views (full-text article views including HTML views, PDF and ePub downloads, according to the available data) and Abstracts Views on Vision4Press platform.
Data correspond to usage on the plateform after 2015. The current usage metrics is available 48-96 hours after online publication and is updated daily on week days.
Initial download of the metrics may take a while.