| Issue |
A&A
Volume 688, August 2024
|
|
|---|---|---|
| Article Number | A215 | |
| Number of page(s) | 24 | |
| Section | Interstellar and circumstellar matter | |
| DOI | https://doi.org/10.1051/0004-6361/202450118 | |
| Published online | 23 August 2024 | |
The Cygnus Allscale Survey of Chemistry and Dynamical Environments: CASCADE
III. The large scale distribution of DCO+, DNC, and DCN in the DR21 filament
1
Max-Planck-Institut für Radioastronomie,
Auf dem Hügel 69,
53121
Bonn,
Germany
e-mail: This email address is being protected from spambots. You need JavaScript enabled to view it.
2
Max Planck Institut für Astronomie,
Königstuhl 17,
69117
Heidelberg,
Germany
3
Physikalisches Institut der Universität zu Köln,
Zülpicher Str. 77,
50937
Köln,
Germany
4
William H. Miller III Department of Physics & Astronomy, Johns Hopkins University,
3400 North Charles Street,
Baltimore,
MD
21218,
USA
5
Max-Planck-Institut für Extraterrestrische Physik,
Giessenbachstrasse 1,
85748
Garching,
Germany
6
Institut de Radioastronomie Milliétrique (IRAM),
300 rue de la Piscine, Domaine Universitaire,
38406
St-Martin-d’Hères,
France
7
Department of Astrophysics, University of Vienna,
Türkenschanzstrasse 17,
Vienna,
Austria
8
SKA Observatory, Jodrell Bank,
Lower Withington,
Macclesfield
SK11 9FT,
UK
Received:
25
March
2024
Accepted:
5
June
2024
Abstract
Context. Deuterated molecules and their molecular D/H-ratios (RD (D)) are important diagnostic tools with which to study the physical conditions of star-forming regions. The degree of deuteration, RD (D), can be significantly enhanced over the elemental D/H-ratio depending on physical parameters such as temperature, density, and the ionization fraction.
Aims. Within the Cygnus Allscale Survey of Chemistry and Dynamical Environments (CASCADE), we aim to explore the large-scale distribution of deuterated molecules in the nearby (d ~ 1.5 kpc) Cygnus-X region, a giant molecular cloud complex that hosts multiple sites of high-mass star formation. We focus on the analysis of large-scale structures of deuterated molecules in the filamentary region hosting the prominent HII region DR21 and DR21(OH), a molecular hot core that is in an earlier evolutionary state.
Methods. The DR21 filament has been imaged using the IRAM 30-m telescope in a variety of deuterated molecules and transitions. Here, we discuss the HCO+, HNC, and HCN molecules and their deuterated isotopologs DCO+, DNC, and DCN, and their observed line emissions at 3.6, 2, and 1.3 mm.
Results. The spatial distributions of integrated line emissions from DCO+, DNC, and DCN reveal morphological differences. Notably, DCO+ displays the most extended emission, characterized by several prominent peaks. Likewise, DNC exhibits multiple peaks, although its emission appears less extended compared to DCO+. In contrast to the extended emission of DCO+ and DNC, DCN appears the least extended, with distinct peaks. Focusing only on the regions where all three molecules are observed, the mean deuteration ratios for each species, RD, are 0.01 for both DNC and DCN, and = 0.005 for DCO+, respectively. Anticorrelations are found with deuterated molecules and dust temperature or N(H2).
Conclusions. The strongest anticorrelation is found with RD(DCO+) and N(H2), with a Pearson correlation coefficient of ρ = −0.74. We analyzed the SiO emission as a tracer for shocks and the N (HCO)/N (H13CO+) as a tracer for increased photodissociation by ultraviolet radiation. It is suggested that the anticorrelation of RD (DCO+) and N(H2) is a result of a combination of an increased photodissociation degree and shocks. A strong positive correlation between the ratio of integrated intensities of DCN and DNC with their 13C-isotopologs is found in high-column-density regions. The positive relationship between the ratios implies that the D-isotopolog of the isomers could potentially serve as a tracer for the kinetic gas temperature.
Key words: methods: observational / ISM: clouds / ISM: molecules / ISM: individual objects: DR21
Member of the International Max Planck Research School (IMPRS) for Astronomy and Astrophysics at the Universities of Bonn and Cologne.
© The Authors 2024
 Open Access article, published by EDP Sciences, under the terms of the Creative Commons Attribution License (https://creativecommons.org/licenses/by/4.0), which permits unrestricted use, distribution, and reproduction in any medium, provided the original work is properly cited.
This article is published in open access under the Subscribe to Open model.
Open Access funding provided by Max Planck Society.
1 Introduction
While an overall understanding has emerged that star formation occurs in cool, dense molecular clouds, the physical and chemical conditions during the formation of high-mass stars are still poorly understood. The chemistry of these clouds evolves in complexity, heavily depending on the underlying and evolving physical conditions (see, for example, McKee & Tan 2002, 2003; Girichidis et al. 2020; Tielens 2021). Conversely, the presence of molecules, primarily CO, and also dust grains affects the physical conditions and the evolution of the clouds, as these coolants are important to allow their contraction (Hocuk et al. 2014).
In the interstellar medium (ISM), the elemental abundance ratio of deuterium to hydrogen (D/H) is observed to be approximately 10-5 (Linsky 1998; Oliveira et al. 2003, Cooke et al. 2018). The earliest phases of star formation begin when the cloud is cold (T < 30 K) and dense (n > 105 cm-3) (e.g. Fontani et al. 2011). During this phase, deuterium chemistry begins via an ion–molecule reaction involving H3+ and HD:
 (1)
(1)
enabling the transfer of deuterium from its main reservoir, HD, to other species (Watson 1974; Wootten 1987). Additionally, depending on the spin-state of H3+, and consequently of the formed H2D+, the reverse reaction in Eq. (1) is enhanced (Flower et al. 2006). During the freeze-out onto dust grains, the number of heavy neutral molecules in the gas phase, such as CO, decreases. This decreases the destruction of H2D+ (Pillai et al. 2012; Sabatini et al. 2020). Therefore, low temperatures lead to an accumulation of H2D+. Reaction (1) is the first formation route for heavier deuterated molecules, leading to a higher molecular XD/XH ratio (≡ RD (XD), with XD and XH the abundance of the deuterated and H-isotopolog, respectively) that can reach up to a few percent (Roberts & Millar 2000a; Roberts et al. 2004) in dense, molecular clouds. Simple gas phase chemistry predicts equilibrium values of RD (XD) for simple molecules to be on the order of several times 10 % for RD (DCO+) (Roberts & Millar 2000b). At higher temperatures (T ~ 30–80 K), deuteration mainly occurs through the light hydrocarbons, that is, CH2D+ and C2HD+ (Millar et al. 1989; Albertsson et al. 2013). Furthermore, deuterated molecules can also be formed on dust grain mantles where D-atoms react with ice. As the temperature drops below ~20 K, the flow of atomic D onto dust grains increases, and consequently the rate of grain-surface reactions with H and D increases (Albertsson et al. 2013). This can result in high XD-XH ratios in complex organic molecules (COMs; C-bearing molecules containing more than six atoms) of up to a few times 10% in extreme cases, leading even to multiply deuterated COMs (Parise et al. 2002). By studying the deuterated molecules and their main isotopologs, we can gain an insight into the physical conditions in early-stage star formation, such as the gas density, temperature, and ionization fraction (Herbst 1982; Caselli et al. 1998; Favre et al. 2015; Gerner et al. 2015).
In this paper, three deuterated molecules are of particular interest: DCO+, DNC, and DCN. DCO+ is efficiently formed through H2D+ reacting with CO in the low-temperature regime (Albertsson et al. 2013). An additional formation pathway for DCO+ in the higher-temperature regime (T > 50 K) is thought to occur from the light hydrocarbon, CH2D+ (Favre et al. 2015). The column density ratio, RD (DCO+), also depends on the ionization fraction (Caselli et al. 1998), whereby a decreasing ratio can suggest a higher ionization fraction (Favre et al. 2015). DNC and DCN show dissimilar behavior in their formation pathways. DNC is formed from HCND+, via H2D+ , reacting with CN or HCN in the lower temperature regime (~20–30 K) or through CH2D+ reacting with N in the higher temperature regime (Turner 2001; Albertsson et al. 2013). On the other hand, DCN is formed primarily (~66%) through CH2D+ via CHD or CH2D reacting with N in conditions typical of translucent and dark clouds (Turner 2001). A significant, but less efficient formation pathway of DCN is through DCO+ reacting with HCN or HNC forming HDCN+ or DCNH+ , respectively. This reaction becomes more efficient with increasing temperature, forming both DNC and DCN (Albertsson et al. 2013). Furthermore, the formation of DNC from HCN is more efficient than the formation of DCN from HNC (Turner 2001). The abundances of both precursors H2D+ and CH2D+ are temperature-dependent (Albertsson et al. 2013), which leads to the increasingly efficient production of DCN with temperature. This means that the formation of DNC is more efficient at lower temperatures (∼30 K) than that of DCN. As the temperature increases, the efficiency with which DCN is formed increases, surpassing the production of DNC at higher temperatures (∼80 K).
Gerner et al. (2015) investigated the behavior of deuterated molecules’ abundances in high-mass star-forming regions, which they divided into four different evolutionary stages; namely, infrared dark clouds (IRDC), high-mass protostellar objects (HMPO), hot molecular cores (HMC), and ultra-compact HII- regions (UCHII), evolving as IRDC → HMPO → HMC → UCHII. They show that the column densities, N, of DCO+ and DNC decrease with progressing evolutionary stage of a clump, whereas N(DCN) peaks in the HMC-stage (Gerner et al. 2015). In addition, they find that the RD (DNC) and RD (DCN) deuteration ratios show a range of values, with an average of 0.02 and 0.005, respectively (Gerner et al. 2015). In the same sources, RD(DCO+) was measured to be an order of magnitude lower, with an average ratio of 0.0025 (Gerner et al. 2015). Toward two dark cloud sources, L134N and TMC-1, RD(DCO+) was found to be 0.18 and 0.02, respectively (Tiné et al. 2000). More recent observations toward the distant HII-region W51 starforming region showed a core, on the same spatial scales, with a comparable ratio of 0.02 (Vastel et al. 2017).
The prominent nearby giant molecular cloud or star formation complex Cygnus-X is a prime target for studying the early stages of massive star formation. It has a rich environment that contains recent and ongoing star formation activities. These are OB associations, Wolf-Rayet stars, numerous HII-regions, and dense molecular star-forming clumps (Schneider et al. 2006; Motte et al. 2007; Reipurth & Schneider 2008). The most active and dense region within the Cygnus-X region is a filament that contains, near its southern end, the compact HII-region DR21 Main (Downes & Rinehart 1966; Immer et al. 2014; Schneider et al. 2010; Hennemann et al. 2012), which has a rich molecular envelope with a photodissociation interface (Ossenkopf et al. 2010). The filament is proposed to be the result of interacting HI flows and molecular clouds (Schneider et al. 2023; Bonne et al. 2023). The DR21 region is located at a distance of 1.5 kpc (Rygl et al. 2012), and its dense filamentary structure, also called the “DR21 ridge”, harbors several dense cores with a gradient of evolutionary stages (Hennemann et al. 2012). Further north, a famous active OH, H2O, and CH3 OH maser source, the dense protocluster or hot molecular core DR21(OH) (Mangum et al. 1992) is found and a colder region of infalling gas is located in the northernmost part of the ridge (Schneider et al. 2010; Hennemann et al. 2012; Koley et al. 2021). Previous studies of H2D+ north of DR21(OH) using the James Clerk Maxwell Telescope (JCMT) have shown the emission to probe a large-scale cold, quiescent gas component (Pillai et al. 2012), hinting also at the presence of cold gas pockets nearby, only slightly offset from the DR21 filament.
The Cygnus-X Allscale Survey of Chemistry And Dynamical Environments (CASCADE; Beuther et al. 2022) is a large- scale survey of the Cygnus-X region carried out with the NOrthern Extended Millimeter Array (NOEMA) and the Insti- tut de Radioastronomie Millimétrique (IRAM) 30-m telescope as a Max Planck Institute and IRAM Observatory large-program (MIOP). The objective is to connect star formation properties at large scales probed with the IRAM 30-m telescope to small-scale dense cores observed by the NOEMA interferometer. In its lower frequency range of 70–80 GHz, the project covers the ground state level transitions of several key deuterated species, DCO+, DNC, and DCN (see Table 1). Higher rotational transitions of the deuterated species in the 1.3-mm and 2-mm wavelength bands were performed with follow-up observations once again using the IRAM 30-m telescope to constrain the line excitation temperatures that were used to determine reliable molecular column densities.
The paper is organized as follows: in Sect. 2, we present the observations and the data reduction; in Sect. 3 we show the integrated intensities and averaged spectra of deuterated molecules in the DR21 filament, and describe the calculation of molecular column densities. In Sects. 4 and 5, we analyze and discuss the molecular D/H ratios and their behavior with the dust temperature and H2 column density. Finally, in Sect. 6, we present our conclusions.
Frequencies and spectroscopic properties of the deuterated molecules and their corresponding 13C-isotopologs presented in this study alongside the spectral line properties obtained by averaging over the entire DR21 filament are presented.
2 Observations
We carried out on-the-fly (OTF) mapping observations (Project ID: 145-19 and 031-20; PIs: F. Wyrowski and H. Beuther) at 4 millimeter (mm) wavelength using the IRAM 30-m telescope. To obtain a large bandwidth, covering all of the deuterated molecules of interest, the mappings were performed using the Eight MIxer Receiver (EMIR)1 (Carter et al. 2012) and using the Fourier Transform Spectrometer backend with 195 kHz channel spacing (FTS200). A bandwidth of 8 GHz per sideband (in total, a frequency coverage of 16 GHz) with EMIR E90 in both polarization was covered. At 72 GHz, the spectral channel resolution of 195 kHz is equivalent to a velocity resolution of 0.73 km s−1 (smoothed to a spectral resolution of dυ = 0.8 km s−1) and the half power beam width (HPBW) of the IRAM 30-m telescope is 34″2.
Observations of the DR21 filament were carried out on May 21 and 22, 2020. The regions with the highest H2 column densities (Motte et al. 2010) were covered in 6 tiles. Figure 1 shows the DR21 coverage of CASCADE in dashed red lines. Each tile, of size ~306″ × 306″, is observed with the OTF mapping technique, in two scanning directions, in right ascension (RA) and in declination (Dec) with a scanning frequency of ~17″5 s−1 and a dump time of ~0.5 s. This results in an oversampling of the beam by a factor >3. For each mapping, two temperature load calibration observations, each of 60s duration, were done. In order to avoid edge effects, tiles slightly overlap along the filament.
2.1 Follow-up observations with IRAM 30-m telescope
To complement the lower J-transitions of some of our target molecules (see Table 1), we performed OTF mapping observations using the IRAM 30-m telescope over five nights from July 15 to July 19, 2021 (Project ID: 053-21; PI: I. Barlach Christensen). The OTF maps were carried out with the EMIR E150 and E230 modules in five tiles, each of size of ~120″ × 120″, outlined by the orange boxes in Fig. 1. For each mapping (with two coverages combined in one tile), the scanning velocities were 5″5 s−1 and 3″8 s−1 for 2-mm and 1.3-mm, respectively. The HPBW is 17″ at 145 GHz and 11″ at 230 GHz.
The FTS covered 8 GHz bandwidth in each sideband in both polarization. To obtain a spectral resolution that is comparable to the ground-state transition observations, the FTS backend was used at 195 kHz resolution, which corresponds to 0.38 km s−1 at 154 GHz and 0.25 km s−1 at 231 GHz. The spectra are smoothed to a spectral resolution of dυ = 0.8 km s−1. For the E150 observations, the receiver was tuned to 150.25 GHz in the upper inner sideband, to cover the N2D+ (2−1) and DNC (2−1) transitions. The frequency coverage in the 2-mm wavelength band is 132.2– 140 GHz in the lower sideband and 148–155.7 GHz in the upper sideband. For the E230 observations, the receiver was tuned to 216.75 GHz in the lower outer sideband, to cover the DCO+ (3–2), DCN (3–2) and N2D+ (3–2) transitions. The total E230 frequency coverage is 214.4–222.2 GHz for the lower sideband and 230.1–237.9 GHz for the upper sideband.
The angular resolution of the higher J-transition observations of DCO+, DCN and DNC (for example θ ~ 12″ for DCO+ (3–2), and θ ~ 16″ for DNC (2-1)) is higher than that of the ground-state transitions (for example, θ ~ 34″ for DCO+ (1–0)). For comparison purposes, the maps of the higher J- transitions are convolved to a common beam size, namely that of the ground-state transitions (θ = 34″). However, for the maps shown, the native resolution of the respective lines was retained.
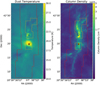 |
Fig. 1 Maps of dust temperature (left) and H2 column density (right) of the DR21 filament taken determined by the HOBYS program (Motte et al. 2010). The stars in both maps indicate the positions of DR21 Main (red) and DR21(OH) (blue). The dashed red and orange lines show the coverage of CASCADE and follow-up observations, respectively. |
2.2 Data processing
The data of both the CASCADE and follow-up observations of the DR21 filament were processed using the Grenoble Image and Line Data Analysis Software (GILDAS) package3 (Pety 2005, 2018). Using the Continuum and Line Analysis Single-dish Software (CLASS) program, we regridded the obtained spectra over the mapped areas. Using the MAP%LIKE procedure of CLASS, all images were reprojected to the spatial grid of DCO+, which has a resolution of 34″. For computing the column densities, the scale was converted from T*A to main beam brightness temperature TMB, using a forward efficiency of Feff = 0.95 and a beam efficiency4 depending on the frequency of the molecule:
![Mathematical equation: ${B_{{\rm{eff}}}} = 1.2 \times 0.69 \times \exp \left( { - {{\left( {{{4 \times \pi \times 0.07v[{\rm{MHz}}]} \over {c\left[ {{\rm{km}}{{\rm{s}}^{ - 1}}} \right]}}} \right)}^2}} \right),$](/articles/aa/full_html/2024/08/aa50118-24/aa50118-24-eq2.png) (2)
(2)
where v is the rest frequency of the line emission and c is the speed of light. This ensures that each line can be resolved and has the same velocity resolution, as the line widths are typically FWHM~3–4 km s−1 (see Table 1).
During the observations, we identified a strong narrow spike at 76304.9 MHz with a frequency shifted by −1 MHz from the emission line of DNC (v = 76305.727 MHz). We suspect this spike to be contamination from an automotive long range radar. In order to minimize the contamination caused by this spike, we compared the noise in the artifact free spectral velocity range (< –30 km s−1 from the central line) with the contaminated channels (>0 km s−1). If the noise level with the artifact increased by 20%, the spectrum is discarded.
2.3 Ancillary data
Figure 1 presents the dust temperature and H2 column density (Bonne et al. 2023) maps of the DR21 filament first discussed by Hennemann et al. (2012), which are based on data taken as part of the Herschel imaging survey of OB Young Stellar objects (HOBYS) program (Motte et al. 2010).
The CASCADE mapping area is outlined by dashed red lines in both the maps. The H2 column density maps are derived by Bonne et al. (2023) based on convolved dust brightness temperature distributions at three different wavelengths: 500 µm, 360 µm, and 250 µm. The dust temperature was determined from the 160 µm/250 µm flux density ratio. The resulting H2 column density and dust temperature maps are obtained at an angular resolution of approximately ~18″. For further analysis, both the H2 column density map and dust temperature maps are convolved to the angular resolution of the present CASCADE study, which is θ ~ 34″.
3 Results
Using data from the CASCADE survey, we investigate in detail the deuteration along the DR21 filament. For this we consider three molecular species that are abundant in the ISM: HCO+, HNC, and HCN and their corresponding deuterated species. As mentioned in Sect. 1, the three species, and their deuteration, provide an insight into distinct physical conditions. In general, HCO+, HNC, and HCN lines are likely to be optically thick in dense molecular clouds; hence, to estimate the column densities of these hydrogen-bearing species and to estimate the degree of deuterium fractionation, we utilized lines of their optically thin isotopologs; that is, H13CO+, HN13C and H13CN. Furthermore, we assume the deuterated isotopologs are optically thin. Table 1 summarizes the observed molecules and their transitions. Figure 2 shows spectra of the deuterated species and 13C-isotopologs averaged over the entire DR21 filament. For most of the lines, the hyperfine splitting structure (HFS) was too small and/or not resolved at the resolution of 0.8 km s−1, except for the HCN (1−0) 13C and D-isotopolog lines. The line parameters used during the analysis account for the unresolved HFSs. In the case of the ground-state transition of HCN, H13CN and DCN, the integration is done only focusing on the central and strongest line. The emission from this main HFS component is extracted over the same velocity range as that of the DCO+ and DNC lines. The HFS components of the HCN, H13CN and DCN lines are not considered to ensure that the extracted line emission stems from the υLSR = −3 km s−1 component. In contrast, the higher velocity DCN HFS component can be affected by a secondary DR21 velocity component at υLSR = 9 km s−1 (Dickel et al. 1978; Nyman 1983). The resultant line parameters of the deuterated and 13C isotopologs are presented in Table 1.
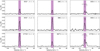 |
Fig. 2 Average spectra of DCO+, DNC, and DCN, and their 13C-isotopologs in the DR21 filament. The black line shows the spectra averaged over the entire mapped region of the DR21 filament for different molecules with the purple region showing the velocity range used for determining integrated intensities. The dashed gray line denotes the main velocity of the filament, υLSR = −3 km s−1. The velocities of the un- or only marginally blended HFS components of DCN and H13CN are marked in black, with the relative intensity of the hyperfine components marked by the length. The LSR velocity scale of the DCN and H13CN J = 1−0 spectra corresponds to the strongest HFS component F = 2−1. |
3.1 Integrated intensity maps of the DR21 filament
To study the spatial distribution of the deuterated molecules in DR21, we created velocity-integrated intensity maps (see Fig. 3) over the velocity range from −7 km s−1 to +0.5 km s−1 (purple shaded region in Fig. 2). This integration velocity range was chosen around the peak velocity υpeak ± 3.5 km s−1, determined from a fit to a spectrum that represents an average of the emission in the covered area in the DR21 region (see Table 1). As υpeak has a value −3 km s−1 for both DCO+ and DNC lines and −3.5 km s−1 for the DCN lines, the selected velocity interval from −7 km s−1 to +0.5 km s−1 ensures that the chosen integration ranges are consistent for all the targeted species. Emission maps of the ground-state transition of the deuterated species and their 13C-isotopologs are shown in Fig. 3. The ground rotational transitions of deuterated molecules (i.e., DCO+, DCN, and DNC) show enhanced emission along the DR21 filament. For comparison, we also created the intensity maps of the corresponding hydrogenated species shown in Fig. A.1. We note that for species like H13CN and DCN, that show HFS, the velocity range over which we integrate includes contributions from the other HFS lines as well (see Fig. 2). As a result, the column densities subsequently derived for these species from the main HFS component will be overestimated.
3.2 Noise estimation
For each spectrum per pixel, a baseline was fitted with CLASS by applying a 1st order polynomial fit to an emission-free velocity window in the spectrum near the line of interest. The emission-free range was determined by visual inspection, aiming for a baseline subtraction in a velocity range of ~20 km s−1.
We obtain a root mean square (rms) of ~80–100 mK with spectral resolution at 0.8 km s−1 for the deuterated and the 13C-isotopologs covered with the CASCADE program. With the follow-up observations, we obtain an rms of ~130 mK with the same spectral resolution for the deuterated species.
The noise in the integrated maps depends on the number of channels over which the molecular line of interest is integrated. The resulting noise map for the integrated intensity maps of each target line was calculated as  . The number of channels, Nchannels = Δυ/Δυ, where Δυ is the line-width and δυ is the spectral resolution. In subsequent sections, the analysis discussed is based on the regions with a signal ≥4σtot for each pixel.
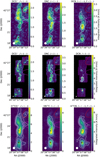 |
Fig. 3 Velocity-integrated intensity maps of deuterated and 13C-isotopologs. Top and middle rows: Ground-state emission of DCO+, DNC, and DCN observed with the CASCADE-program and follow-up mapping with the IRAM 30-m telescope. Bottom row: Maps for 13C-isotopologs. The intensities in the maps are integrated over the velocity range −7 km s−1 to +0.5 km s−1. HPBWs are displayed by the filled white circles in the lower left corner of each panel. For example, the HPBW beam-size is 34″ for the map showing DNC (2−1), 16″ for DCO+ (3−2) and 11″ for DCN (3−2). The white contours are showing levels of 4σ, 8σ and 12σ. The stars mark DR21 Main (red) and DR21(OH) (blue). The locations of the F1 and F3 sub-filament (Schneider et al. 2010) are indicated by dashed red and magenta curves, respectively. |
3.3 Column densities and kinetic gas temperature
Molecular column densities were calculated from the integrated intensities. The method assumes that the emission is optically thin and also assumes a common excitation temperature for each pixel in all transitions considered. We assume that all the lines considered are emitted under the conditions of local thermal equilibrium (LTE), which means that Texc = Trot = Tkin: any line’s excitation temperature is equal to a molecular rotation temperature, and both are equal to the kinetic gas temperature. Under LTE, the column densities can be calculated via the Boltzmann equation (Goldsmith & Langer 1999):
 (3)
(3)
where Nup and gup are the population and degeneracy of a transition’s upper energy level, Ntot is the total population in all the energy levels, and Qrot is the rotational partition function of each molecule taken from the CDMS or the JPL spectroscopy database. Eup is the upper level energy, and kB is the Boltzmann constant, and Trot is the rotation temperature. The parameters used for each molecule are presented in Table 1. We calculated Nup for each transition using the integrated intensity maps presented in Fig 3. Only those pixels with emission above 4σ are considered for the analysis. The upper level population of a transition, Nup, was calculated using the expression
 (4)
(4)
Here, v is the line’s frequency, h is the Planck constant, c is the speed of light and Aij is the Einstein coefficient (see Table 1). For the high densities of the dense clouds (see Table 1 for the critical densities of target molecules), the excitation temperature closely follows the kinetic gas temperature so that LTE can be assumed. Assuming a depth of the width of the filament (d = 0.34 pc; Hennemann et al. 2012), the column densities, where the deuterated molecules are detected, are at N(H2) ≥ 3 × 1023 cm−2, and the volume densities are n(H2) ≥ 3 × 105 cm−3.
While Eq. (3) solves for the temperature based on the observation of multiple molecule transitions, not all positions in the map have two detected transitions. Therefore, the kinetic gas temperature can be determined using several methods. Hacar et al. (2020) presented a correlation between the kinetic gas temperature and the integrated intensity ratio of HCN and HNC:
![Mathematical equation: ${{T_{{\rm{kin}}}}[{\rm{K}}] = 10 \times \left[ {{{I({\rm{HCN}})} \over {I({\rm{HNC}})}}} \right]{\rm{if}}1 \le \left( {{{I({\rm{HCN}})} \over {I({\rm{HNC}})}}} \right) \le 4}$](/articles/aa/full_html/2024/08/aa50118-24/aa50118-24-eq6.png) (5)
(5)
![Mathematical equation: ${T_{{\rm{kin}}}}[{\rm{K}}] = 3 \times \left[ {{{I({\rm{HCN}})} \over {I({\rm{HNC}})}} - 4} \right] + 40{\rm{if}}\left( {{{I({\rm{HCN}})} \over {I({\rm{HNC}})}}} \right) > 4.$](/articles/aa/full_html/2024/08/aa50118-24/aa50118-24-eq7.png) (6)
(6)
Due to the different destruction pathways of these isomers, at higher temperatures, HNC is destroyed more effectively, which thus increases the ratio as the temperature increases, in combination with opacity effects. The gas kinetic temperature is obtained using this method is used to calculate the column density maps of the deuterated molecules and the main isotopologs.
Using the HCN (1−0) and HNC (1−0) intensity maps (see Fig. A.1) and the above equations, we generated a kinetic temperature map of DR21, shown in Fig. 4. For pixels with molecular hydrogen column densities N(H2) ≥ 1 × 1023 cm−2, HCN and HNC could be optically thick (Beuther et al. 2022). The optical depth of H13CO+, HN13C and H13CN can be seen in Appendix B. The kinetic temperatures of these pixels were calculated using the intensity ratio of their optically thin isotopologs H13CN and HN13C (Beuther et al. 2022; Pazukhin et al. 2022). The obtained kinetic temperatures range from 10 to 31 K with a mean value of 17 K (see Fig. 4). Owing to the large beam size of our observations, we do not resolve the complex structures in DR21. Hence, the physical properties determined only represent an average value. Using Eq. (3), we generated column density maps of the deuterated molecules as well as their hydrogenated species. The column densities were determined pixel-wise using all transitions detected and fit with the Python package scipy. optimize. curve_fit. The excitation temperature was determined when two transitions were detected; otherwise, the Tkin derived from HCN/HNC was adopted. The column density maps of DCO+, DNC, DCN, HCO+, HNC, and HCN are presented in Fig. C.1. The respective errors obtained during the fitting are presented in Fig. C.2. Column densities of the main isotopologs were calculated from their optically thin 13C-isotopologs, assuming that the 13C/12C isotopic ratio is constant within the cloud complex. With a Galactocentric distance, DGC, of 8 kpc for Cygnus-X, and using the carbon isotope gradient versus Galactocentric distance relation 12C/13C = 7.5 DGC + 7.6 (Wilson & Rood 1994), we find 12C/13C = 68, which we assume in the following analysis. The gradient recently determined by Jacob et al. (2020) and Yan et al. (2023), delivers a value of 60, which is similar to the value of 68 adopted for the analysis in this work. In the analysis that follows, we assume no local variation in the isotopic ratio by, for example, isotopic fractionation, selective destruction of 12C versus 13C, or ion-molecule exchange reactions (Wilson & Rood 1994; Giannetti et al. 2014; Jacob et al. 2020; Yan et al. 2023).
 |
Fig. 4 Kinetic gas temperature calculated using the integrated intensity ratio of HCN and HNC for the lower column densities and H13CN and HN13C for the higher column densities (left) and dust temperature in the same region for comparison (right). The red contour shows the column density of N(H2)≥ 1 × 1023 cm−2. The stars show DR21 Main (red) and DR21(OH) (blue). The right panel shows the comparison of dust temperature in that same region. |
3.4 Correlations of integrated intensity maps
The number of pixels above 4σtot in the DCO+, DNC, and DCN of J = 1−0 emission maps are 148, 115, and 103, respectively. Compared with the other species, DCO+ shows the most extended emission distribution. It is clumpy, with several peaks detected toward the northern half of the filament. The brightest clump is located 2′.1 north of DR21(OH). Clumpy DCO+ emission is also present in the southern region. The southern peak is at an offset ~1′.2 southeast of DR21 Main. Apart from the emission along the main filament, an additional bright clump is seen northwest of the main peak and west of the DR21 -filament. The emission coincides with the low density, low kinetic gas and dust temperature infalling gas, named the F1 sub-filament by Schneider et al. (2010). Furthermore, DCO+ (1− 0) emission is detected toward the most massive F3 sub-filament (magenta region marked in Fig. 3), which is linked to DR21(OH) (Schneider et al. 2010). The morphology of the DCO+ (3−2) emission is similar to that of its ground state transition. However, the peak is ~32″ southwest of DR21(OH).
Similar to DCO+, the emission of DNC is also filamentary and shows several peaks. The emission is not as extended as the DCO+ emission toward the north. The F1 sub-filament, marked in red in Fig. 3, is also not as bright in DNC as it is in DCO+. The strongest emission is observed from an ≈ 1′ sized N-S elongated structure that has DR21(OH) at its southern end. A similar-sized region is seen in the south of the filament with DR21 Main at its northern end. The map of the DNC (2−1) emission resembles that of the DNC ground-state transition, and the brightest emission also is found close to DR21(OH).
Conversely, DCN (1−0) shows less extended emission with a strong peak toward DR21(OH). Likewise, DCN (3−2) is only detected toward the bright peaks of DCN (1−0). Weaker and relatively compact emission is seen surrounding DR21 Main. Emission toward the Fl sub-filament is not detected in DCN. The DCN (3−2) emission distribution is more compact than that of the (1−0) line and stronger (factor ~2). Its two peaks are found toward DR21(OH) and DR21 Main.
To quantify the morphological similarities between DCO+, DNC and DCN. The cross-correlation, ρ, of the distributions of the integrated intensities of pairs of molecules was calculated, pixel by pixel, as (Guzmán et al. 2018; Li et al. 2022)
 (7)
(7)
Here, I1,ij and I2,ij are the integrated intensities of molecules one and two in pixel (i, f). wij is the weight of the line emission detection. If emission from either molecule one or two is detected above 4σtot in pixel (i, f), wij = 1. If neither molecules is detected in pixel (i, j), wij = 0 and is not accounted for in the cross-correlation. The cross-correlation values are summarized in Fig. 5. This analysis confirms the result of visual inspection of Fig. 3, that the morphology of DNC can be considered as “intermediary” between those of DCO+ and DCN. For example, the cross-correlation of DCO+ (1−0) and DCN (1−0) is 0.54 whereas DNC (1−0) shows a stronger correlation with DCO+ (1−0) and DCN (1−0) of ρ = 0.81 and 0.84, respectively.
DCO+ (1−0) seems to originate from gas with different physical conditions than DNC (1−0) and DCN (1−0). Figure 6 shows the cumulative distributions of dust temperature and H2 column densities sampled in the pixels where RD(DCO+) (purple), RD(DNC) (orange), and RD(DCN) is detected (≥4σtot). A simple Kolmogorov-Smirnov (KS) test indicates a similar distribution for DNC (1−0) and DCN (1−0) (p < 0.05). The mean dust temperature, where DCO+ (1−0) is detected, is Tdust = 19 K and N(H2)= 5.9 × 1022 cm−2. The dust temperature and column density in regions in which DNC (1−0) or DCN (1−0) are detected is higher. For DNC (1−0), Tdust = 20.6 K and N(H2)= 1.0 × 1023 cm−2 and for DCN (1−0) Tdust = 21.3 K and N(H2)= 1.1 × 1023 cm−2. The mean values are marked in Fig. 6 with the respective color of the deuterated molecule.
Emission lines from all three deuterated molecules are observed at positions with column densities of N(H2) > 3 × 1022 cm−2. The DCO+ (1−0) and DNC (1−0) integrated maps show extended emission features spatially coinciding well with that of the filamentary structure seen in the H2 column density map.
The morphological similarities and differences observed between the three molecules suggest local variations in the formation and excitation of their transitions. These variations could be influenced by the local density and temperatures of the emitting gas. The dependencies of each molecule with the column density and the dust temperatures are analyzed further in Sect. 4.2.
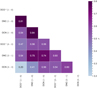 |
Fig. 5 Cross-correlations of integrated intensity maps of DCO+ (1−0), DNC (1−0), DCN (1−0), DCO+ (3−2), DNC (2−1), and DCN (3−2). |
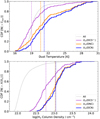 |
Fig. 6 Cumulative distribution function (CDF) of dust temperature and H2 column density where DCO+ (purple), DNC (orange), or DCN (blue) is detected in the DR21 filament. The dust temperatures and H2 column density maps are taken from Bonne et al. (2023). The horizontal dashed lines marks the mean dust temperature or column density of the sampled distributions, colorized with the respective detected molecular ratio. |
4 Analysis
In the following sections, we investigate deuteration across the DR21 filament.
4.1 Fractional abundances of DCO+, DNC, and DCN
The fractional abundance is defined as X(XD)= N(XD)/N(H2) where N(XD) is the column density of a deuterated molecular species. The molecular hydrogen column densities, N(H2), were adopted from the high-resolution HOBYS column densities described in Sect. 3 and convolved to an angular resolution of 34″. In order to estimate the fraction of deuteration in DR21, we use pixel-by-pixel column density estimates, obtained in the manner described in Sec. 3.3, of the deuterated species presented in Table 1.
Figure 7 shows the abundance maps of X(DCO+), X(DNC) and X(DCN). The abundances of these species are similar, with median values of  and
and  . Though the median abundances of these three molecular species are indistinguishable within the interquartile range, their spatial distributions are different. DCO+ shows reduced abundances toward DR21(OH) and DR21 Main. X(DCO+) increases toward the north region of DR21 and southeast region of DR21 Main. On the contrary, X(DCN) exhibits a minor rise toward DR21(OH), while maintaining a relatively constant abundance throughout the DR21 filament.
Table 2 summarizes the abundances of deuterated species in DR21 compared with values determined for various other sources. This includes the extensively studied Taurus Molecular Cloud 1 (TMC-1), which is a quiescent dark cloud containing starless cores (Pratap et al. 1997), as well as another dark cloud, L134N (Dickens et al. 2000), which shares similar temperature (Tdust < 15 K, Gratier et al. 2016) and density (n(H2) ~ 106 cm−3, Turner 2001) characteristics to the DR21 filament. However, the primary distinction between these dark clouds lies in their chemical composition: the TMC-1 position is that of the clouds’ cyanopolyyne peak, whose chemistry is rich in carbon-chain molecules, while L134N is abundant in smaller molecules and oxygen-bearing species (Dickens et al. 2000, and references therein). G210.82−19.47N is a solar-mass star-forming core (Tatematsu et al. 2020) and IRAS 16293–2422 is a low-mass class 0 binary protostar with a rich molecular inventory surrounding a hot corino (Girart et al. 2014; Murillo et al. 2018; Kahle et al. 2023).
Compared to DR21, the abundances of most of the deuter-ated species studied here, are significantly higher in the dark clouds, but also in the translucent clouds. Both dark clouds have X(DCO+) that is comparable to that of DR21, but higher X(DNC), whereas X(DCN) is comparable in DR21 and TMC-1, but much lower than in L134N. The generally higher degrees of deuteration observed in TMC-1 and L134N relative to DR21 is a consequence of the lower gas temperatures (Tkin = 10 K) that characterize these regions (Turner 2001), which, as is discussed in Sect. 1, facilitates the deuterium enrichment.
In the low-mass star-forming regions IRAS 16293-2422 and G210.82−19.47N, the abundances are approximately an order of magnitude lower than the abundances measured in the DR21 filament. It is important to point out that accurate abundances rely on a reliable reference for N(H2). The challenge of comparing abundances is compounded by the absence of a singular approach to determining column densities of H2.
To summarize: we find similar abundances (indistinguishable within the interquartile range) only for DCO+ in the DR21 filament as for the dark clouds and even for IRAS 16293–2422. Both TMC-1 and L134N have lower dust temperatures compared to the DR21 filament. The molecular cloud TMC-1 lacks, contrary to DR21, newly formed OB stars and also has a high extinction, resulting in an absence of ultraviolet (UV) radiation inside of it. Our findings for the DR21 filament indicate that, in terms of the abundances of deuterated molecules, it comprises an intermediate stage between the low-mass star-forming regions and the large-scale structure of dark clouds.
Abundances of DCO+, DNC, and DCN toward DR21, TMC-1, L134N, IRAS 16293–2422 (LM) and G210.82–19.47N (G210).
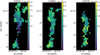 |
Fig. 7 Abundance maps of X(DCO+), X(DNC) and X(DCN). The stars mark the positions of DR21 Main (red) and DR21(OH) (blue). |
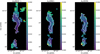 |
Fig. 8 Left to right: RD(DCO+), RD(DNC), and RD(DCN) in the DR21 filament. The stars show DR21 Main (red) and DR21(OH) (blue). The white contours show the pixels, for which RD could be determined for all three species. |
4.2 Deuteration degree in the DR21 filament
In this section, we estimate the degree of deuteration (or simply deuteration) in the DR21 filament. Deuteration is defined as RD(D) = N(XD)/N(XH), where N(XD) and N(XH) are the column densities of the D-bearing isotopolog and the H-bearing (main) isotopolog, respectively. The column density maps and the respective relative error maps are shown in Figs. C.1 and C.2. The distributions of RD(DCO+), RD(DNC), and RD(DCN) are presented in Fig. 8. For further analysis, the pixel-by-pixel RD values obtained from these maps were used.
The deuteration in all three species shows smooth distributions, with average values of 0.012 ± 0.003, 0.014 ± 0.003 and = 0.010 ± 0.002, for RD(DCO+), RD(DNC), and RD(DCN), respectively. Thus the overall degree of deuteration in the DR21 filament is Similarly, Yang et al. (2024) finds comparable deuteration between RD(DCO+), RD(DNC), and RD(DCN) toward the deuterated peaks, despite different detection rates. While significant amounts of RD(DCO+) are measured across the entire filament spanning N(H2) between 2.1 × 1022 cm−2 and 1.2 × 1024 cm−2, deuteration is particularly enriched in regions of lower H2 column densities. This is consistent with the increase in X(DCO+) toward dark clouds and translucent clouds.
The median H2 column density for which DCO+ is detected, is N(H2) = 5.9 × 1022 cm−2, whereas DNC and DCN are detected at higher H2 column densities (N(H2) = 1.1 × 1023 cm−2). This further illustrates that DCO+ samples regions that are less dense in comparison to that probed by DCN and DNC (see also Fig. 6), as a consequence of the lower critical densities (see Table 1). Taniguchi et al. (2024) found that at lower N(DCN)/N(DCO+ ) (~4–7, comparable to what we find in DR21, see Fig. D.1) favor models with higher densities.
In the overlapping region (see Fig. 8), where all three deuter-ated molecules are detected, the highest deuteration is seen for DNC with RD(DNC) = 0.014 ± 0.003, which is comparable to RD(DCN)= 0.010 ± 0.002. In contrast, RD(DCO+) is a factor ~2 lower (= 0.006 ± 0.001) in this region (summarized in Table 3). The overlapping region, in which emission from all three molecules is detected has elevated column densities. Neither RD(DNC) nor RD(DCN) are detected in the region that shows the highest RD(DCO+). This region coincides with lower dust temperatures and higher H2 column densities (see the northern region in Fig. 1 for reference).
To understand the differences in morphology, we compare the spatial variations in deuteration with the distributions of dust temperatures, molecular hydrogen column densities and kinetic gas temperatures along the DR21 filament. The resulting comparisons are presented in Fig. 9. The surroundings of DR21 Main and DR21(OH) are marked in their respective colors from Fig. 3. The surroundings of DR21 Main and DR21(OH) in this work are 34″ × 34″, corresponding to 4 pixels, based on the spatial resolution comparable to the surroundings examined by Koley et al. (2021). The molecular D/H-ratios show clear differences in their correlations with the dust temperature and H2 column density.
Figure 10 presents an overview of the Pearson correlation coefficients between RD(DCO+), RD(DNC), and RD(DCN), and Tdust, N(H2) and Tkin. We note the strongest anticorrelations (|r| ≥ 0.70) between RD(DCO+) with H2 column density and kinetic gas temperature. At Tdust ≤ 22 K, the trend for RD(DCO+) strongly decreases, whereas at Tdust ≥ 22 K, the dependence of RD(DCO+) on Tdust flattens. Similar to the dependence on Tdust, RD(DCO+) shows a decreasing trend at Tkin ≤ 22 K, which flattens out beyond Tkin = 22 K. However, the limited number of data points present in this regime prevents us from making definitive conclusions about this correlation. Both RD(DNC) and RD(DCN) display moderate to weak anticorrelations with Tdust and N(H2) and Tkin, where the trends with RD(DCN) are particularly flatter (see the right-hand panel Fig. 9). This is unsurprising because the DCN emission is detected toward a more compact region and hence shows a smaller range of deuteration.
Gerner et al. (2015) conducted a similar study on deuteration in these species for 59 high mass star-forming regions. These authors determined that luminosity (as a proxy for temperature) and H2 column density did not show a significant correlation with any of the three ratios. On average Gerner et al. (2015) reported a deuteration of 0.0025 for RD(DCO+), 0.005 for RD(DNC) and 0.02 for RD(DCN). These estimates are a factor of ~4 and ~2 lower than our estimates of RD(DCO+) and RD(DNC) while that for RD(DCN) is a factor ~2 higher than our estimates in DR21. Unlike the high mass star-forming regions studied by Gerner et al. (2015), the DR21 filament shows a stronger anti-correlation with H2 column density and RD(DCO+). However, we note that there are key differences between both studies; we compute RD using mapping observations whereas Gerner et al. (2015) performed pointed observations toward their sample of star forming regions. Hence, the D/H-ratios derived by these authors probe only the average properties of the targets studied. Moreover, these authors computed the column densities of these deuterated species using fixed values for the Texc(= Trot) based on their evolutionary stages5. Among these evolutionary stages, the IRDCs have temperatures most similar to DR21 among these evolutionary stages, Tkin = 15 K. The typical values for RD(DCO+), RD(DNC) and RD(DCN) derived by Gerner et al. (2015) for the subset of sources classified as IRDCs in their sample are 0.007, 0.008 and 0.015, respectively. These values are comparable to the mean values of the DR21 filament within the errors. Hennemann et al. (2012) investigated the evolutionary stages along the DR21 filament, where they found an increase in evolutionary gradient from the northern region of DR21 toward the DR21(OH). The deuteration fraction along the filament follows a trend of higher deuteration toward the younger region, but a detailed analysis will be done in a forthcoming paper.
Mean deuteration fraction of each molecule and the range of deuteration in the DR21-filament (where detected ≥4σtot level) and the overlapping region, where all three J = 1−0-transitions of the deuterated molecules are observed.
5 Discussion
The analysis presented thus far reveals that the strongest dependencies found are between the different physical parameters and RD(DCO+), while much weaker correlations were found for RD(DNC) and RD(DCN). Therefore, in the following sections, we explore the impact of the physical conditions, if any, on the chemistry of these species.
5.1 Impact of physical conditions on RD(DCO+)
We investigate the influence of different physical parameters and, in particular, N(H2) on the RD(DCO+). We summarize here the underlying chemistry for the formation of DCO+.
The formation of DCO+ and HCO+ are most efficient in the lower temperature regime (Tkin < 20 K). The primary formation pathway of DCO+ is the following gas phase reaction (Albertsson et al. 2013):
 (8)
(8)
The formation pathway of the main isotopolog also requires CO:
 (9)
(9)
In the low temperature (Tdust < 20 K) and high density regime (n > 104 cm−3), where CO is frozen onto the dust grains, the sparse amounts of CO available in the gas phase reacts with H2D+. As CO is sublimated from the ices, CO reacts with H3+, depleting the reservoir to form H2D+ from H3+. Consequently, RD(DCO+) peaks in Tgas ≤ 20 K and decreases with increasing temperature (Aikawa et al. 2012). The formation of DCO+ and HCO+ decreases as H3+ is destroyed before forming H2D+ (Albertsson et al. 2013). Using a time-dependent chemical model, Albertsson et al. (2013) showed a thermal dependence of DCO+ in the lower temperature regime (~30 K). Once the critical temperature for DCO+ formation is reached, the RD(DCO+) begins to decrease to the elemental abundance of D/H-ratio (~10−5) (Cooke et al. 2018). A simple thermal dependence of RD(DCO+) in low ionization fraction regions, following the temperature dependence of its precursors, has been established (Herbst 1982; Anderson et al. 1999).
Elevated temperatures driven by shocks can cause the nonthermal sublimation or sputtering of CO from dust grains. As a result, shocks can also suppress the formation of DCO+, discussed in depth in Sect. 5.1.1. Within the DR21 filament, an environment teeming with varied degrees of star formation activity along its structure (Schneider et al. 2010; Hennemann et al. 2012), regions like DR21 Main and DR21(OH) stand out, as is discussed in Sect. 3. The HII region in DR21 Main, from which the prominent bipolar-shaped outflow originates, drives shock chemistry in its surroundings (see, for example, Skretas et al. 2023). The latter region, DR21(OH), where the lowest RD(DCO+) value is observed, also exhibits clear signatures of shock chemistry (see Godard et al. 2012). Therefore, the shocks present in the vicinity of these HII regions may play a vital role in the chemistry of RD(DCO+).
For a complete understanding of the chemistry of DCO+ in DR21, one must, in addition to the environment specific effects suppress its formation, also take into account the relevant destruction pathways. The primary pathway leading to the destruction of DCO+ and HCO+ is dissociative recombination:
 (10)
(10)
and
 (11)
(11)
As a result, a higher electron fraction accelerates the destruction of HCO+ more rapidly than that of DCO+, thereby influencing the molecular isotopic ratio (Albertsson et al. 2013).
In the following sections, we discuss in more detail the influence of shocks and photodissociation on the chemistry of RD(DCO+) within the DR21 filament.
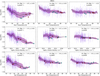 |
Fig. 9 Degrees of deuteration, RD(DCO+) (left column), RD(DNC) (middle column), and RD(DCN) (right column), with dust temperature (top row) and H2 column densities (middle row; Bonne et al. 2023) and kinetic gas temperature (bottom row) in the DR21 filament. Each point corresponds to the pixel-wise deuteration derived from the J = 1−0 and J = 2−1 or J = 3−2 transitions of DCO+, DNC, and DCN where each of the species were detected at an rms noise level ≥4<σtot. The black line shows the running mean, while the purple ranges marks the standard deviation. The red and blue stars mark the surroundings of DR21 Main and DR21 (OH), respectively. |
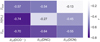 |
Fig. 10 Overview of the Pearson correlation coefficients (r) estimated for cross-correlations between DCO+, DNC, and DCN, and Tdust, N(H2) and Тkin. |
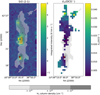 |
Fig. 11 Distribution of SiO (2−1) integrated intensity (left panel) and RD (DCO+) (right panel) the DR21 filament. The gray scale shows the N(H2) column densities, where darker regions indicate higher column densities. The stars show DR21 Main (red) and DR21(OH) (blue). |
5.1.1 Effect of shocks
In this section, we investigate the impact of shocks on the chemistry of RD(DCO+). As was discussed above, the release of CO into the gas phase readily destroys H3+ and, in turn, suppresses the formation of H2D+ and DCO+ (see Eqs. (8) and (9)). The dominant pathway leading to the desorption of CO from dust grains at lower temperatures is via nonthermal desorption driven by shocks.
Multiple sources of shocks are found in DR21, for example outflows, star-forming regions, and cloud-cloud interactions. The DR21 filament harbors one of the most extreme outflow, by mass and size, in our Milky Way namely DR21 Main (Skretas et al. 2023). Furthermore, the DR21 filament was proposed to be the result of cloud-cloud collisions (Dickel et al. 1978; Dobashi et al. 2019). Recent observations of ionized carbon (Schneider et al. 2023; Bonne et al. 2023) have refined this scenario, revealing this region to be more complex with several molecular clouds and their HI envelopes interacting.
A commonly used molecular tracer of shocks is SiO, formed by the nonthermal sputtering of Si from dust which reacts with gas phase O (Martín-Pintado et al. 1997). The specific use of SiO as a shock tracer has been demonstrated through observations and models. Observations show an increase in SiO abundances from quiescent, previously shocked, regions to dense, active regions as the center of our Milky Way (Amo-Baladrón et al. 2011; Rybarczyk et al. 2023). Theoretical models by Kelly et al. (2017) show the abundance of SiO to increase significantly (often by an order of magnitude) in regions where it encounters both slow and fast shocks. In various environments, these studies demonstrate that the presence or enhancement of the SiO molecule serves as an indicator of shock chemistry.
Given that CO is sputtered from the dust grain mantles alongside SiO, the detection of significant amounts of SiO in the gas phase indirectly traces the source of H2D+ suppression.
While it is nontrivial to infer the properties of the shocks in DR21, such as shock velocity and shock age, through abundance measurements of SiO, we compare the spatial extent of SiO emission in DR21 to decipher the role of shocks in RD(DCO+) chemistry.
Figure 11 shows the spatial distribution of the integrated intensity map of SiO (2−1), obtained with CASCADE, and RD(DCO+), alongside N(H2) between 3 × 1022 cm−2 and 1 × 1024 cm−2 overlaid in gray scale. The increased SiO (2−1) emission suggests that it coincides with the regions of decreased RD(DCO+). The regions with the highest values of N(H2) (>8 × 1022 cm−2) correspond to that of the massive dense cores, DR21 Main and DR21(OH) (see Fig. 11) which coincides with the regions where the SiO (2−1) emission is the strongest. More importantly, from this comparison it is clear that the regions where the SiO (2−1) emission dominates is also spatially coincident with the regions where we estimate the lowest values for RD(DCO+). This lends credence to our hypothesis that shocks in the vicinity of DR21 Main and DR21(OH) play an important role in regulating the chemistry and hence the deuteration present in DCO+. In addition, the attenuation of cosmic-rays in dense region such as DR21(Main) and DR21(OH) might diminish the abundance of H3+, thus decreasing the HCO+ and DCO+ abundances in these regions. Testing the importance of cosmic-rays in regulating the RD(DCO+), however, is beyond the scope of this paper.
In the top two panels of Fig. 12, we examine variations in SiO abundance with N(H2). We find a similar trend as for APEX Telescope LArge Survey of Galaxy (ATLASGAL; Schuller et al. 2009) sources SiO measurements by Csengeri et al. (2016), and the SiO J = 1−0 survey toward massive SFRs (Kim et al. 2023). These authors find that the embedded HII regions show a higher abundance compared with that of younger sources, where the shock conditions change with the massive clumps or with the age of the clump. Similarly, we find abundances of SiO in the DR21 filament as in the shocked ATLASGAL sources and SFRs at similar H2 column densities.
We find that the regions toward which we detect SiO (21) emission at rms noise levels ≥ 4σ correspond those regions with consistently low values of RD(DCO+) (< 0.03). The second panel in Fig. 12 shows a decreasing trend of RD(DCO+) with the abundance of SiO. However, this decrease occurs due to H2 column density, as the SiO abundance is independent of the H2 column density in the DR21 filament. The Pearson correlation coefficient of RD(DCO+) with H2 column density and Tdust, where SiO is detected, is r = −0.51 and r = −0.54, respectively. While a definitive conclusion regarding the state of shocked gas in DR21 cannot be reached, the spatial correlation between the shock tracer and the decreased RD(DCO+) strongly suggests that the shocks are influencing the chemistry of RD(DCO+).
5.1.2 Effects of photodissociation by ultraviolet radiation
In this section, we investigate the impact of photodissociation on the chemistry of RD(DCO+). The interface in the ISM, in which the chemistry is primarily influenced by UV photons, is known as a photodissociation region (PDR; Hollenbach & Tielens 1997). At the forefront of a PDR, H2 molecules undergo photodissociation. As the H2 column density increases (toward regions with higher extinction), the low column density (N(H) ≤2 × 1020 cm−2), ionized medium transitions to the molecular, high density (N(H) ≥ 2 × 1022 cm−2) medium. Despite only having modest abundances in the ISM, HCO is efficiently formed in PDRs via FUV (Schilke et al. 2001; Gerin et al. 2009):
 (12)
(12)
and
 (13)
(13)
where the abundance of this rare molecular species becomes comparable with that of H13CO+. Furthermore, a high abundance of HCO in the gas phase can be attained by releasing HCO from grain mantles before larger molecules form there; for example, H2CO, CH3OH and other COMs (Gerin et al. 2009). This early release of HCO to the gas phase can occur in regions with lower N(H2) that are exposed FUV radiation. Photodissociation is an obvious process associated with the well-studied HII-region DR21 Main and DR21(OH). The outer parts of DR21 dominantly affected by the interstellar UV radiation (Yamagishi et al. 2018).
The column density ratio of HCO and H13CO+ and the abundance of the latter, have been found to be increased in HII regions when compared to regions devoid of HII regions or showing minimal signs of star formation activity (Schilke et al. 2001; Gerin et al. 2009; Kim et al. 2020). N(HCO)/N(H13CO+) ≥ 1 and X(HCO) ≥ 10−10 reflects high degrees of photodissociation, and is indicative of ongoing FUV chemistry (Gerin et al. 2009; Kim et al. 2020).
In Fig. 13, we investigate the variation in FUV radiation fields by examining the column density ratio of N(HCO) and N(H13CO+) in the DR21 filament. The emission maps and column densities of HCO are described in depth in Appendix A. In all panels of Fig. 13, the surroundings of DR21(OH) is marked with a blue star. Unfortunately, we did not detect HCO, H13CO+, and DCO+ in any of the surroundings of DR21 Main, and we only detected one pixel with the three molecules simultaneously detected in the vicinity of DR21(OH). The upper panel of Fig. 13 shows a decreasing trend of the N(HCO)/N(H13CO+) ratio with H2 column density in the DR21 filament compared with values of this ratio determined for molecular clumps found in ATLASGAL, taken from (Kim et al. 2020). The observed trend is mainly driven by the decreasing abundance of HCO as a function of increasing H2 column density. The middle panel of Fig. 13 shows no variation in N(HCO)/N(H13CO+) with dust temperature neither in DR21 nor the ATLASGAL clumps. No correlation between N(HCO)/N(H13CO+) and Tdust implies that thermal desorption does not play a role in the formation of HCO (Kim et al. 2020).
The lower panel of Fig. 13 shows a correlation between N(HCO)/N(H13CO+) and RD(DCO+) with a Pearson correlation coefficient of r = 0.77. This increasing trend of RD(DCO+) with N(HCO)/N(H13CO+) starts at the point at which the abundances of DCO+ and HCO start to decrease; that is, where FUV driven chemistry commences (Gerin et al. 2009; Kim et al. 2020). These conditions can be found as the photodissociation degree decreases. As the H2 column density increases, H2 self-shielding becomes effective resulting in the decrease in the HCO+ destruction (see Eq. (11)). The decreasing trend of RD(DCO+) with N(H2) is caused by the decrease in the HCO+ destruction.
To summarize the discussion on the influence of shocks and ionization, the two physical processes affect RD(DCO+) in different ways. HCO+ is destroyed faster than DCO+ through dissociative recombination. The regions of RD(DCO+) with column density, where HCO and/or SiO are present, are marked with green in Fig. 14. We find a Pearson correlation coefficient r = −0.79 of RD(DCO+) with H2 column density where HCO is detected in Sect. 5.1.2. These are found at the lower H2 column densities. On the contrary, at higher H2 column densities, where SiO is detected, we find a Pearson correlation coefficient r = −0.51 of RD(DCO+) with H2 column density in Sect. 5.1.1. As CO reacts with H3+, the production of H2D+ is halted, successively decreasing the formation of DCO+. This suggests that FUV-chemistry affects the lower column densities and shock-chemistry affects the higher column densities in DR21, overall resulting in the strong decrease in RD(DCO+) (r = 0.74).
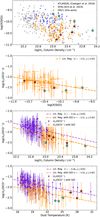 |
Fig. 12 Abundance of SiO with H2 column density in the DR21 filament and ATLASGAL sources (Csengeri et al. 2016) and SFRs (Kim et al. 2023), and RD(DCO+) with the abundance of SiO in the DR21 filament (first and second row, respectively). The third row and fourth row shows the H2 column density and the dust temperature with RD(DCO+), respectively, where purple shows non-detection of SiO and orange shows the pixels where SiO was detected ≥4σ. The red and blue stars mark the surroundings of DR21 Main and DR21(OH), respectively. |
 |
Fig. 13 N(HCO)/N(H13CO+) vs. N(H2) (top panel) and dust temperature (middle panel). The bottom panel shows the correlation of N(HCO)/N(H13CO+) with RD(DCO+). The purple points represent pixels in the DR21 filament above 4σ and the gray point shows the ATLASGAL sources from Kim et al. (2020). The black vertical line represents the indicator of ongoing FUV chemistry ≥1 (Gerin et al. 2009; Kim et al. 2020). The blue star mark the surroundings of DR21(OH), where HCO, H13CO+ and DCO+ are detected. |
5.2 Impact of physical conditions on DNC and DCN
In Sect. 4.2, it is observed that DNC and DCN are indicative of different physical conditions compared to DCO+. Specifically, they are detected in warmer and denser regions within the DR21 filament. Figure 6 illustrates that these isomers trace similar gas distributions. In this section, we aim to investigate the influence of temperature on the ratio of DNC to DCN.
Figure 9 shows that RD(DNC) and RD(DCN) have distinct dependencies on Tdust. The formation pathways of these isomers have significant differences in their thermal dependence.
In the lower temperature regime (Tdust ≤ 30 K), DNC is predominantly formed at a higher rate through deuterium reacting with the primary isotopologs, HCN and HNC. Surprisingly, in this temperature range, DCN formation occurs through the deuterium transfer of HNC (Turner 2001). Conversely, DNC and DCN efficiently form with deuterated light hydrocarbons, such as CH2D+, at higher temperatures (~80 K; Albertsson et al. 2013). At lower gas temperatures (Tgas ≤ 30 K), DCN exhibits lower formation efficiency, as it is formed through CH2D+, compared to DNC, formed through H2D+ (Turner 2001; Roueff et al. 2007). As for DNC, its formation efficiency decreases with increasing temperature since the O-atom becomes more effective in destroying this isomer (Gerner et al. 2015). However, the current study does not explore these higher temperatures as the maximum dust temperature and kinetic gas temperature measured were ≤31 K.
HCN and HNC, the primary isotopologs of these isomers, have demonstrated an ability to trace the kinetic gas temperature (see Sect. 3.3). The ratio of I(HCN)/I(HNC) at gas temperatures T ≤ 200 K is controlled by the selective destruction of HNC (Hacar et al. 2020):
 (14)
(14)
and,
 (15)
(15)
The inter-conversion between HCN and HNC becomes efficient at T > 40 K. At low temperatures, HCN and HNC are formed through ion-molecule chemistry with almost equal probability (Herbst et al. 2000; Albertsson et al. 2013). A similar effect may occur for DCN and DNC, where an increase in Tkin is necessary to initiate the conversion of DNC to DCN through reactions with free atomic D in the gas.
Figure 15 shows the intensity ratio comparisons of I(DCN)/I(DNC) with I(H13CN)/I(HN13C). In the optically thin regime of these ratios, I(H13CN)/I(HN13C) is a proxy for the kinetic gas temperature (Beuther et al. 2022; Pazukhin et al. 2022). The optical depth of each molecule is presented in Fig. B.1, which is consistent with the optically thin assumption. The intensities were used to ensure independent ratio comparison, as the column densities are inherently dependent on the temperature calculated using I(H13CN)/I(HN13C). The D-isotopologs I(H13CN)/I(HN13C) with a slope  and intercept of
  . The temperature indicator represented by I(H13CN)/I(HN13C) exhibits a moderate correlation with I(DCN)/I(DNC), implying that I(DCN)/I(DNC) is also a potential tracer of kinetic gas temperature.
Figure 16 shows a plot of dust temperature as a function of I(DCN)/I(DNC), which displays a moderate correlation between the dust temperature and the velocity-integrated intensity ratio of DCN and DNC. We find a slope a = +10 and intercept of b = +6 between the dust temperature and I(DCN)/I(DNC). This correlation implies a kinetic gas temperature of Tdust = 10 × (DCN/DNC) + 6. Hacar et al. (2020) reported a one-to-one correlation between dust temperature and the kinetic temperature derived from the intensity ratio of HCN to HNC. By applying the same approach to obtain kinetic gas temperature (Eq. (5)), but using the intensity ratio of DCN to DNC instead and multiplying it by ten, we establish a one-to-one relationship between the kinetic gas temperature (Tkin) derived from DCN/DNC and the dust temperature in DR21.
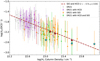 |
Fig. 14 RD(DCO+) with column density, where in gray are all the pixels measured in DR21, purple is RD(DCO+) where N(HCO)/N(H13CO+) was measured, orange is where X(SiO) was measured, and green is where N(HCO)/N(H13CO+) and X(SiO) intersect. The linear fit, where SiO and HCO are detected, is shown in dashed brown. The red and blue stars mark the surroundings of DR21 Main and DR21(OH), respectively. |
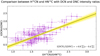 |
Fig. 15 Integrated intensity ratio of DCN and DNC with the ratio of H13CN and HN13C of optically thin region (orange), as a proxy for the kinetic gas temperature following Hacar et al. (2020) with a Pearson correlation of r = 0.72. |
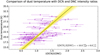 |
Fig. 16 Dust temperature as a function of integrated intensity ratio of DCN and DNC with a Pearson correlation of r = 0.58. |
6 Conclusions
In this paper, we have investigated the distribution of deuterated molecules in DR21 as part of the Cygnus-X Allscale Survey of Chemistry And Dynamical Environment. Using the IRAM 30-m telescope, observations of the ground-state of DCO+, DNC, and DCN at 3–4 mm and follow-up observations of higher J-tгansitions at 2 and 1.3 mm wavelengths were carried out. The main results are summarized below:
The emission maps of DCO+, DNC, and DCN show clear morphological differences along the DR21 filament. DCO+ shows the most extended emission along the DR21 ridge, with several peaks along its structure. DNC is also observed to have several peaks but less extended emission than DCO+. DCN shows relatively compact emission toward the DR21 Main and DR21(OH) star-forming clumps. The morphological differences of these three molecules suggest local variations in physical parameters.
The column densities derived from the optically thin lines from DCO+, DNC, and DCN, as well H13CO+, HN13C, and H13CN, together with the Herschel-based H2 column density, indicate similar mean abundances of the deuterated molecules, on the order of X(D) ~ 6–9 × 10⁻¹¹. All three molecules are observed toward higher H2 column densities.
-
The deuteration degrees, RD, of all three species have similar values, between 0.010 and 0.014. RD(DCO+) and RD(DNC) shows a strong anticorrelation with dust temperature (r < −0.5) and all three shows strong anticorrelation with kinetic gas temperature, the highest value of which (r = −0.70) is found for RD(DCO+).
The three ratios between the deuterated molecules, N(DCO+)/N(DNC) and N(DCO+)/N(DCN), show anticorrelations with the dust temperatures in the regime in which CO is not yet sublimated (Tdust ≤ 22 K). On the contrary, N(DCN)/N(DNC) shows an increasing correlation at Tdust ≤ 22 K. After the onset of thermal CO-sublimation, all three ratios are constant with dust temperature.
RD(DCO+) decreases with H2 column density. We attempted to explain this decrease with ionization and shocks. At lower column densities, FUV chemistry, as traced by N(HCO)/N(H13CO+), is likely causing the rapid decrease by effectively destroying HCO+ faster than DCO+. RD(DCO+) decreases with an increasing column density of SiO, a well-known shock tracer. Ionization, shocks, and the initial ortho-to-para H2 ratio, although the latter is not quantified, appear to have an effect on the decrease in RD(DCO+). The relative influence of the degree of ionization or shocks affecting the decreasing RD (DCO+) is hard to discern solely based on the molecular content, as DR21 is a dynamic and complex filament with a powerful HII-region, a substantial outflow, several star-forming regions in different evolutionary stages, and cloud-cloud interactions.
The DCN/DNC-ratio was investigated as a possible kinetic gas temperature tracer. At higher N(H2), with the HN13C and H13CN lines being optically thin, a strong correlation is found. The obtained correlation is I(DCN)/I(DNC) = 0.9 × I(H13CN)/I(HN13C) − 0.4.
Acknowledgements
The authors would like to thank the anonymous referee for their suggestions and constructive comments that improved the overall quality of the manuscript. The authors are also grateful to the staff at the Pico Veleta observatories for their support of these observations. I.B.C. is a member of the International Max-Planck Research School at the universities of Bonn and Cologne (IMPRS). This work is based on observations carried out under project number 145-19, 031-20 and 053-21 with the IRAM 30m telescope. I.R.A.M. is supported by INSU/CNRS (France), MPG (Germany) and IGN (Spain). D.S. acknowledges support from the European Research Council under the Horizon 2020 Framework Program via the ERC Advanced Grant Origins 83 24 28. N.S. acknowledges support from the FEEDBACK-plus project that is supported by the BMWI via DLR, Projekt Number 50OR2217. N.C. acknowledges funding from the European Research Council (ERC) via the ERC Synergy Grant ECO-GAL (grant 855130), from the French Agence Nationale de la Recherche (ANR) through the project COSMHIC (ANR-20- CE31-0009).
Appendix A CASCADE emission maps
Velocity-integrated intensity maps of the strong and extended emission of the main isotopologs HCN and HNC can be seen in two leftmost panels of Fig. A.1. The emission in both species peak toward DR21 Main and DR21(OH). The intensity ratio between these two molecules is used for kinetic temperature determinations, as is described in Sect. 3.3.
The three right panels show the integrated intensity distributions of the three HCO HFS components of this molecule’s  rotational line. These are the J = 3/2 − 1/2, F = 2 − 1, J = 3/2 − 1/2, F = 1 − 0 and J = 1/2 − 1/2, F = 1 − 1 lines. Spectroscopic information for the HCO HFS lines is presented in Table A.1.
Spectroscopic information for the SiO (2 − 1) lines is presented in Table A.1. SiO (2−1) is covered as part of the CASCADE program. The integrated intensity map of SiO (2−1) is shown in Fig. 11.
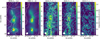 |
Fig. A.1 Ground-state emission of HCN, HNC, and HCO observed with the CASCADE program. The white contours show the 4σ, 8σ, and 12σ levels. The stars show DR21 Main (red) and DR21(OH) (blue), with the F1 and F3 sub-filaments marked in dashed red and magenta curves. |
Spectroscopic information for the HCO and SiO lines covered by CASCADE.
Appendix B Optical depth
The 12C-bearing main isotopolog lines of the molecules studied by us are optically thick and even the opacities of the 13C-bearing isotopologs are expected to be non-negligible. The determination of the optical depth of the lines from each molecule relies on the ratio of its 12C-bearing isotopolog to its 13C-bearing one. Under the assumption that the beam filling factor, f, of each pixel is equal for both lines, the ratio of the main beam brightness temperature of a line from the main isotopolog,  , to that of the less common 13C-bearing isotopolog,
  , is given by
 (B.1)
(B.1)
where Tbg is the temperature of the cosmic microwave background (2.73 K). Further assuming that the frequencies and the excitation temperatures, Tex, of both lines are the same, results in an isotopic ratio of 68 for Cygnus-X (see Sect. 3.3) and thec line being optically thin (so that  . This simplifies to
 (B.2)
(B.2)
From the roots of this equation, we can determine  using the Python package scipy.optimize.newton_krylov. Fig. B.1 presents the pixel-by-pixel opacity map of the DR21 filament.
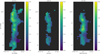 |
Fig. B.1 Left to right: Opacity maps of H13CO+, HN13C and H13CN. The stars mark the positions of DR21 Main (red) and DR21(OH) (blue). |
Appendix C Column density maps
The distribution of the column densities derived in Sec. 3.3 is shown in Fig. C.1. The column densities were determined using the scipy.optimize.curve_fit, in which each fitting of Eq. 3 results in the best fit of Nu/𝑔u and the respective fit error. The column density maps for DCO+, DNC, and DCN, and the respective main isotopologs HCO+, HNC, and HCN are presented in Fig. C.1, with the relative error maps presented in Fig. C.2. The column density for the main isotopologs were calculated using the optically thin 13C-isotopologs and assuming 12C/13C = 68.
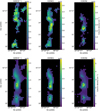 |
Fig. C.1 Top panel, left to right: Column density distribution maps of DCO+, DNC, and DCN and their main isotopologs HCO+, HNC, and HCN (bottom panel). The stars mark the positions of DR21 Main (red) and DR21(OH) (blue). |
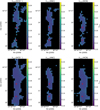 |
Fig. C.2 Top panel, left to right: Relative column density error distributions for DCO+, DNC, and DCN and their main isotopologs HCO+, HNC, and HCN (bottom panel). The stars mark the positions of DR21 Main (red) and DR21(OH) (blue). |
Appendix D N(XD)/N(YD)
The dust temperature, H2 column density and kinetic gas temperature dependence of the N(XD)/N(YD) ratios are presented in Fig. D.1. The comparison of column density ratios with Tdust are presented in the left plots. Blue data points with Tdust below 22 K exhibit considerable temperature dependencies; r = −0.61 for log(N(DCO+)/N(DCN)) and r = −0.56 for log(N(DCO+ )/N(DNC)). A negligible dependence on log(N(DCN)/N(DNC)) with temperature was found (r = +0.46). On the contrary, all three ratios show no correlation with dust temperature in the higher temperature regime (22 K ≤ Tdust ≤ 31 K). The Pearson correlation coefficients of the higher temperatures are r = +0.14 for log(N(DCO+)/N(DCN)), r = +0.45 for log(N(DCO+)/N(DNC)), and r = +0.28 for log(N(DCN)/N(DNC))) with p > 0.05.
The N(XD)/N(YD) trends with H2 column density are r = −0.55 for log(N(DCO+)/N(DCN)), r = −0.69 for log(N(DCO+)/N(DNC)) and r = +0.12 for log(N(DCN)/N(DNC)). This strong dependence is also reflected in the RD(DCO+) and RD(DNC) ratio seen in the top left and middle of Fig. 9, respectively. The strong anticorrelation of RD(DCO+) is discussed further in Sect. 5.1.
log(N(DCO+)/N(DNC)) and log(N(DCN)/N(DNC)) show strong correlations with kinetic gas temperature. An anticorrela-tion with log(N(DCO+)/N(DNC)) is found, r = −0.63 and a negligible r = −0.48 with log(N(DCO+)/N(DCN)). On the contrary, a positive correlation is found between log(N(DCN)/N(DNC)) with a Pearson correlation coefficient of r = +0.66. It should be noted that the kinetic gas temperature was used to determine the column densities. This reflects on the formation pathway dependencies on temperature, in which the production of DCO+ is highest at the lowest temperature, less for DNC, and least for DCN.
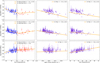 |
Fig. D.1 Deuterated molecular ratios with respect to the dust temperature (left) and column density (center) and kinetic gas temperature (right) of N(DCO+)/N(DCN) (top), N(DCO+)/N(DNC) (middle) and N(DCN)/N(DNC) (bottom). An onset of CO sublimation from grains is expected from Tdust ~ 22 K, with blue data points showing the CO freeze-out regime. |
References
- Aikawa, Y., Wakelam, V., Hersant, F., Garrod, R. T., & Herbst, E. 2012, ApJ, 760, 40 [NASA ADS] [CrossRef] [Google Scholar]
- Albertsson, T., Semenov, D. A., Vasyunin, A. I., Henning, T., & Herbst, E. 2013, ApJS, 207, 27 [CrossRef] [Google Scholar]
- Amo-Baladrón, M. A., Martín-Pintado, J., & Martin, S. 2011, A&A, 526, A54 [NASA ADS] [CrossRef] [EDP Sciences] [Google Scholar]
- Anderson, I. M., Caselli, P., Haikala, L. K., & Harju, J. 1999, A&A, 347, 983 [NASA ADS] [Google Scholar]
- Beuther, H., Wyrowski, F., Menten, K. M., et al. 2022, A&A, 665, A63 (Paper I) [NASA ADS] [CrossRef] [EDP Sciences] [Google Scholar]
- Bonne, L., Bontemps, S., Schneider, N., et al. 2023, ApJ, 951, 39 [CrossRef] [Google Scholar]
- Carter, M., Lazareff, B., Maier, D., et al. 2012, A&A, 538, A89 [NASA ADS] [CrossRef] [EDP Sciences] [Google Scholar]
- Caselli, P., Walmsley, C. M., Terzieva, R., & Herbst, E. 1998, ApJ, 499, 234 [Google Scholar]
- Cooke, R. J., Pettini, M., & Steidel, C. C. 2018, ApJ, 855, 102 [Google Scholar]
- Csengeri, T., Leurini, S., Wyrowski, F., et al. 2016, A&A, 586, A149 [NASA ADS] [CrossRef] [EDP Sciences] [Google Scholar]
- Dickel, J. R., Dickel, H. R., & Wilson, W. J. 1978, ApJ, 223, 840 [Google Scholar]
- Dickens, J. E., Irvine, W. M., Snell, R. L., et al. 2000, ApJ, 542, 870 [CrossRef] [Google Scholar]
- Dobashi, K., Shimoikura, T., Katakura, S., Nakamura, F., & Shimajiri, Y. 2019, PASJ, 71, S12 [NASA ADS] [CrossRef] [Google Scholar]
- Downes, D., & Rinehart, R. 1966, ApJ, 144, 937 [Google Scholar]
- Favre, C., Bergin, E. A., Cleeves, L. I., et al. 2015, ApJ, 802, L23 [NASA ADS] [CrossRef] [Google Scholar]
- Flower, D. R., Pineau des Forêts, G., & Walmsley, C. M. 2006, A&A, 449, 621 [NASA ADS] [CrossRef] [EDP Sciences] [Google Scholar]
- Fontani, F., Palau, A., Caselli, P., et al. 2011, A&A, 529, A7 [CrossRef] [EDP Sciences] [Google Scholar]
- Gerin, M., Goicoechea, J. R., Pety, J., & Hily-Blant, P. 2009, A&A, 494, 977 [NASA ADS] [CrossRef] [EDP Sciences] [Google Scholar]
- Gerner, T., Shirley, Y. L., Beuther, H., et al. 2015, A&A, 579, A80 [NASA ADS] [CrossRef] [EDP Sciences] [Google Scholar]
- Giannetti, A., Wyrowski, F., Brand, J., et al. 2014, A&A, 570, A65 [NASA ADS] [CrossRef] [EDP Sciences] [Google Scholar]
- Girart, J. M., Estalella, R., Palau, A., Torrelles, J. M., & Rao, R. 2014, ApJ, 780, L11 [Google Scholar]
- Girichidis, P., Offner, S. S. R., Kritsuk, A. G., et al. 2020, Space Sci. Rev., 216, 68 [NASA ADS] [CrossRef] [Google Scholar]
- Godard, B., Falgarone, E., Gerin, M., et al. 2012, A&A, 540, A87 [NASA ADS] [CrossRef] [EDP Sciences] [Google Scholar]
- Goldsmith, P. F., & Langer, W. D. 1999, ApJ, 517, 209 [Google Scholar]
- Gratier, P., Majumdar, L., Ohishi, M., et al. 2016, ApJS, 225, 25 [Google Scholar]
- Guzmán, A. E., Guzmán, V. V., Garay, G., Bronfman, L., & Hechenleitner, F. 2018, ApJS, 236, 45 [CrossRef] [Google Scholar]
- Hacar, A., Bosman, A. D., & van Dishoeck, E. F. 2020, A&A, 635, A4 [NASA ADS] [CrossRef] [EDP Sciences] [Google Scholar]
- Hennemann, M., Motte, F., Schneider, N., et al. 2012, A&A, 543, A3 [Google Scholar]
- Herbst, E. 1982, A&A, 111, 76 [NASA ADS] [Google Scholar]
- Herbst, E., Terzieva, R., & Talbi, D. 2000, MNRAS, 311, 869 [NASA ADS] [CrossRef] [Google Scholar]
- Hocuk, S., Cazaux, S., & Spaans, M. 2014, MNRAS, 438, L56 [NASA ADS] [CrossRef] [Google Scholar]
- Hollenbach, D. J., & Tielens, A. G. G. M. 1997, ARA&A, 35, 179 [NASA ADS] [CrossRef] [Google Scholar]
- Immer, K., Cyganowski, C., Reid, M. J., & Menten, K. M. 2014, A&A, 563, A39 [NASA ADS] [CrossRef] [EDP Sciences] [Google Scholar]
- Jacob, A. M., Menten, K. M., Wiesemeyer, H., et al. 2020, A&A, 640, A125 [EDP Sciences] [Google Scholar]
- Kahle, K. A., Hernández-Gómez, A., Wyrowski, F., & Menten, K. M. 2023, A&A, 673, A143 [NASA ADS] [CrossRef] [EDP Sciences] [Google Scholar]
- Kelly, G., Viti, S., García-Burillo, S., et al. 2017, A&A, 597, A11 [NASA ADS] [CrossRef] [EDP Sciences] [Google Scholar]
- Kim, W. J., Wyrowski, F., Urquhart, J. S., et al. 2020, A&A, 644, A160 [NASA ADS] [CrossRef] [EDP Sciences] [Google Scholar]
- Kim, W. J., Urquhart, J. S., Veena, V. S., et al. 2023, A&A, 679, A123 [NASA ADS] [CrossRef] [EDP Sciences] [Google Scholar]
- Koley, A., Roy, N., Menten, K. M., et al. 2021, MNRAS, 501, 4825 [Google Scholar]
- Li, S., Sanhueza, P., Lu, X., et al. 2022, ApJ, 939, 102 [CrossRef] [Google Scholar]
- Linsky, J. L. 1998, Space Sci. Rev., 84, 285 [NASA ADS] [CrossRef] [Google Scholar]
- Mangum, J. G., Wootten, A., & Mundy, L. G. 1992, ApJ, 388, 467 [NASA ADS] [CrossRef] [Google Scholar]
- Martín-Pintado, J., de Vicente, P., Fuente, A., & Planesas, P. 1997, ApJ, 482, L45 [NASA ADS] [CrossRef] [Google Scholar]
- McKee, C. F., & Tan, J. C. 2002, Nature, 416, 59 [CrossRef] [Google Scholar]
- McKee, C. F., & Tan, J. C. 2003, ApJ, 585, 850 [Google Scholar]
- Millar, T. J., Bennett, A., & Herbst, E. 1989, ApJ, 340, 906 [NASA ADS] [CrossRef] [Google Scholar]
- Motte, F., Bontemps, S., Schilke, P., et al. 2007, A&A, 476, 1243 [NASA ADS] [CrossRef] [EDP Sciences] [Google Scholar]
- Motte, F., Zavagno, A., Bontemps, S., et al. 2010, A&A, 518, L77 [CrossRef] [EDP Sciences] [Google Scholar]
- Müller, H. S. P., Thorwirth, S., Roth, D. A., & Winnewisser, G. 2001, A&A, 370, L49 [Google Scholar]
- Murillo, N. M., van Dishoeck, E. F., van der Wiel, M. H. D., et al. 2018, A&A, 617, A120 [NASA ADS] [CrossRef] [EDP Sciences] [Google Scholar]
- Nyman, L. A. 1983, A&A, 120, 307 [NASA ADS] [Google Scholar]
- Oliveira, C. M., Hébrard, G., Howk, J. C., et al. 2003, ApJ, 587, 235 [NASA ADS] [CrossRef] [Google Scholar]
- Ossenkopf, V., Röllig, M., Simon, R., et al. 2010, A&A, 518, A79 [Google Scholar]
- Parise, B., Ceccarelli, C., Tielens, A. G. G. M., et al. 2002, A&A, 393, L49 [NASA ADS] [CrossRef] [EDP Sciences] [Google Scholar]
- Pazukhin, A. G., Zinchenko, I. I., Trofimova, E. A., & Henkel, C. 2022, Astron. Rep., 66, 1302 [NASA ADS] [CrossRef] [Google Scholar]
- Pety, J. 2005, in SF2A-2005: Semaine de l’Astrophysique Francaise, eds. F. Casoli, T. Contini, J. M. Hameury, & L. Pagani (EdP Sciences), 721 [Google Scholar]
- Pety, J. 2018, in Submillimetre Single-dish Data Reduction and Array Combination Techniques, 11 [Google Scholar]
- Pickett, H. M., Poynter, R. L., Cohen, E. A., et al. 1998, J. Quant. Spectrosc. Radiat. Transf., 60, 883 [Google Scholar]
- Pillai, T., Caselli, P., Kauffmann, J., et al. 2012, ApJ, 751, 135 [Google Scholar]
- Pratap, P., Dickens, J. E., Snell, R. L., et al. 1997, ApJ, 486, 862 [Google Scholar]
- Reipurth, B., & Schneider, N. 2008, in Handbook of Star Forming Regions, Volume I, 4, ed. B. Reipurth (San Francisco : ASP), 36 [NASA ADS] [Google Scholar]
- Roberts, H., & Millar, T. J. 2000a, A&A, 364, 780 [NASA ADS] [Google Scholar]
- Roberts, H., & Millar, T. J. 2000b, A&A, 361, 388 [NASA ADS] [Google Scholar]
- Roberts, H., Herbst, E., & Millar, T. J. 2004, A&A, 424, 905 [NASA ADS] [CrossRef] [EDP Sciences] [Google Scholar]
- Roueff, E., Parise, B., & Herbst, E. 2007, A&A, 464, 245 [NASA ADS] [CrossRef] [EDP Sciences] [Google Scholar]
- Rybarczyk, D. R., Stanimirovic, S., & Gusdorf, A. 2023, ApJ, 950, 52 [NASA ADS] [CrossRef] [Google Scholar]
- Rygl, K. L. J., Brunthaler, A., Sanna, A., et al. 2012, A&A, 539, A79 [NASA ADS] [CrossRef] [EDP Sciences] [Google Scholar]
- Sabatini, G., Bovino, S., Giannetti, A., et al. 2020, A&A, 644, A34 [EDP Sciences] [Google Scholar]
- Schilke, P., Pineau des Forêts, G., Walmsley, C. M., & Martín-Pintado, J. 2001, A&A, 372, 291 [NASA ADS] [CrossRef] [EDP Sciences] [Google Scholar]
- Schneider, N., Bontemps, S., Simon, R., et al. 2006, A&A, 458, 855 [NASA ADS] [CrossRef] [EDP Sciences] [Google Scholar]
- Schneider, N., Csengeri, T., Bontemps, S., et al. 2010, A&A, 520, A49 [CrossRef] [EDP Sciences] [Google Scholar]
- Schneider, N., Bonne, L., Bontemps, S., et al. 2023, Nat. Astron., 7, 546 [NASA ADS] [CrossRef] [Google Scholar]
- Schuller, F., Menten, K. M., Contreras, Y., et al. 2009, A&A, 504, 415 [NASA ADS] [CrossRef] [EDP Sciences] [Google Scholar]
- Shirley, Y. L. 2015, PASP, 127, 299 [Google Scholar]
- Skretas, I. M., Karska, A., Wyrowski, F., et al. 2023, A&A, 679, A66 (Paper II) [NASA ADS] [CrossRef] [EDP Sciences] [Google Scholar]
- Taniguchi, K., Rayalacheruvu, P., Yonetsu, T., et al. 2024, ApJ, 963, 12 [Google Scholar]
- Tatematsu, K., Liu, T., Kim, G., et al. 2020, ApJ, 895, 119 [NASA ADS] [CrossRef] [Google Scholar]
- Tielens, A. 2021, Molecular Astrophysics (Cambridge University Press) [CrossRef] [Google Scholar]
- Tiné, S., Roueff, E., Falgarone, E., Gerin, M., & Pineau des Forêts, G. 2000, A&A, 356, 1039 [NASA ADS] [Google Scholar]
- Turner, B. E. 2001, ApJS, 136, 579 [Google Scholar]
- van Dishoeck, E. F., Blake, G. A., Jansen, D. J., & Groesbeck, T. D. 1995, ApJ, 447, 760 [Google Scholar]
- Vastel, C., Mookerjea, B., Pety, J., & Gerin, M. 2017, A&A, 597, A45 [NASA ADS] [CrossRef] [EDP Sciences] [Google Scholar]
- Watson, W. D. 1974, ApJ, 188, 35 [NASA ADS] [CrossRef] [Google Scholar]
- Wilson, T. L., & Rood, R. 1994, ARA&A, 32, 191 [Google Scholar]
- Wootten, A. 1987, in Astrochemistry, eds. M. S. Vardya, & S. P. Tarafdar, IAU Symp., 120, 311 [NASA ADS] [Google Scholar]
- Yamagishi, M., Nishimura, A., Fujita, S., et al. 2018, ApJS, 235, 9 [Google Scholar]
- Yan, Y. T., Henkel, C., Kobayashi, C., et al. 2023, A&A, 670, A98 [NASA ADS] [CrossRef] [EDP Sciences] [Google Scholar]
- Yang, K., Wang, J., Qiu, K., & Zhang, T. 2024, ApJS, 270, 35 [NASA ADS] [CrossRef] [Google Scholar]
This telescope’s HPBW (in arcseconds) is well repre sented by 2460/ν (GHz); see https://publicwiki.iram.es/Iram30mEfficiencies
T = 15 K for IRDCs, T = 50 K for HMPOs, T = 100 K for HMCs and T = 100 K for UCHII.
All Tables
Frequencies and spectroscopic properties of the deuterated molecules and their corresponding 13C-isotopologs presented in this study alongside the spectral line properties obtained by averaging over the entire DR21 filament are presented.
Abundances of DCO+, DNC, and DCN toward DR21, TMC-1, L134N, IRAS 16293–2422 (LM) and G210.82–19.47N (G210).
Mean deuteration fraction of each molecule and the range of deuteration in the DR21-filament (where detected ≥4σtot level) and the overlapping region, where all three J = 1−0-transitions of the deuterated molecules are observed.
All Figures
|
Fig. 1 Maps of dust temperature (left) and H2 column density (right) of the DR21 filament taken determined by the HOBYS program (Motte et al. 2010). The stars in both maps indicate the positions of DR21 Main (red) and DR21(OH) (blue). The dashed red and orange lines show the coverage of CASCADE and follow-up observations, respectively. |
| In the text | |
|
Fig. 2 Average spectra of DCO+, DNC, and DCN, and their 13C-isotopologs in the DR21 filament. The black line shows the spectra averaged over the entire mapped region of the DR21 filament for different molecules with the purple region showing the velocity range used for determining integrated intensities. The dashed gray line denotes the main velocity of the filament, υLSR = −3 km s−1. The velocities of the un- or only marginally blended HFS components of DCN and H13CN are marked in black, with the relative intensity of the hyperfine components marked by the length. The LSR velocity scale of the DCN and H13CN J = 1−0 spectra corresponds to the strongest HFS component F = 2−1. |
| In the text | |
|
Fig. 3 Velocity-integrated intensity maps of deuterated and 13C-isotopologs. Top and middle rows: Ground-state emission of DCO+, DNC, and DCN observed with the CASCADE-program and follow-up mapping with the IRAM 30-m telescope. Bottom row: Maps for 13C-isotopologs. The intensities in the maps are integrated over the velocity range −7 km s−1 to +0.5 km s−1. HPBWs are displayed by the filled white circles in the lower left corner of each panel. For example, the HPBW beam-size is 34″ for the map showing DNC (2−1), 16″ for DCO+ (3−2) and 11″ for DCN (3−2). The white contours are showing levels of 4σ, 8σ and 12σ. The stars mark DR21 Main (red) and DR21(OH) (blue). The locations of the F1 and F3 sub-filament (Schneider et al. 2010) are indicated by dashed red and magenta curves, respectively. |
| In the text | |
|
Fig. 4 Kinetic gas temperature calculated using the integrated intensity ratio of HCN and HNC for the lower column densities and H13CN and HN13C for the higher column densities (left) and dust temperature in the same region for comparison (right). The red contour shows the column density of N(H2)≥ 1 × 1023 cm−2. The stars show DR21 Main (red) and DR21(OH) (blue). The right panel shows the comparison of dust temperature in that same region. |
| In the text | |
|
Fig. 5 Cross-correlations of integrated intensity maps of DCO+ (1−0), DNC (1−0), DCN (1−0), DCO+ (3−2), DNC (2−1), and DCN (3−2). |
| In the text | |
|
Fig. 6 Cumulative distribution function (CDF) of dust temperature and H2 column density where DCO+ (purple), DNC (orange), or DCN (blue) is detected in the DR21 filament. The dust temperatures and H2 column density maps are taken from Bonne et al. (2023). The horizontal dashed lines marks the mean dust temperature or column density of the sampled distributions, colorized with the respective detected molecular ratio. |
| In the text | |
|
Fig. 7 Abundance maps of X(DCO+), X(DNC) and X(DCN). The stars mark the positions of DR21 Main (red) and DR21(OH) (blue). |
| In the text | |
|
Fig. 8 Left to right: RD(DCO+), RD(DNC), and RD(DCN) in the DR21 filament. The stars show DR21 Main (red) and DR21(OH) (blue). The white contours show the pixels, for which RD could be determined for all three species. |
| In the text | |
|
Fig. 9 Degrees of deuteration, RD(DCO+) (left column), RD(DNC) (middle column), and RD(DCN) (right column), with dust temperature (top row) and H2 column densities (middle row; Bonne et al. 2023) and kinetic gas temperature (bottom row) in the DR21 filament. Each point corresponds to the pixel-wise deuteration derived from the J = 1−0 and J = 2−1 or J = 3−2 transitions of DCO+, DNC, and DCN where each of the species were detected at an rms noise level ≥4<σtot. The black line shows the running mean, while the purple ranges marks the standard deviation. The red and blue stars mark the surroundings of DR21 Main and DR21 (OH), respectively. |
| In the text | |
|
Fig. 10 Overview of the Pearson correlation coefficients (r) estimated for cross-correlations between DCO+, DNC, and DCN, and Tdust, N(H2) and Тkin. |
| In the text | |
|
Fig. 11 Distribution of SiO (2−1) integrated intensity (left panel) and RD (DCO+) (right panel) the DR21 filament. The gray scale shows the N(H2) column densities, where darker regions indicate higher column densities. The stars show DR21 Main (red) and DR21(OH) (blue). |
| In the text | |
|
Fig. 12 Abundance of SiO with H2 column density in the DR21 filament and ATLASGAL sources (Csengeri et al. 2016) and SFRs (Kim et al. 2023), and RD(DCO+) with the abundance of SiO in the DR21 filament (first and second row, respectively). The third row and fourth row shows the H2 column density and the dust temperature with RD(DCO+), respectively, where purple shows non-detection of SiO and orange shows the pixels where SiO was detected ≥4σ. The red and blue stars mark the surroundings of DR21 Main and DR21(OH), respectively. |
| In the text | |
|
Fig. 13 N(HCO)/N(H13CO+) vs. N(H2) (top panel) and dust temperature (middle panel). The bottom panel shows the correlation of N(HCO)/N(H13CO+) with RD(DCO+). The purple points represent pixels in the DR21 filament above 4σ and the gray point shows the ATLASGAL sources from Kim et al. (2020). The black vertical line represents the indicator of ongoing FUV chemistry ≥1 (Gerin et al. 2009; Kim et al. 2020). The blue star mark the surroundings of DR21(OH), where HCO, H13CO+ and DCO+ are detected. |
| In the text | |
|
Fig. 14 RD(DCO+) with column density, where in gray are all the pixels measured in DR21, purple is RD(DCO+) where N(HCO)/N(H13CO+) was measured, orange is where X(SiO) was measured, and green is where N(HCO)/N(H13CO+) and X(SiO) intersect. The linear fit, where SiO and HCO are detected, is shown in dashed brown. The red and blue stars mark the surroundings of DR21 Main and DR21(OH), respectively. |
| In the text | |
|
Fig. 15 Integrated intensity ratio of DCN and DNC with the ratio of H13CN and HN13C of optically thin region (orange), as a proxy for the kinetic gas temperature following Hacar et al. (2020) with a Pearson correlation of r = 0.72. |
| In the text | |
|
Fig. 16 Dust temperature as a function of integrated intensity ratio of DCN and DNC with a Pearson correlation of r = 0.58. |
| In the text | |
|
Fig. A.1 Ground-state emission of HCN, HNC, and HCO observed with the CASCADE program. The white contours show the 4σ, 8σ, and 12σ levels. The stars show DR21 Main (red) and DR21(OH) (blue), with the F1 and F3 sub-filaments marked in dashed red and magenta curves. |
| In the text | |
|
Fig. B.1 Left to right: Opacity maps of H13CO+, HN13C and H13CN. The stars mark the positions of DR21 Main (red) and DR21(OH) (blue). |
| In the text | |
|
Fig. C.1 Top panel, left to right: Column density distribution maps of DCO+, DNC, and DCN and their main isotopologs HCO+, HNC, and HCN (bottom panel). The stars mark the positions of DR21 Main (red) and DR21(OH) (blue). |
| In the text | |
|
Fig. C.2 Top panel, left to right: Relative column density error distributions for DCO+, DNC, and DCN and their main isotopologs HCO+, HNC, and HCN (bottom panel). The stars mark the positions of DR21 Main (red) and DR21(OH) (blue). |
| In the text | |
|
Fig. D.1 Deuterated molecular ratios with respect to the dust temperature (left) and column density (center) and kinetic gas temperature (right) of N(DCO+)/N(DCN) (top), N(DCO+)/N(DNC) (middle) and N(DCN)/N(DNC) (bottom). An onset of CO sublimation from grains is expected from Tdust ~ 22 K, with blue data points showing the CO freeze-out regime. |
| In the text | |
Current usage metrics show cumulative count of Article Views (full-text article views including HTML views, PDF and ePub downloads, according to the available data) and Abstracts Views on Vision4Press platform.
Data correspond to usage on the plateform after 2015. The current usage metrics is available 48-96 hours after online publication and is updated daily on week days.
Initial download of the metrics may take a while.