Open Access
Fig. A.1
Download original image
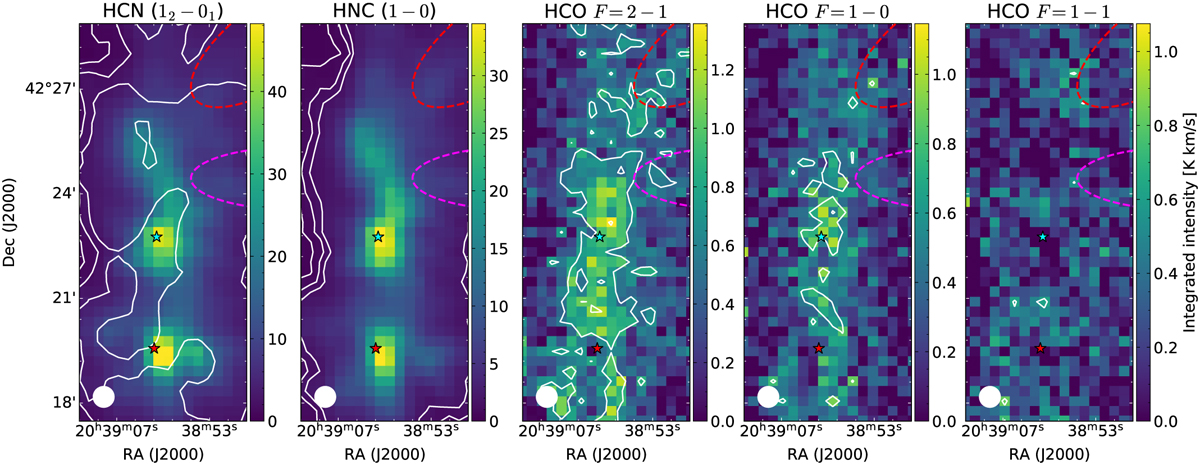
Ground-state emission of HCN, HNC, and HCO observed with the CASCADE program. The white contours show the 4σ, 8σ, and 12σ levels. The stars show DR21 Main (red) and DR21(OH) (blue), with the F1 and F3 sub-filaments marked in dashed red and magenta curves.
Current usage metrics show cumulative count of Article Views (full-text article views including HTML views, PDF and ePub downloads, according to the available data) and Abstracts Views on Vision4Press platform.
Data correspond to usage on the plateform after 2015. The current usage metrics is available 48-96 hours after online publication and is updated daily on week days.
Initial download of the metrics may take a while.