Fig. 2
Download original image
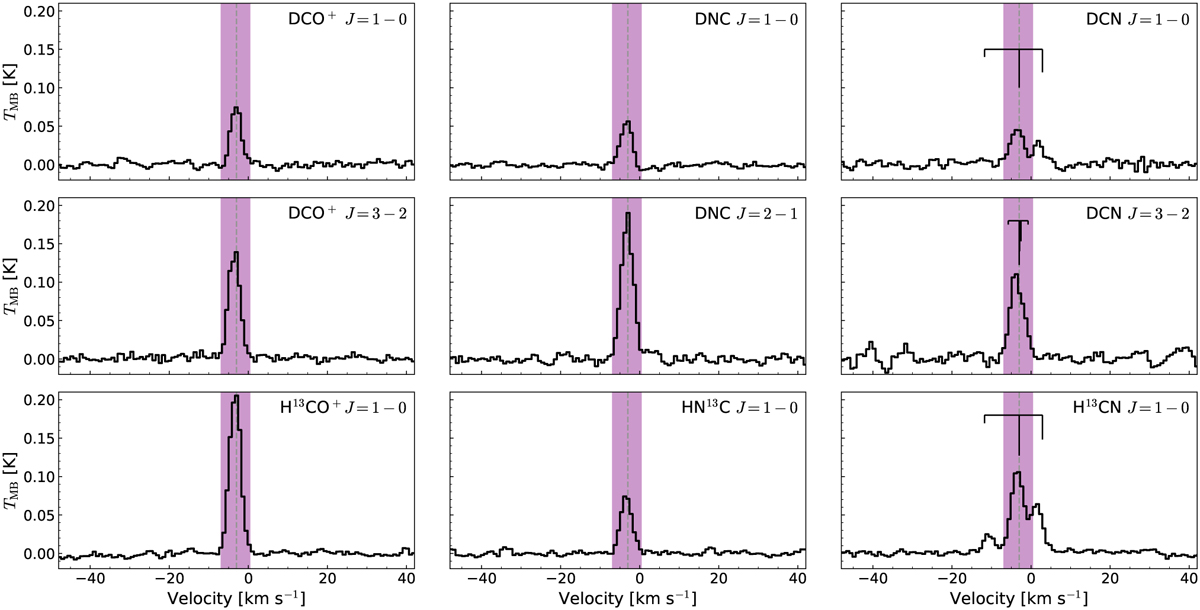
Average spectra of DCO+, DNC, and DCN, and their 13C-isotopologs in the DR21 filament. The black line shows the spectra averaged over the entire mapped region of the DR21 filament for different molecules with the purple region showing the velocity range used for determining integrated intensities. The dashed gray line denotes the main velocity of the filament, υLSR = −3 km s−1. The velocities of the un- or only marginally blended HFS components of DCN and H13CN are marked in black, with the relative intensity of the hyperfine components marked by the length. The LSR velocity scale of the DCN and H13CN J = 1−0 spectra corresponds to the strongest HFS component F = 2−1.
Current usage metrics show cumulative count of Article Views (full-text article views including HTML views, PDF and ePub downloads, according to the available data) and Abstracts Views on Vision4Press platform.
Data correspond to usage on the plateform after 2015. The current usage metrics is available 48-96 hours after online publication and is updated daily on week days.
Initial download of the metrics may take a while.