Open Access
Fig. 11
Download original image
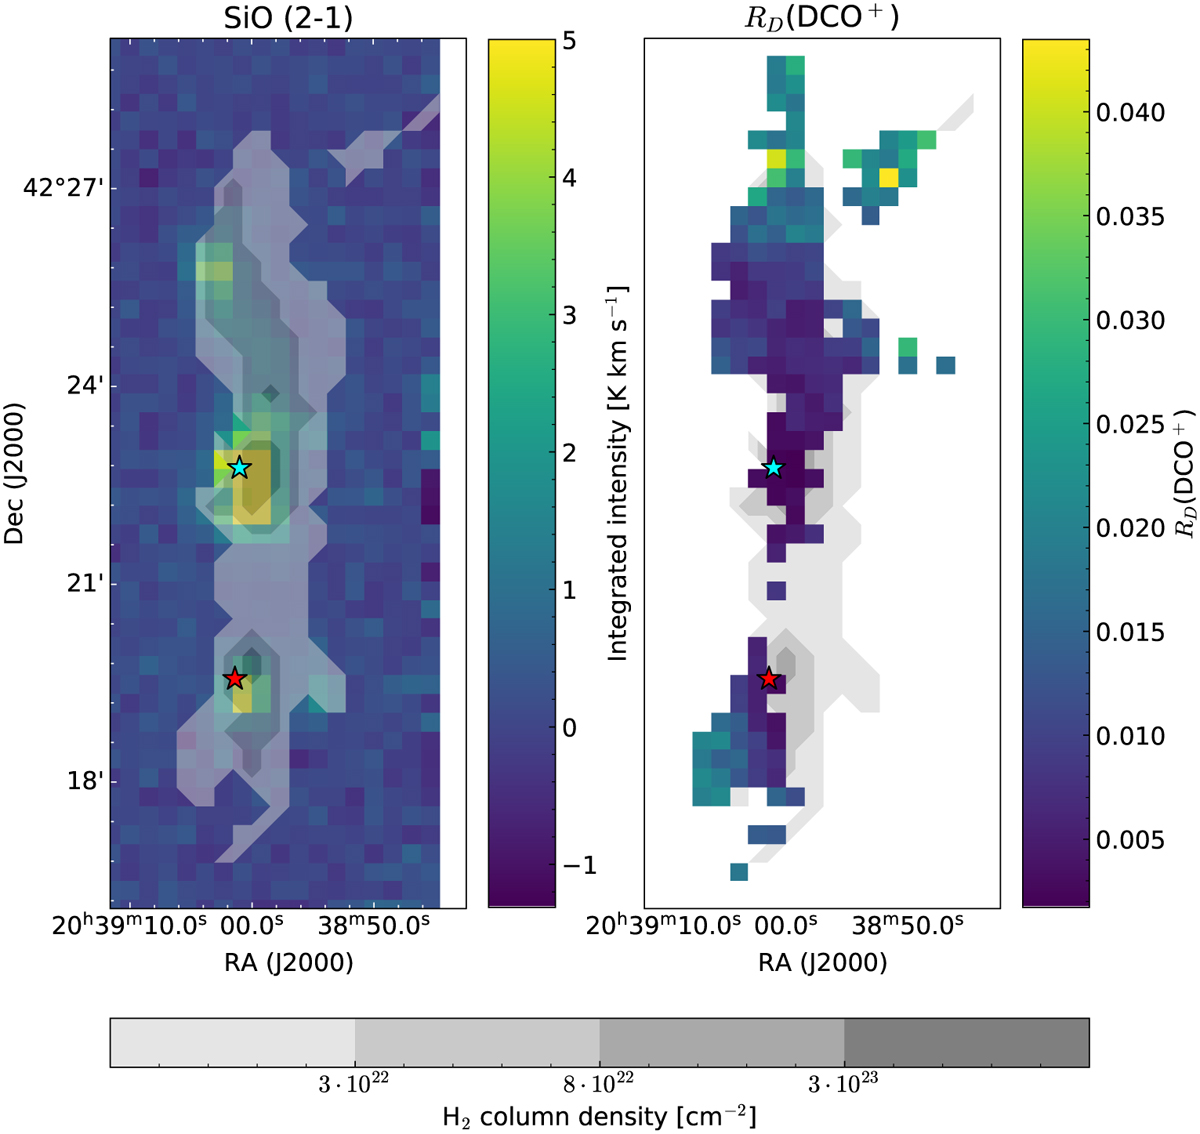
Distribution of SiO (2−1) integrated intensity (left panel) and RD (DCO+) (right panel) the DR21 filament. The gray scale shows the N(H2) column densities, where darker regions indicate higher column densities. The stars show DR21 Main (red) and DR21(OH) (blue).
Current usage metrics show cumulative count of Article Views (full-text article views including HTML views, PDF and ePub downloads, according to the available data) and Abstracts Views on Vision4Press platform.
Data correspond to usage on the plateform after 2015. The current usage metrics is available 48-96 hours after online publication and is updated daily on week days.
Initial download of the metrics may take a while.