Fig. 6
Download original image
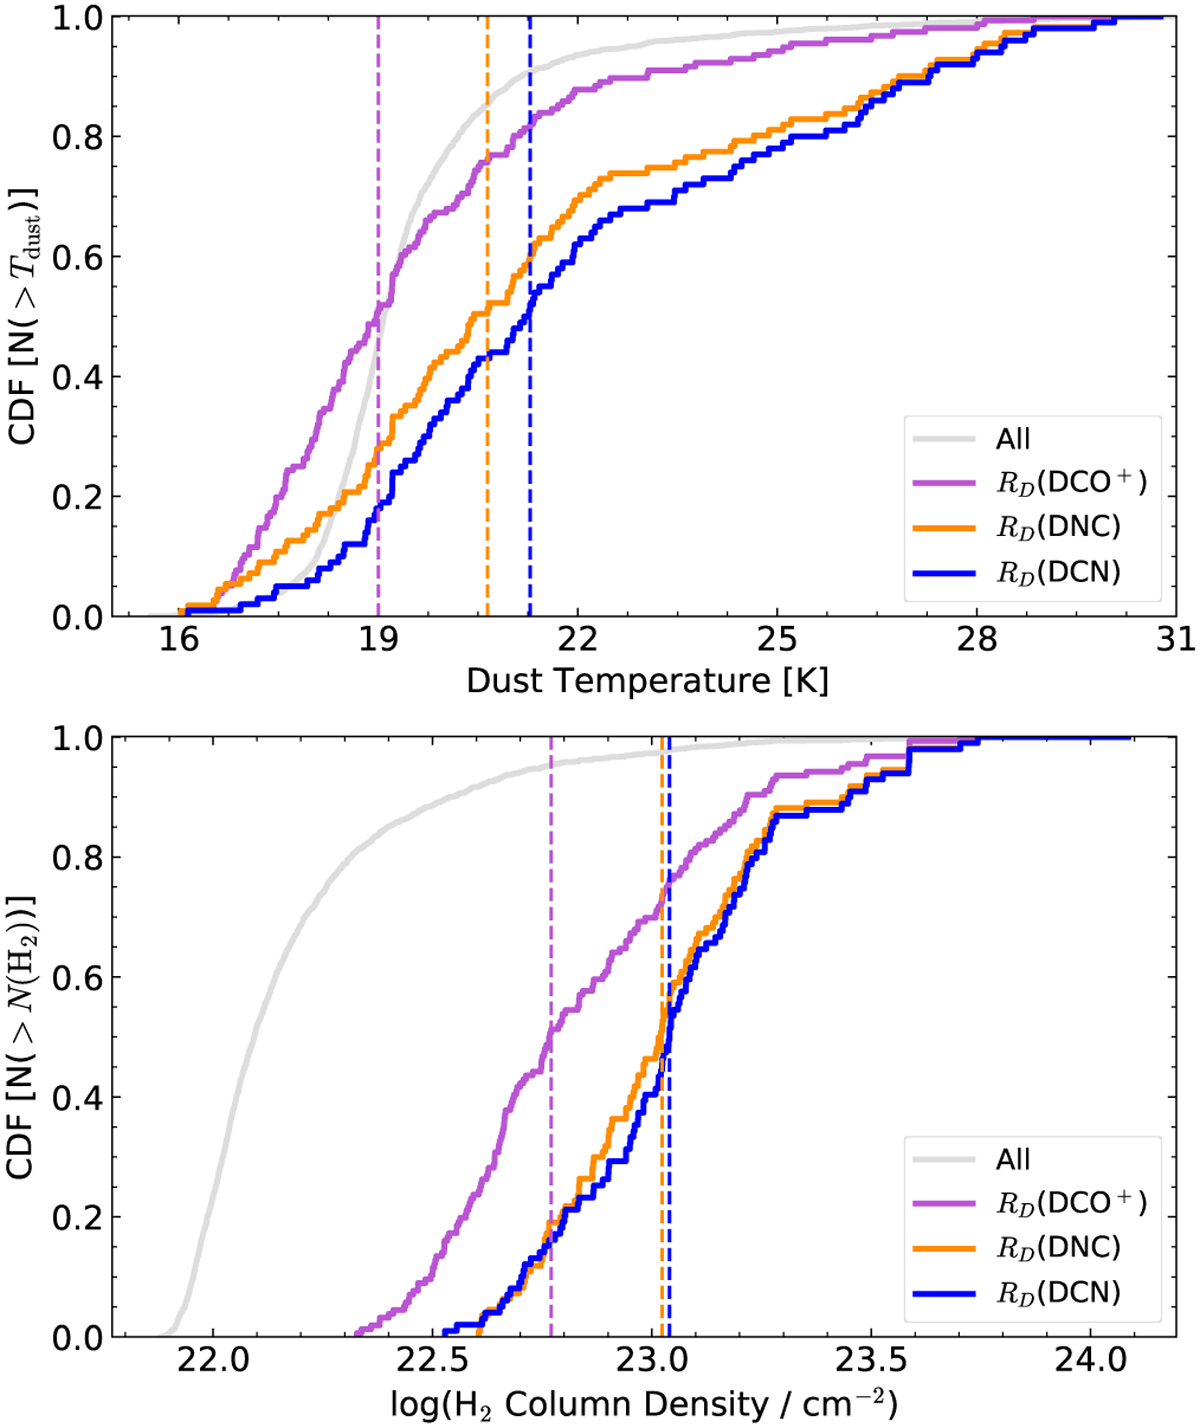
Cumulative distribution function (CDF) of dust temperature and H2 column density where DCO+ (purple), DNC (orange), or DCN (blue) is detected in the DR21 filament. The dust temperatures and H2 column density maps are taken from Bonne et al. (2023). The horizontal dashed lines marks the mean dust temperature or column density of the sampled distributions, colorized with the respective detected molecular ratio.
Current usage metrics show cumulative count of Article Views (full-text article views including HTML views, PDF and ePub downloads, according to the available data) and Abstracts Views on Vision4Press platform.
Data correspond to usage on the plateform after 2015. The current usage metrics is available 48-96 hours after online publication and is updated daily on week days.
Initial download of the metrics may take a while.