Fig. 1
Download original image
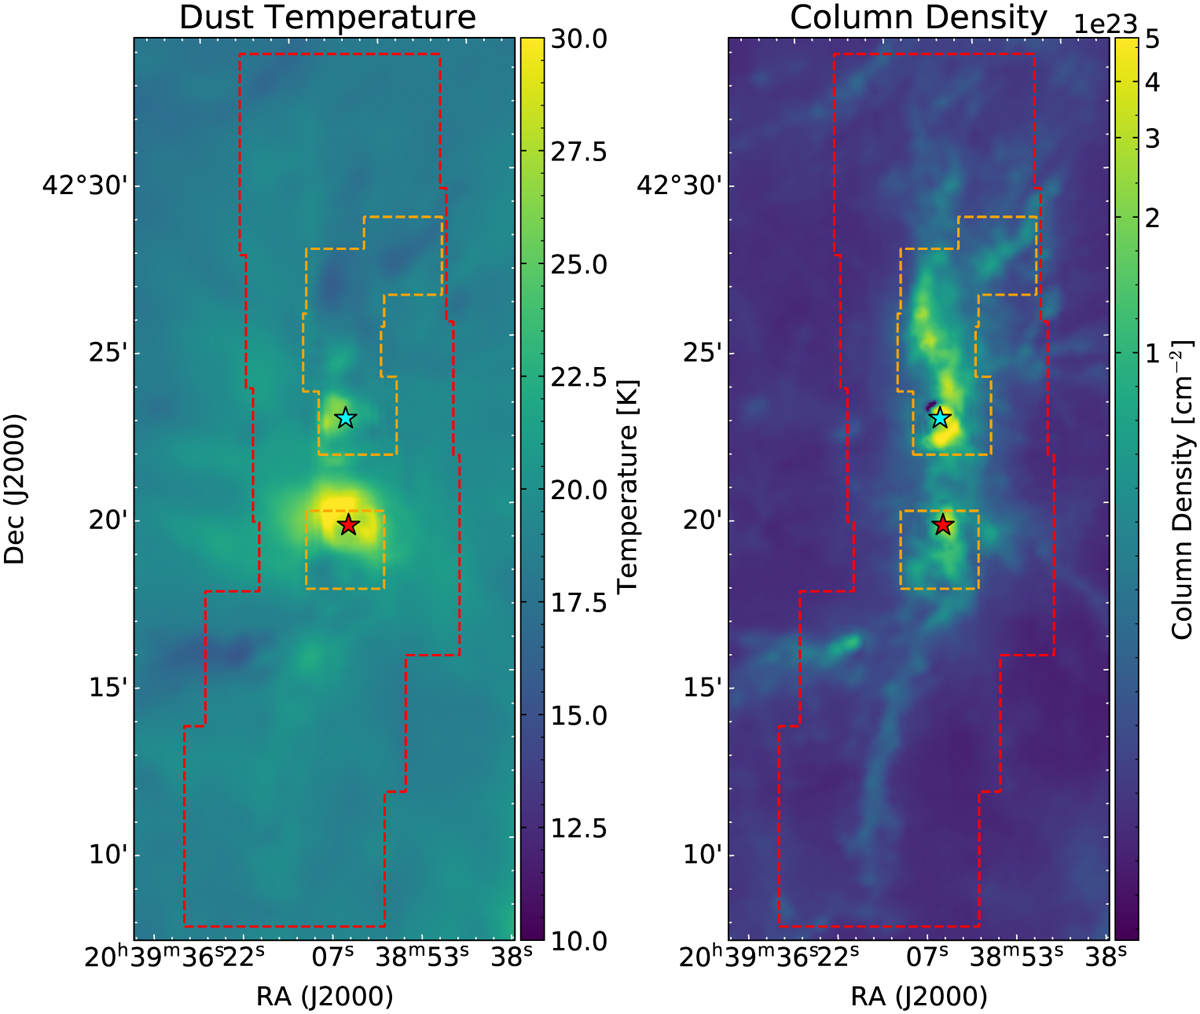
Maps of dust temperature (left) and H2 column density (right) of the DR21 filament taken determined by the HOBYS program (Motte et al. 2010). The stars in both maps indicate the positions of DR21 Main (red) and DR21(OH) (blue). The dashed red and orange lines show the coverage of CASCADE and follow-up observations, respectively.
Current usage metrics show cumulative count of Article Views (full-text article views including HTML views, PDF and ePub downloads, according to the available data) and Abstracts Views on Vision4Press platform.
Data correspond to usage on the plateform after 2015. The current usage metrics is available 48-96 hours after online publication and is updated daily on week days.
Initial download of the metrics may take a while.