Fig. 13
Download original image
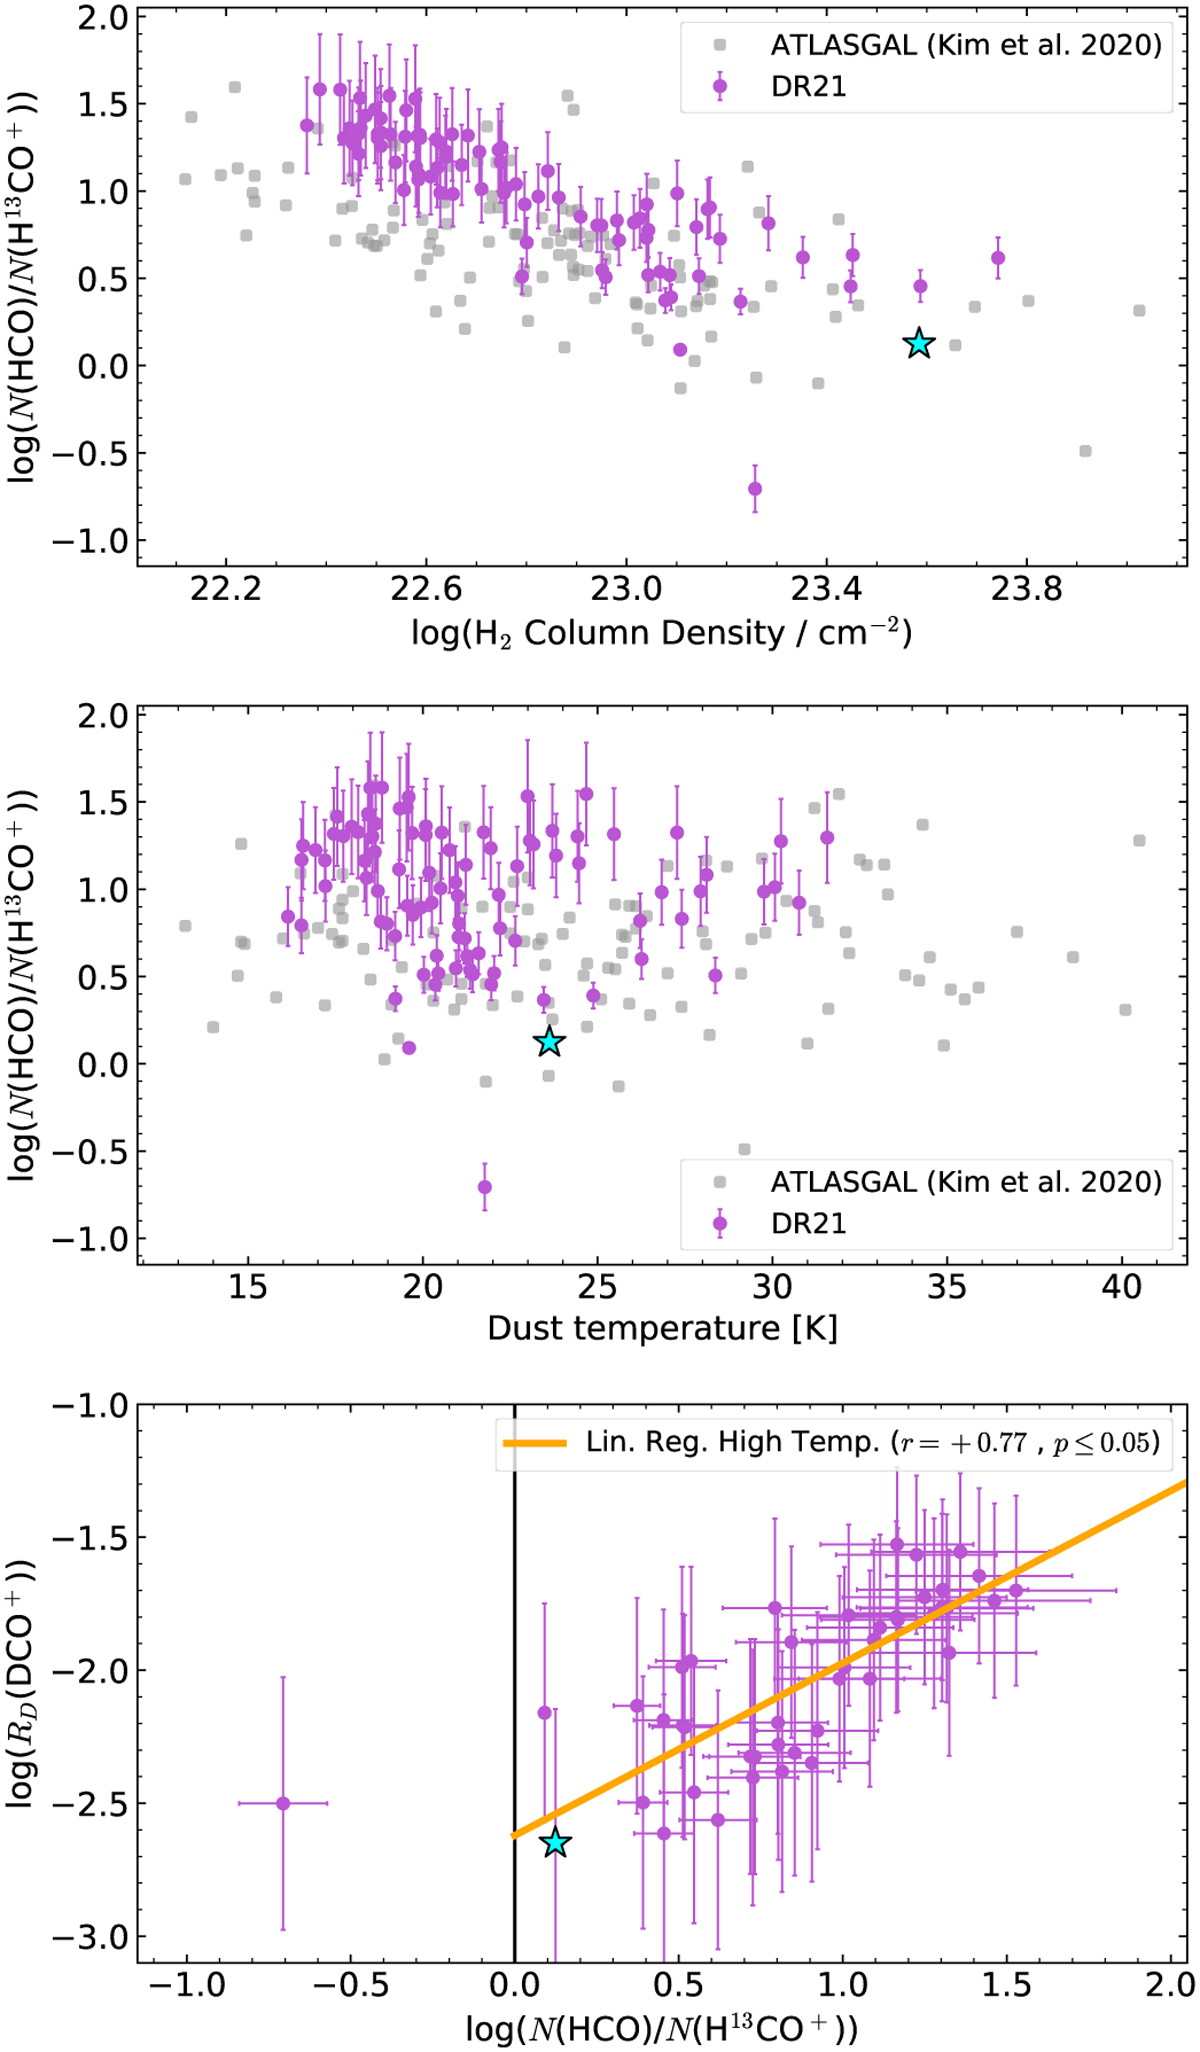
N(HCO)/N(H13CO+) vs. N(H2) (top panel) and dust temperature (middle panel). The bottom panel shows the correlation of N(HCO)/N(H13CO+) with RD(DCO+). The purple points represent pixels in the DR21 filament above 4σ and the gray point shows the ATLASGAL sources from Kim et al. (2020). The black vertical line represents the indicator of ongoing FUV chemistry ≥1 (Gerin et al. 2009; Kim et al. 2020). The blue star mark the surroundings of DR21(OH), where HCO, H13CO+ and DCO+ are detected.
Current usage metrics show cumulative count of Article Views (full-text article views including HTML views, PDF and ePub downloads, according to the available data) and Abstracts Views on Vision4Press platform.
Data correspond to usage on the plateform after 2015. The current usage metrics is available 48-96 hours after online publication and is updated daily on week days.
Initial download of the metrics may take a while.