Fig. 3
Download original image
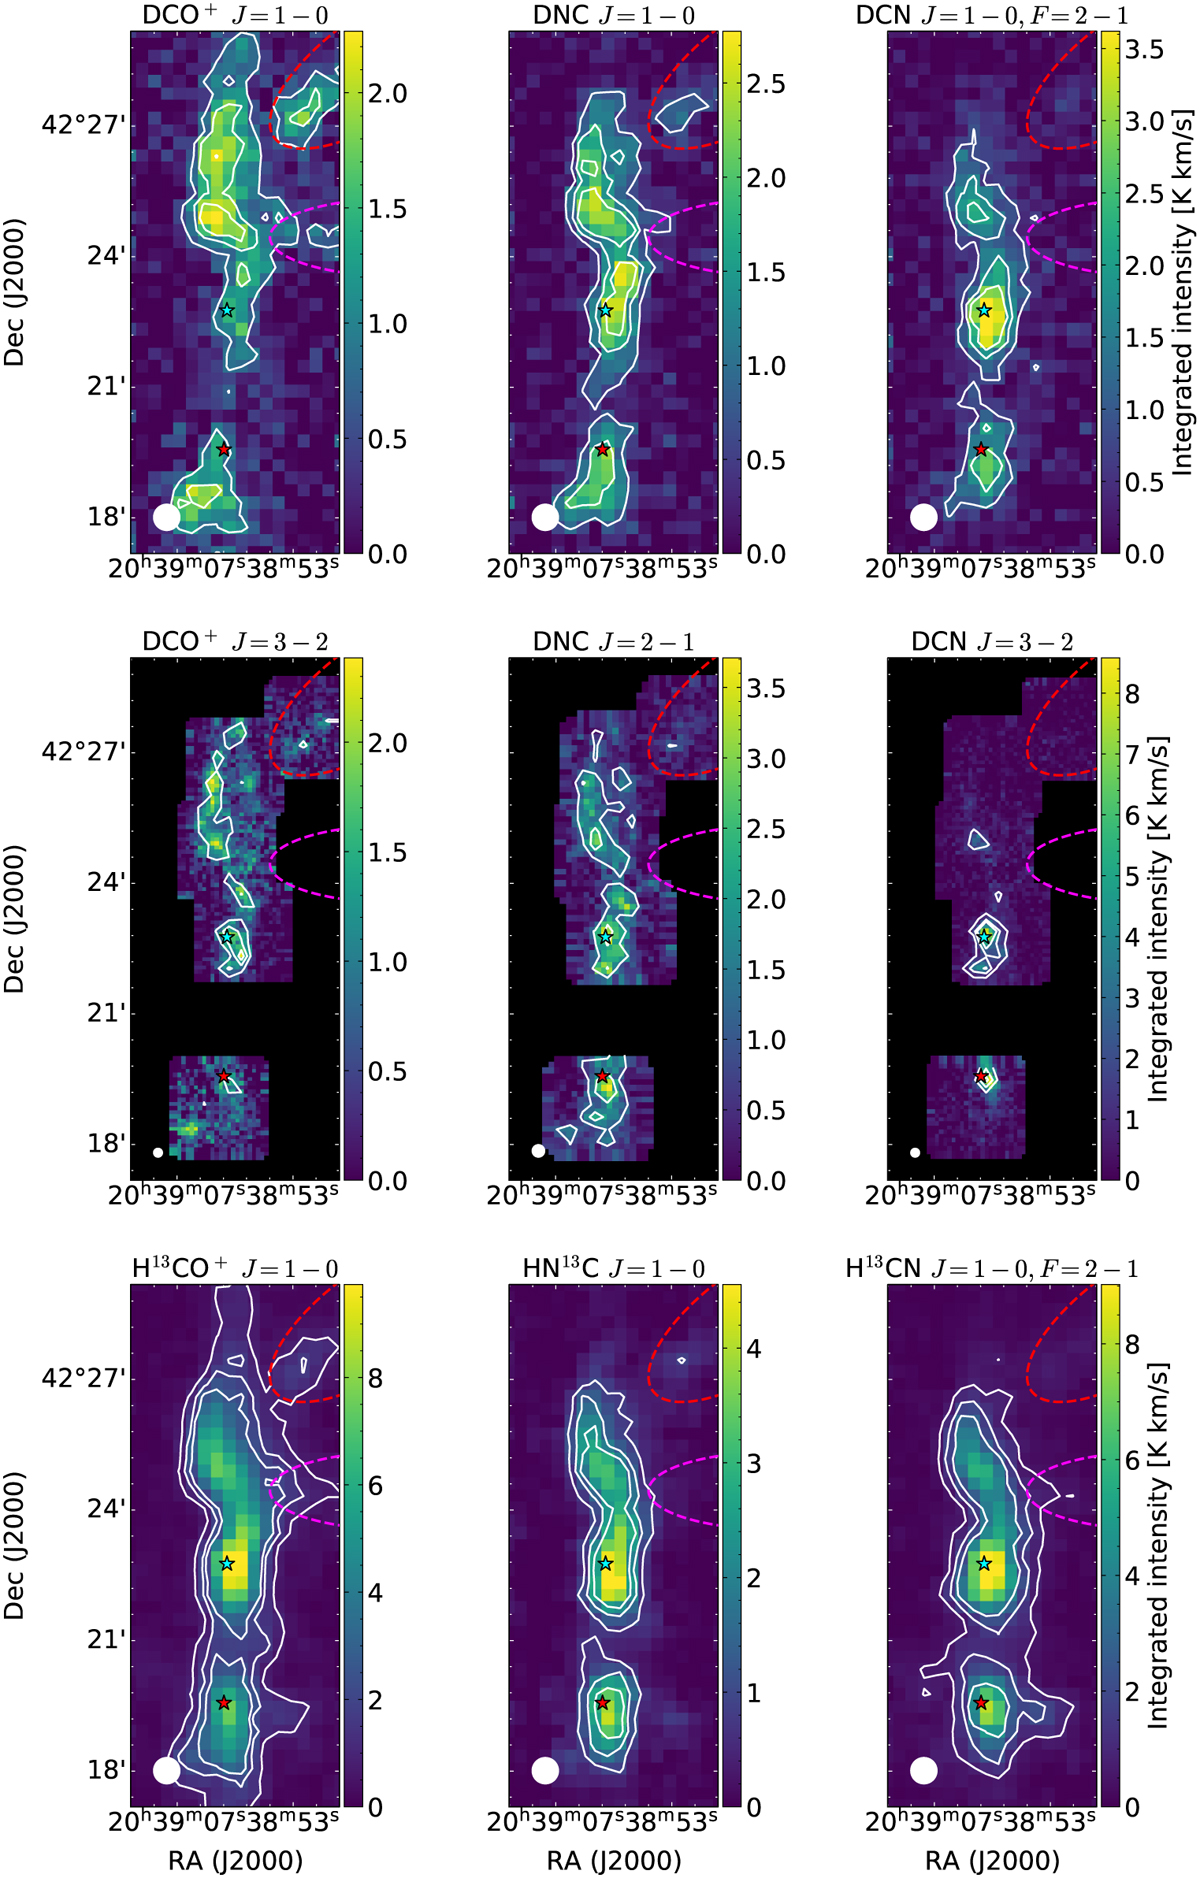
Velocity-integrated intensity maps of deuterated and 13C-isotopologs. Top and middle rows: Ground-state emission of DCO+, DNC, and DCN observed with the CASCADE-program and follow-up mapping with the IRAM 30-m telescope. Bottom row: Maps for 13C-isotopologs. The intensities in the maps are integrated over the velocity range −7 km s−1 to +0.5 km s−1. HPBWs are displayed by the filled white circles in the lower left corner of each panel. For example, the HPBW beam-size is 34″ for the map showing DNC (2−1), 16″ for DCO+ (3−2) and 11″ for DCN (3−2). The white contours are showing levels of 4σ, 8σ and 12σ. The stars mark DR21 Main (red) and DR21(OH) (blue). The locations of the F1 and F3 sub-filament (Schneider et al. 2010) are indicated by dashed red and magenta curves, respectively.
Current usage metrics show cumulative count of Article Views (full-text article views including HTML views, PDF and ePub downloads, according to the available data) and Abstracts Views on Vision4Press platform.
Data correspond to usage on the plateform after 2015. The current usage metrics is available 48-96 hours after online publication and is updated daily on week days.
Initial download of the metrics may take a while.