Fig. 2
Download original image
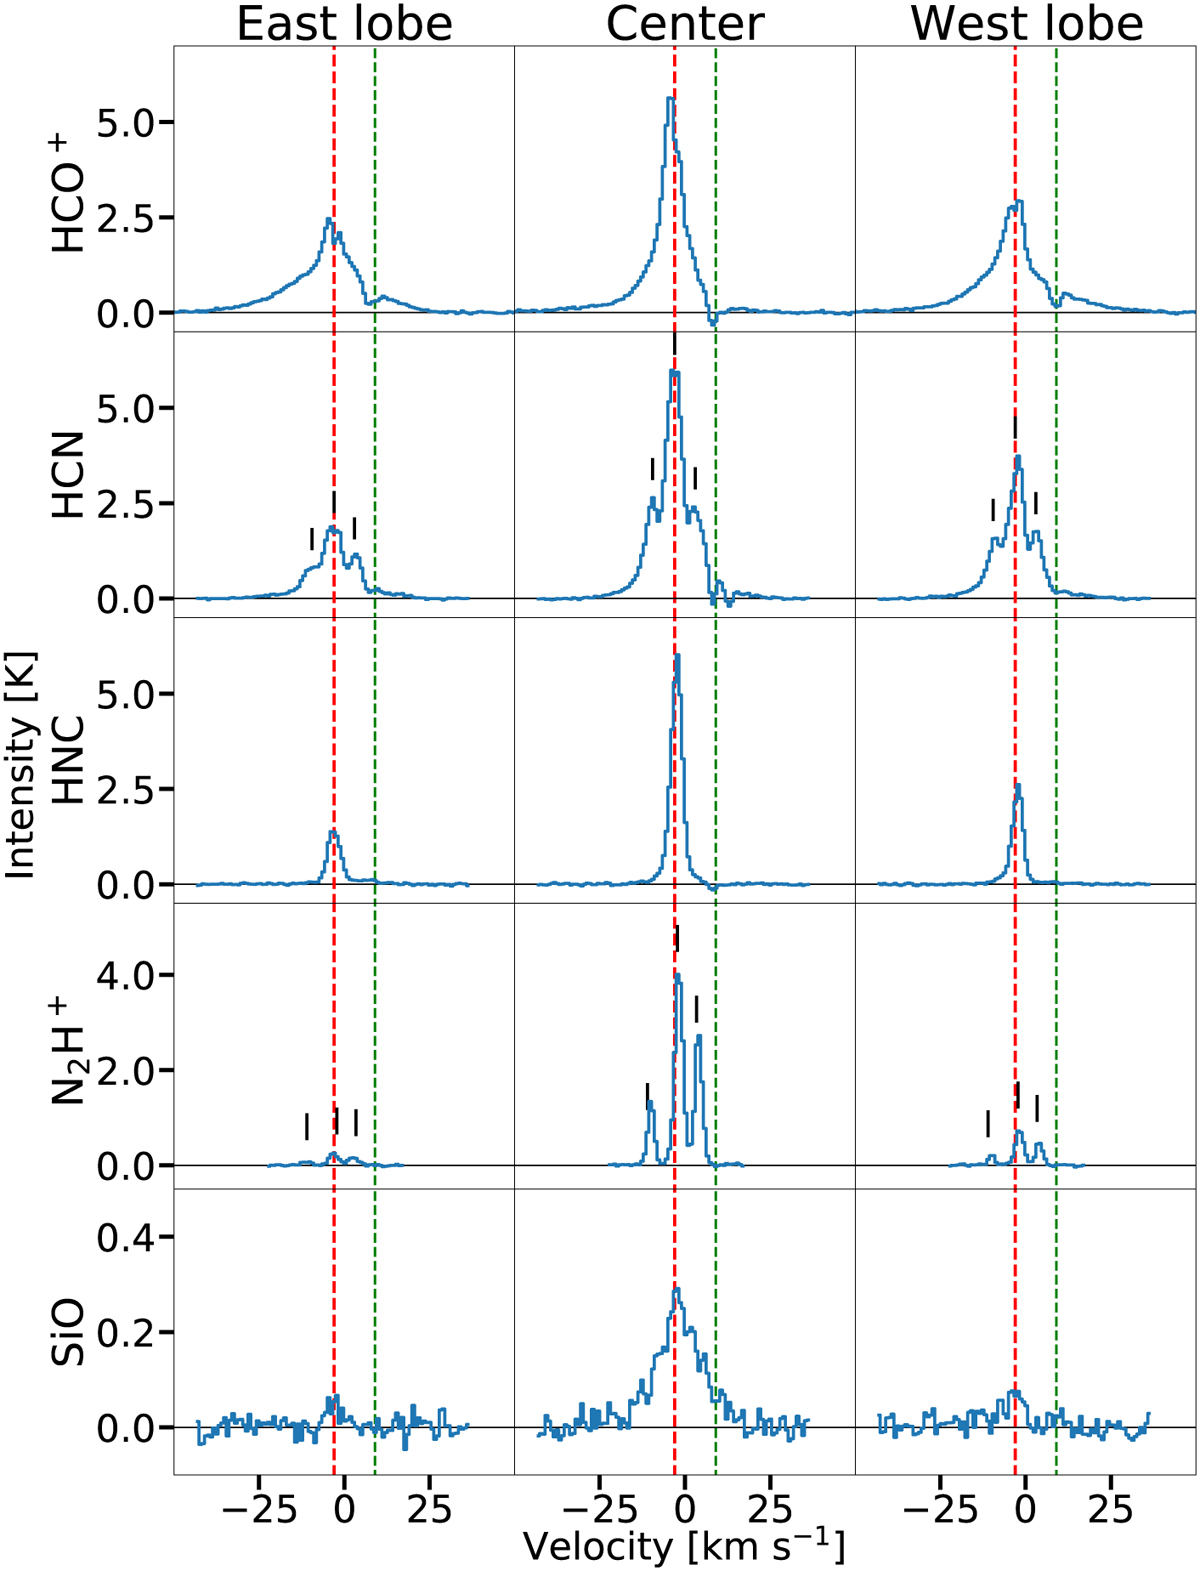
Averaged line profiles of the (1−0) transitions of HCO+, HCN, HNC, N2H+, and the (2−1) transition of SiO toward the eastern lobe, the center, and the western lobe of the DR21 Main outflow (see Fig. 1). For HCN and N2H+, the velocities corresponding to hyperfine structure components are marked with black ticks. Red dashed lines show the source velocity, −3 km s−1, green dashed lines mark the location of the absorption feature at 9 km s−1, and the gray horizontal lines show the baselines.
Current usage metrics show cumulative count of Article Views (full-text article views including HTML views, PDF and ePub downloads, according to the available data) and Abstracts Views on Vision4Press platform.
Data correspond to usage on the plateform after 2015. The current usage metrics is available 48-96 hours after online publication and is updated daily on week days.
Initial download of the metrics may take a while.