Fig. 4
Download original image
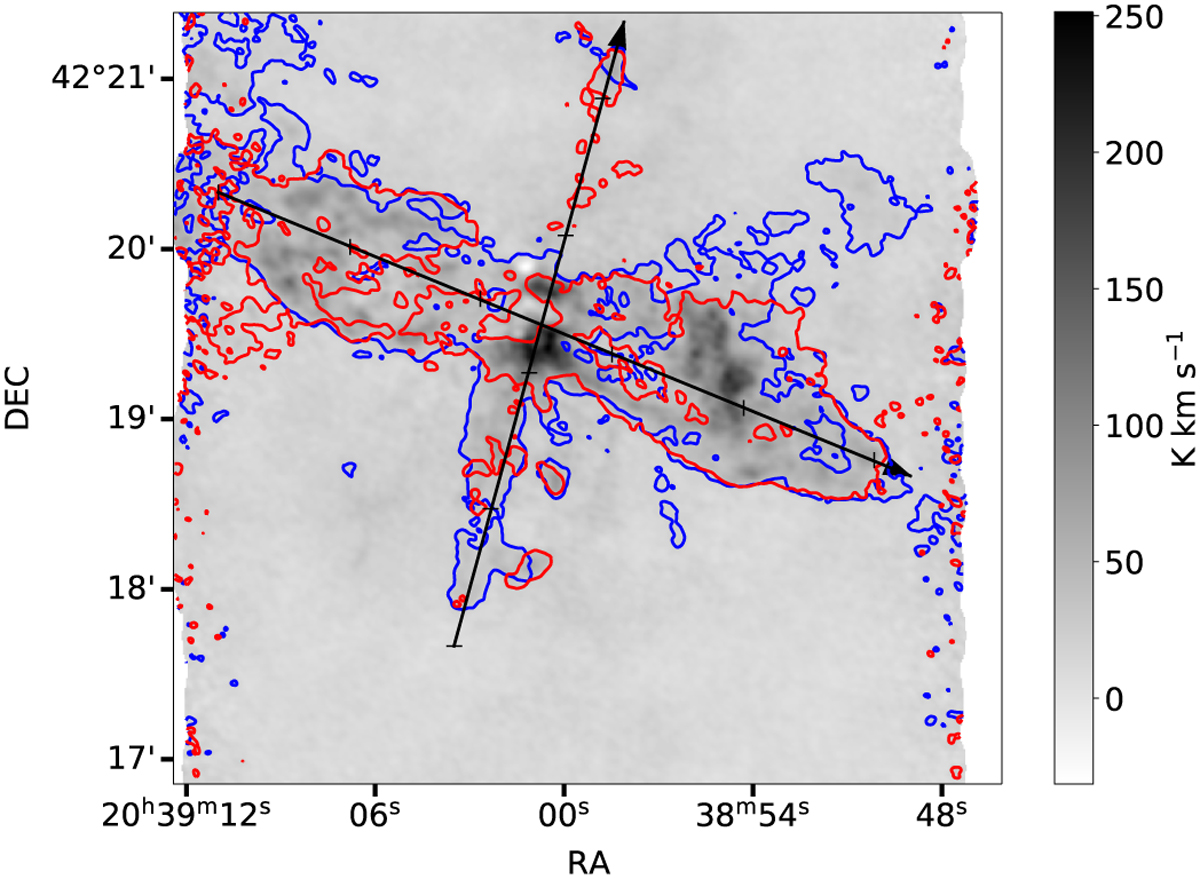
HCO+ emission integrated from −50 to 50 km s−1. Red and blue contours mark the redshifted (5 to 45 km s−1) and blueshifted (−5 to −45 km s−1) HCO+ emission, respectively. Contours correspond to 5 σrms emission and the velocity ranges are given relative to the source velocity (−3 km s−1). Black arrows mark the cuts for the PV diagrams (Figs. 5 and 6) and the ticks mark distances of 50 arcsec along the arrows.
Current usage metrics show cumulative count of Article Views (full-text article views including HTML views, PDF and ePub downloads, according to the available data) and Abstracts Views on Vision4Press platform.
Data correspond to usage on the plateform after 2015. The current usage metrics is available 48-96 hours after online publication and is updated daily on week days.
Initial download of the metrics may take a while.