Fig. 8
Download original image
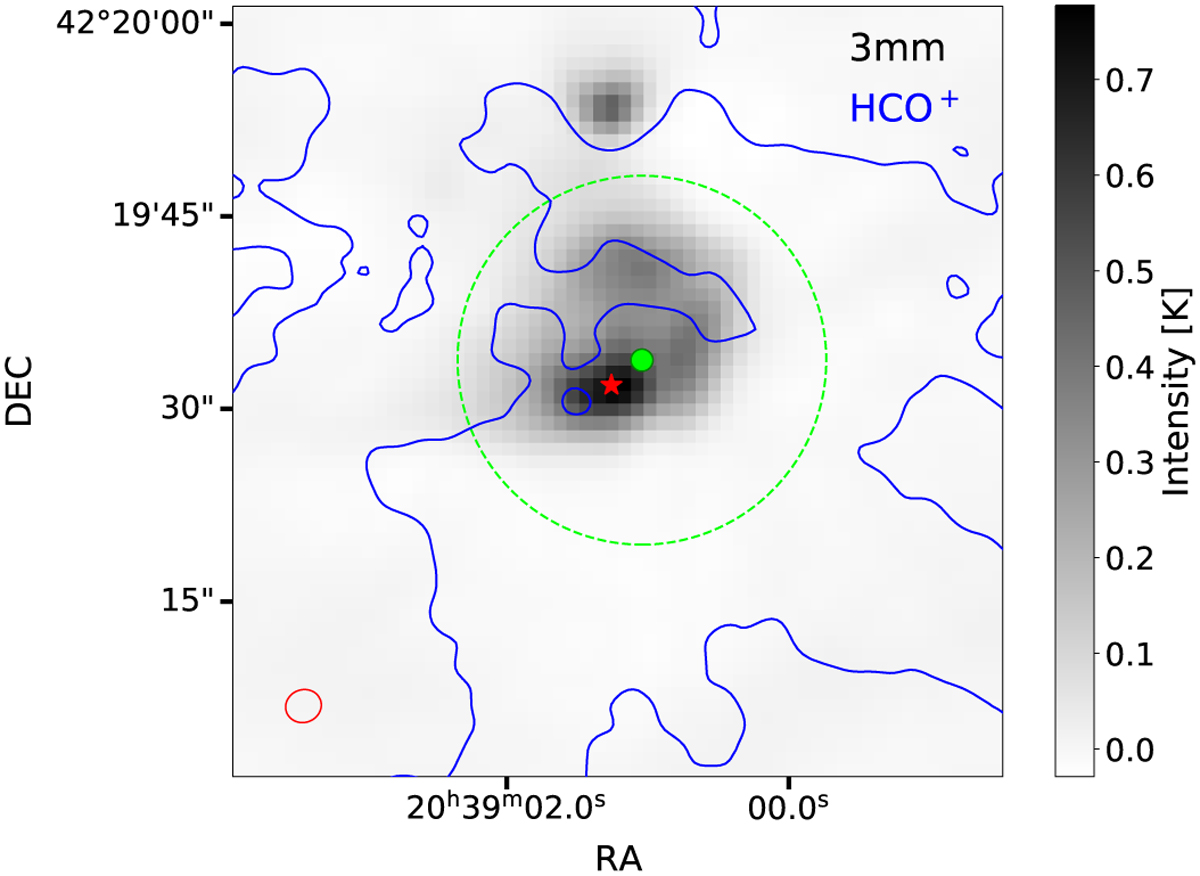
Image showing the 3 mm continuum emission in the area of DR21 Main. The peak of the continuum emission is marked with a red star, while the green circle marks the location of the dense core DR21-1 (Cao et al. 2019), and the green dashed line the FWHM. Blue contours mark the integrated HCO+ intensity (−50 to 50 km s−1), while the beam of the continuum observations is shown with the red ellipse.
Current usage metrics show cumulative count of Article Views (full-text article views including HTML views, PDF and ePub downloads, according to the available data) and Abstracts Views on Vision4Press platform.
Data correspond to usage on the plateform after 2015. The current usage metrics is available 48-96 hours after online publication and is updated daily on week days.
Initial download of the metrics may take a while.