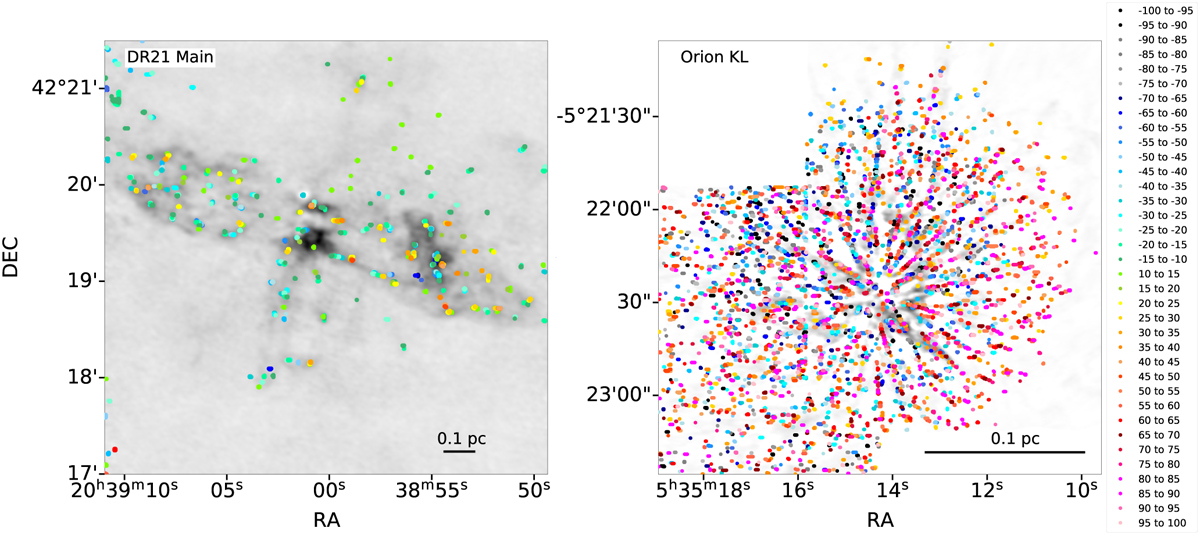
Fig. 9
Download original image
Distribution of gas velocities associated with the outflows in DR21 (left) and Orion KL (right, Bally et al. 2017). Each point shows a local intensity peak of the HCO+ emission (above 2 σ) integrated in velocity steps of 5 km s−1. The color of the points signifies the corresponding velocity steps and is the same for the two plots. Background grayscale shows the integrated HCO+ (left panel) and CO emission (right panel) over the entire velocity range of the outflows (from −70 to 70 km s−1 for DR21 Main and −100 to 100 km s−1 for Orion KL).
Current usage metrics show cumulative count of Article Views (full-text article views including HTML views, PDF and ePub downloads, according to the available data) and Abstracts Views on Vision4Press platform.
Data correspond to usage on the plateform after 2015. The current usage metrics is available 48-96 hours after online publication and is updated daily on week days.
Initial download of the metrics may take a while.